
 Wall Street Journal
 American Bazaar
 IQ Stock
 HT Syndication
 Hindustan Times
 Economic Times
Introduction
Immigration has been a controversial topic among economists and politicians for a long time. The issue became more pressing for researchers as immigrant inflows increased significantly in the late 1970s (Card, 2009). Labor economists first started studying the earnings gap between immigrants and natives more than 40 years ago. A big part of this literature is studying the adjustment of immigrants in the labor market of the host country (e.g. Chiswick, 1978; Borjas, 1985, 1994, 1999; Card, 2005).
Annually, many skilled immigrants come to the United States from all over the world and start working in the U.S. labor market. The United States has several temporary worker visa programs. The largest is the H-1B program. It allows U.S. businesses to temporarily hire high-skilled foreign workers (with at least a bachelor’s degree) whenever there is a shortage of skilled professionals in specific professions—especially in Science, Technology, Engineering, and Mathematics (STEM) fields—in order to improve economic growth and design innovative goods and services (Mithas and Lucas Jr, 2010). According to United States Citizenship and Immigration Services (USCIS), on average, about 240,000 H-1B visas per year were issued between 2007 and 2017 (U.S. Citizenship and Immigration Services, 2019).
This study exploits the rich and under-explored National Survey of College Graduates (NSCG), which provides a variety of socio-economic and demographic characteristics, including detailed information regarding education and residential status. We use the 2010, 2013, 2015, and 2017 waves of the NSCG and employ a cross-sectional approach to study the wage disparities between college graduate immigrant workers on work visas and their U.S.-born counterparts. We run our models on the pooled data, which includes all of the four waves, along with running them on each survey cycle separately. We also look further to see whether the earnings gap is different for men or women, immigrants with English as their mother tongue, immigrants with specific countries of origin, different fields of education, and various occupations.
There have been many public discussions about immigration of skilled workers to the United States. On one hand, U.S. businesses and the whole economy could benefit from hiring skilled foreigners on work visas. On the other hand, new high-skill immigration might have a negative effect on the wages of both foreign and native professional workers currently in the labor market. Research has found mixed results in this capacity. Some research shows that at least in some occupations foreign workers will substitute for and displace native-born workers, which can push down natives’ wages (e.g. Altonji and Card, 1991; Hunt, 1992; Goldin, 1994; Borjas, 2005; Orrenius and Zavodny, 2007; Doran et al., 2014; Bound et al., 2015, 2017; Monras, 2020). Some other studies, however, provide results that support the complementarity/synergy hypothesis, claiming that immigrant workers and the skill package they bring with themselves are considered complements to the native workers’ human capital and as a result cause an increase in the wages of native-born peers (e.g. Chellaraj et al., 2008; Mithas and Lucas Jr, 2010; Hunt and Gauthier-Loiselle, 2010; Kerr and Lincoln, 2010; Kerr et al., 2015; Peri et al., 2015; Aobdia et al., 2018; Bourveau et al., 2019).
Another policy issue is that foreign skilled workers might be thought of as a cheap source of labor for the United States. That is why it is important for researchers and policy makers to know whether or not workers on work permits are paid any different compared to native workers. Although some studies find that temporary workers on average have lower wages compared to natives (e.g. Mukhopadhyay and Oxborrow, 2012; Lindsay Lowell and Avato, 2014; Bourveau et al., 2019), a larger number of studies (including this research) find a wage premium for workers in various fields on a temporary work visa compared to natives (e.g. Lofstrom and Hayes, 2011; Aobdia et al., 2018; Mithas and Lucas Jr, 2010; Drago, 2014).
Our results show that foreign workers are not a cheap source of labor. After controlling for socio-economic and demographic characteristics, by using the pooled data, we find that highly educated immigrants who hold temporary work visas have about 29.5 log point (29.5%) wage premium over U.S.-born natives. However, our findings show a significant decline in this premium from 2010 to 2017 (from 63.5% to 17.4%), which is similar to what Drago (2014) finds. One of the contributions of this research to the literature is to also study the native-work visa wage gap based on gender, country of origin, English mother tongue, occupation, and field of education. Our results show that the wage premium is not different for men or women. It is less for individuals originally from certain countries such as India and Iran and more for English-speaking immigrants.
Using the 2010–2017 pooled data, we find heterogeneous results for different occupations and fields of education. For instance, while our results show a 20.5% premium for work visa individuals over natives with an education in engineering, the premium jumps up to 44% when we study individuals with a college degree in social sciences. In addition, our findings show that in computer & mathematical science related, non-science and engineering related, and health related occupations, those on temporary work visas on average make 14%, 38%, and 28% more than native workers, respectively. However, we find no evidence for a wage difference between natives and immigrants on work permits who have other fields of education or are working in other occupations.
Different reasons or a combination of them could cause the wage premium for individuals with a temporary work visa when compared to natives. One reason could be that it is hard to control for the ability and motivation of the individuals in our sample. Immigrants in general could be more able and more motivated, which can make them more productive and explain higher wages. Another explanation for the premium could be the selectivity among immigrants (Dustmann and Weiss, 2007). Not only might it be true that the more capable of other countries’ nationals decide to migrate and will be able to get a U.S. work permit, but it also might be true that out of all who get a temporary work visa and start working in the United States, only those who are capable enough to keep being successful in their careers will stay—the rest may return.
Another reason why highly educated professionals who have migrated to the United States are being paid a premium over their U.S.-born counterparts could be that the U.S. labor market demands more of these workers than there is supply for. According to a USCIS report, the number of H-1B visas issued per year went up from 192,276 in 2010 to 348,162 visas in 2016 (U.S. Citizenship and Immigration Services, 2019). This increase in the supply of highly educated skilled workers could be one of the reasons for the decline in their wage premiums over 2010–2017 period. This suggests that developing a merit-based immigration program to ease the immigration rules for such elite workers would change our findings (Drago, 2014; Sparber, 2018). Another policy implication could be that the United States government should encourage U.S.-born natives to pursue training and education that meets the needs of the U.S. labor market.
Background of U.S. Temporary Work Visas
According to the United States Department of State and USCIS, the United States has a variety of temporary work visa categories. However, the H-1B program is by far the largest (U.S. Department of States, 2020; U.S. Citizenship and Immigration Services, 2020b). Table 1 gives a brief general description of these categories.
The H-1 temporary worker visa was first established in 1952 as part of the Immigration and Nationality Act. It let foreign workers “of distinguished merit and ability” fill some positions temporarily. The H-1program had no caps or conditions to protect U.S. workers at the time. It only had a requirement that both the worker and the job should be temporary (even this requirement was removed in 1970). In 1990, the H-1 program was divided into two types: H-1A and H-1B. The H-1A was only to bring educated nurses in the U.S. to fill the nursing shortage, and it was stopped in 1995. H-1B was at the time for all non-nursing skilled occupations. It required at least a bachelor’s degree or equivalent (Lofstrom and Hayes, 2011).
Employers in the technology industry can temporarily hire workers in “specialty occupations” through the H-1B program. Many occupations in the tech industry qualify as specialty occupations. The main and initial purpose of the H-1B program is to help employers who cannot hire people with skills and abilities that they need from the U.S. market (Drago, 2014).
The H-1B visa is valid for three years and can be renewed only for one more three-year term (with some exceptions). For an H-1B visa to be approved, the United States Department of Labor must confirm that the applying foreign worker will not displace or adversely affect the wages or working conditions of U.S. workers. To address concerns about foreign workers replacing domestic workers, Congress caps the number of visas that can be issued every year. The congressional cap on H-1B has changed frequently, as concerns about advantages and disadvantages of bringing skilled workers to the U.S. have influenced legislation. Until 1998 the cap of 65,000 H-1B visas per year was set and not changed. It changed to 115,000 for 1999 and 2000 and increased to 195,000 for the next three years. Then it was again decreased to 65,000, and that is still the case. However, almost every year the number of H-1Bs issued exceeds the cap because, based on the current regulations, employers that are government research institutions, universities, or other nonprofits are exempt from the cap. Furthermore, up to 20,000 H-1B visas beyond the cap are available to those foreign temporary workers who have earned a master’s degree or higher from a university inside the United States (Lofstrom and Hayes, 2011; Drago, 2014).
Setting efficient visa caps is highly important. Setting them too low may constrain domestic industries and lead to such industries moving to locations outside of the United States. For instance, Microsoft established a complex in Canada for 150 foreign professionals that it could not bring to the United States due to restrictive H-1B visa caps in 2007. However, setting the annual caps too high can lead to some concerns about protecting American jobs and wages (Mithas and Lucas Jr, 2010).
It is also very important to protect foreign workers from discrimination and inequality in wages. That is why when employers file their H-1B applications to the Department of Labor (DOL), they should show that they are at least paying the ”prevailing wage” in the field (determined by the DOL) to the employee for the duration of that worker’s authorized period of stay. After filling and submitting the Labor Condition Application (LCA) to the DOL to justify the need for hiring the employee, employers are required to pay the higher of the offered wage for the position or the prevailing wage for that position, which will be enforced by the DOL’s Wage and Hour Division (Drago, 2014).
H-1B holders could change their employers if the new employer does the sponsorship for a new H-1B visa. This causes some mobility and to some extent frees such workers from being stuck in one job. One of the biggest advantages of H-1B compared to other temporary work visas is that while working on the h-1B visa, employees can start the process of acquiring an employment-based permanent residence (Green Card) (Lofstrom and Hayes, 2011).
Table 1. U.S. Temporary Work Visa Categories
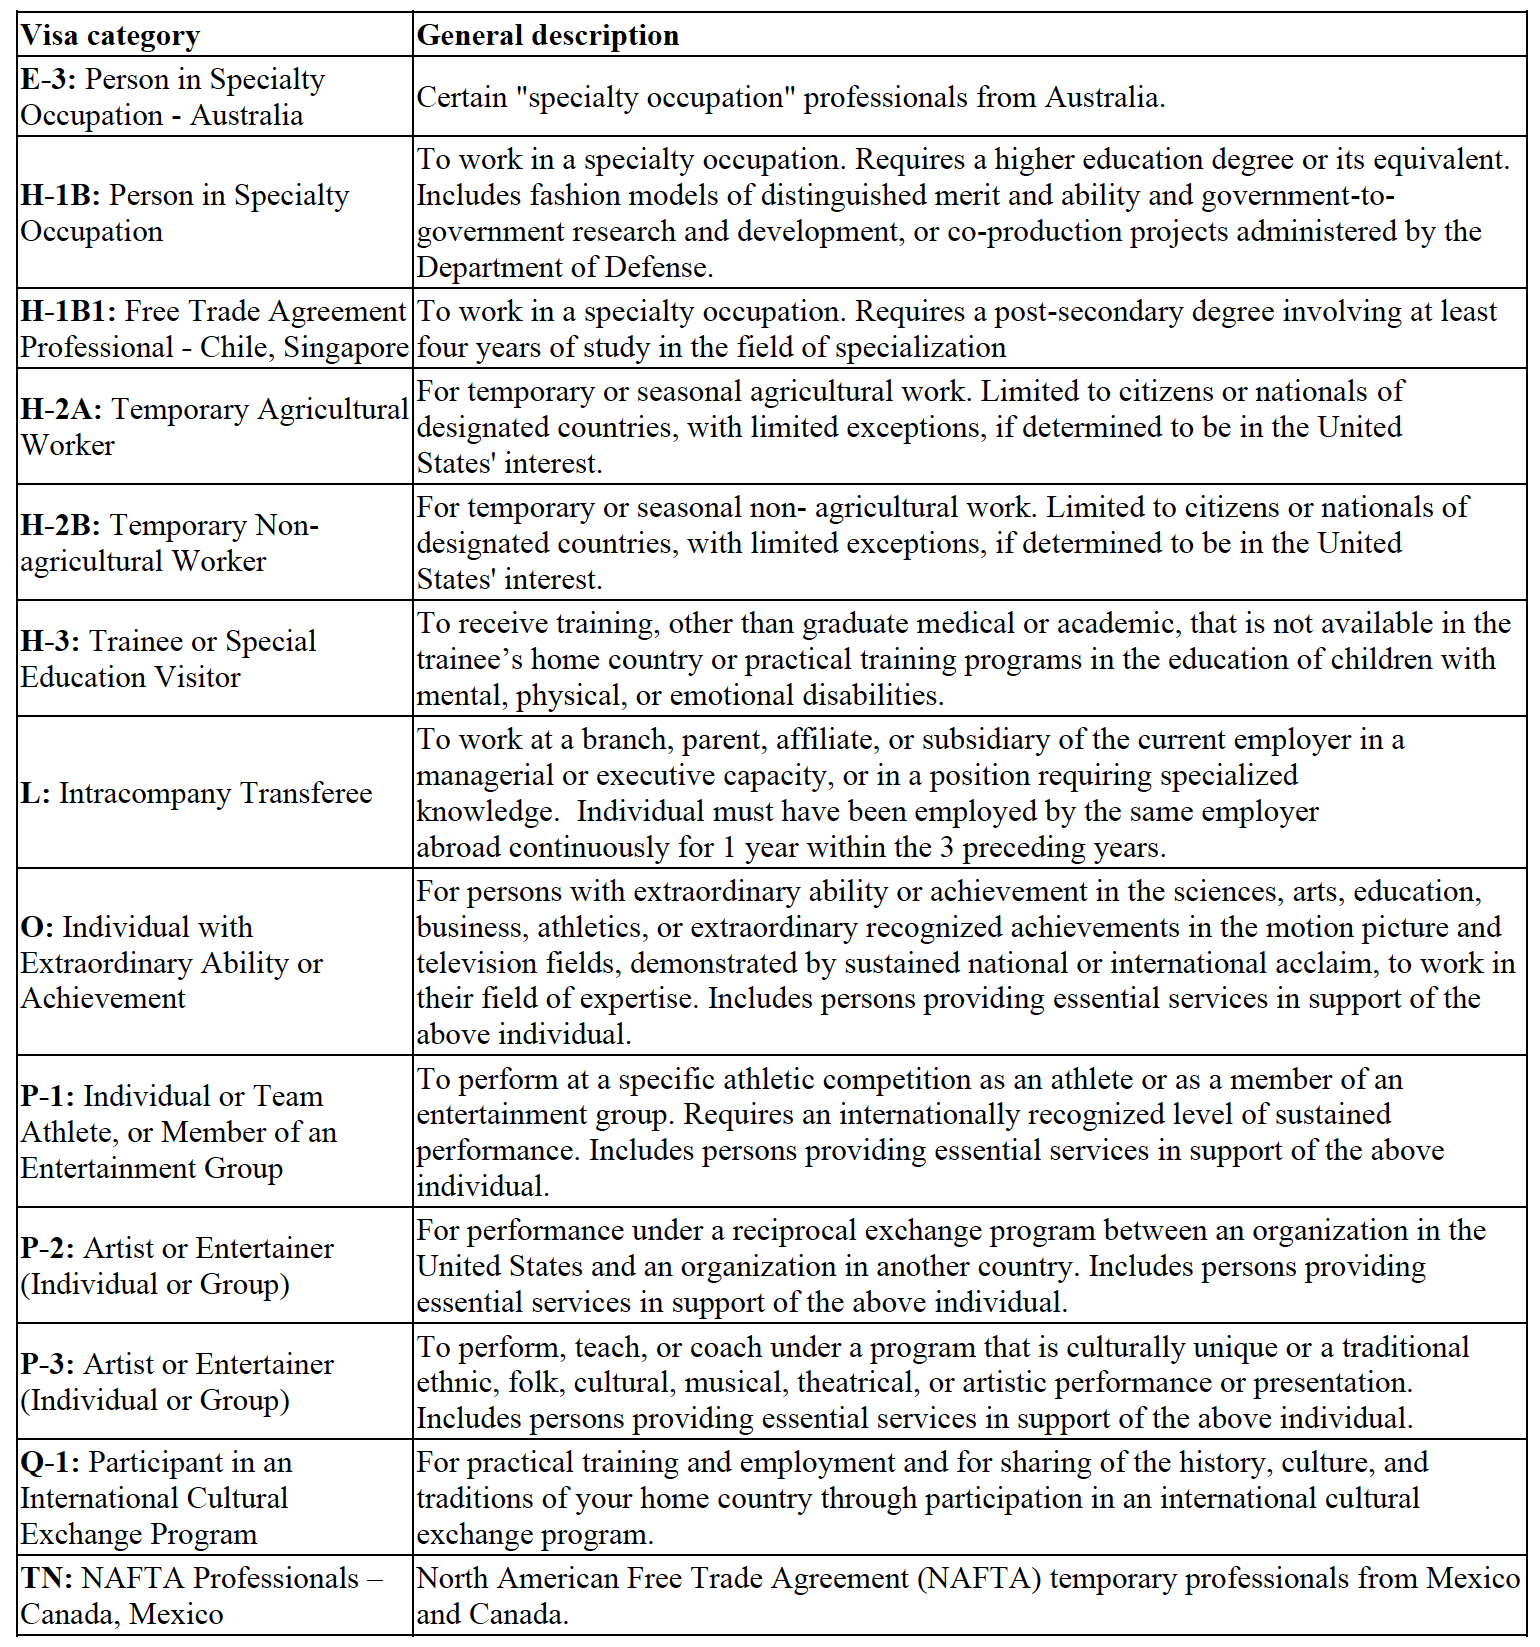
Sources: U.S. Department of State and U.S. Citizenship and Immigration Services
As discussed briefly earlier, H-1B has always been a controversial program and caused serious public debates. Other temporary work visa programs are generally less controversial than the H-1B program. This is probably for two reasons: a. the number of H-1Bs is bigger and consequently could have a more significant impact on the U.S. labor market, and b. an H-1B can more easily be changed to a green card (Lofstrom and Hayes, 2011). One issue has always been making sure that companies dependent on H-1B show good faith and hire from abroad only when they cannot find what they need in the domestic labor market. The other issue is the need for changing the educational structure in the U.S., so tech industries will not be so dependent on non-natives. In addition, discrimination against temporary workers has been a concern to the public (Drago, 2014).
Unfortunately, the NSCG does not clarify the exact type of temporary work visas and it includes all of the temporary work visa programs that are mentioned in table 1. However, as mentioned before, the H-1B program is significantly larger and more common than other temporary work visa programs.
Data and Descriptive Statistics
As mentioned earlier, this study exploits the National Survey of College Graduates (NSCG). The NSCG is sponsored by the National Center for Science and Engineering Statistics (NCSES) within the National Science Foundation (NSF) and is collected by the U.S. Census Bureau. The National Survey of College Graduates is a repeated cross-sectional biennial survey that provides data on the nation’s college graduates, with particular focus on those in the science and engineering fields. The program has been conducted since 1993. This survey samples individuals who are living in the United States during the survey reference week, have at least a bachelor’s degree in any academic discipline, and are under the age of 76 (National Science Foundation, 2019).
The 2010, 2013, 2015, and 2017 cycles of the NSCG data is used in this study. They provide coverage of the nation’s college-educated population as of the survey reference date. NSCG is a unique source for examining various characteristics of college-educated individuals, including occupation, salary, the three highest university degrees along with the majors, whether each degree was received in the U.S., the type of entry visa for immigrants and their current residency status, and other detailed demographic and socio-economic information (National Science Foundation, 2019).
Many administrative datasets provide researchers with a smaller set of characteristics of each observation/individual, and in most cases detailed education-related information is not included. The amount of detailed information given by NSCG regarding the education and employment of each individual in the sample is exceptional. Its focus on the college-educated population is also an advantage of this dataset.
The 2010, 2013, 2015, and 2017 survey cycles include 77,188, 104,599, 91,000, and 83,672 individuals, respectively. Our study keeps only those who are living and working inside the United States during the survey reference week and are 65 years old or younger. In order to avoid bias in our estimates, we also drop all of the observations who claim their current residency status to be ”study or training visa,” ”dependent visa,” or ”other visa.” Due to legal limitations, there is a high probability that such individuals work at pay rates that are lower than market rates. For instance, those who are working on study or training visas1Such as F-1 student visa, Optional Practical Training (an extension to F-1 that enables international students to work for a certain period of time after graduation in the United States), M-1 visa for vocational schools, or J-1 visa for exchange students (U.S. Department of Homeland Security, 2020; U.S. Citizenship and Immigration Services, 2020a) are limited to either apprentice-type jobs or lower paying post-doctorate positions.
Hourly wage is our dependent variable in this study, which is derived for each individual using annual salary, number of weeks worked per year, and number of hours worked per week. Based on the data, it seems that some respondents have confused annual weeks and months, or weekly and daily hours, or for any other reason have reported too big or too small annual salaries. As a result, another level of filtration is applied to only keep those individuals who earn more than or equal to the federal minimum wage ($7.25 for all four years) and less than $300 per hour.2About 1% of observations have wages higher than $300 per hour. Sensitivity analysis was performed to see how different the regression results would be without removing observations with hourly wages higher than $300. Results do not show considerable changes in estimated coefficients.
After dropping observations that do not meet the criteria explained above and also removing observations with conflicts, errors, or missing information, we are left with 56,190 observations in 2010, 77,512 in 2013, 69,184 in 2015, and 62,155 in the 2017 cycle. 57.5%, 54%, 54%, and 55.3% of the 2010, 2013, 2015, and 2017 samples are male, respectively. In the 2010 cycle: 78.1% of observations are natives; 15.23% are naturalized U.S. citizens; 5.03% are permanent residents (Green Card holders); and 1.74% are on temporary work visas. The respective percentages for the 2013 cycle are 80.63%, 12.57%, 4.73%, and 2.07%; for the 2015 cycle: 78.89%, 13.6%, 4.95%, and 2.55%; and for the 2017 are 77.07%, 14.6%, 5.58%, and 2.75%, respectively.
Table 2 presents descriptive statistics for the pooled sample using survey weights. As can be seen in table 2, immigrants on average have a larger hourly wage compared to natives, while the average ages of immigrants and natives are quite similar. The kernel density plots in figure 1 show that wages of immigrants and natives are distributed similarly, so there is no need to extend the wage analysis beyond mean regressions. According to table 2, within immigrants, temporary residents on work visas have the highest hourly wages compared to individuals with other residency statuses.
As mentioned earlier, H-1B is by far the largest work visa program, and in order for an H-1B visa to be issued, there should be evidence that the applicant is highly skilled and that no American who is qualified enough is available for that job. Therefore, it makes sense that these people on average get paid higher than other immigrants. The second highest hourly wage is earned by naturalized citizens. This might be because of one or more of the following reasons: a. higher average of years since migration (YSM),3According to the immigration literature, due to the assimilation process, the higher the YSM, the better the economic outcome of the immigrant (e.g. Chiswick, 1978; Borjas, 1985, 1994, 1999; Card, 2005; Chiswick and Miller, 2011; Borjas, 2015; Rodríguez-Planas and Vegas, 2014). b. lower age at the time of migration to the U.S.4This means these people are exposed to American education, job market (experience), culture, language, etc. from a younger age and could be better adapted to match U.S. labor market needs., and c. having U.S. citizenship, which might be advantageous in the U.S. labor market.
As shown in table 2, naturalized immigrants are on average the oldest group, while individuals on work visas are the youngest. In addition, naturalized citizens have the lowest mean of age at arrival (age of 19–20), while this age is significantly higher for other groups. Temporary workers and permanent residents migrated to the U.S. when they were on average about 27–28 years old. Regarding years since migration (YSM), on average, it is about 26 years for naturalized citizens, 14 years for permanent residents, and more than 7 years for immigrants working on work visas.
As can be seen in table 2, education level is on average higher in immigrants as compared to natives. Although the majority of both natives and immigrants hold bachelor’s degrees, immigrants have fewer bachelor’s degrees and more master’s and doctorate degrees. Among immigrants, the work visa group is ranked highest for post-graduate degrees. This group of immigrants is actually supposed to be well educated and well trained to get the high-skill jobs. About 59% of immigrants earned their highest degrees from a university inside the United States.5Universities and colleges of the United States are considered to provide high quality education to their students and enable them to get hired for proper jobs in the U.S. labor market. Many foreign students come to the United States each year in hopes of receiving high quality education. Although about 69% of naturalized citizens in our pooled sample obtained their highest degrees from a U.S. college or university, only about 39% of green card holders and 38% of temporary workers have U.S. degrees.
Table 2 also shows the distribution of education in different disciplines within each group of the weighted sample. As can be seen, computer and information technology related fields (the main need of tech industry) have the largest share (27%) of individuals on temporary work visas. Annually, a big chunk of available H-1Bs are issued for applicants who have college education in such fields, which shows the need of the U.S. for these skills (U.S. Citizenship and Immigration Services, 2019). Nevertheless, less than 4% of natives in our sample have education in computer and IT. While Mathematics and Statistics related or Physics related majors do not have a big share in most of the groups, engineering and other science and engineering related fields have quite considerable shares. As can be seen, the majority of natives hold degrees in non-science and engineering (non-S&E) fields, while the majority of immigrants hold degrees in science and engineering fields. 50% of immigrants with temporary work visas hold degrees in engineering or computer related fields.
Men comprise about 48% of the US-born observations in the weighted pooled sample, while the share is about 55% for immigrants. 52%, 57%, and 68% of naturalized citizens, permanent residents, and temporary workers of our sample are men, respectively. This noticeable difference between highly educated groups of natives and immigrants with respect to the share of genders might be a sign of the possibility that among such an elite group of people, migration is more likely to be done by men than by women.
In addition, table 2 provides information regarding a number of countries that send a considerable number of immigrants of different groups to the United States. Indian-born immigrants have the largest share in all of the weighted sub-samples of immigrants. Almost 50% of temporary workers in the weighted sample are from India.6According to USCIS, about 74% of the H-1Bs in 2017 were filed by citizens of India (U.S. Citizenship and Immigration Services, 2019). After India, a significant portion of immigrants in different categories are from China. The Philippines, Mexico, Canada, United Kingdom, and Iran are also sending a significant number of immigrants to the United States.
Table 3 reports and compares the composition of different immigrant groups (based on residency status) in each survey cycle and also in the pooled sample. As can be seen, the share of those on temporary work visas goes up from 7.9% in 2010 to about 12% in 2017. This supports the idea of gradual increase in the supply of such skilled individuals in the U.S. labor market from 2010 to 2017. Tables 4 and 5 give information on the fields of study and the highest level of education, respectively, among U.S.-born natives and temporary workers in each survey sample. As shown in table 4, going from 2010 to 2017, a considerably bigger percentage of work-visa immigrants hold degrees in computer, IT, and engineering disciplines, while for natives we do not notice a significant change. In addition, while table 5 reports a noticeable increase in the education level of immigrants who hold temporary work visas by going from 2010 to 2017, that is not the case for natives.
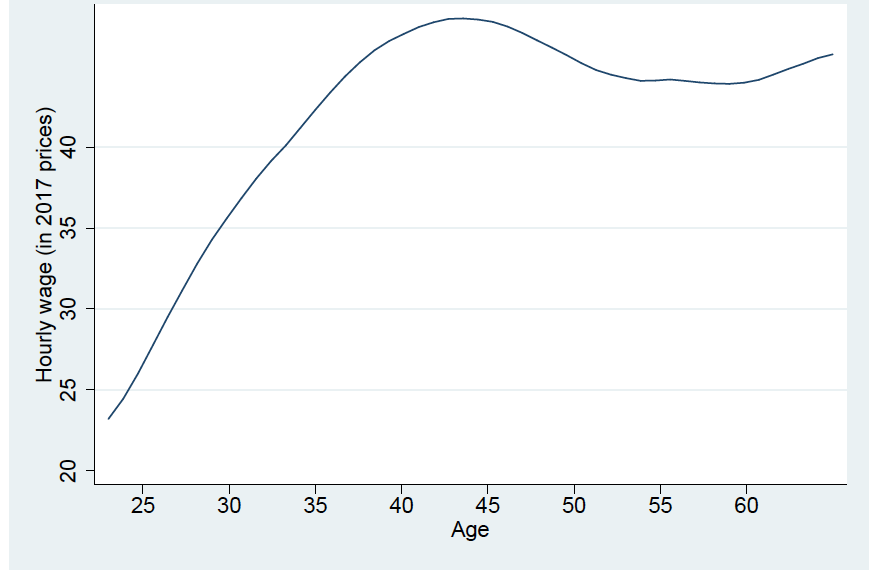
Finally, figures 2 and 3 show the age-earnings profiles of natives and immigrants, respectively. It can be seen that (weighted) hourly wages of natives go up more slowly, and have a lower maximum, but stay on top for a longer time, while (weighted) hourly wages of immigrants incline faster and reach a higher point, but then start falling.
Table 2. Weighted Descriptive Statistics by Residency Status
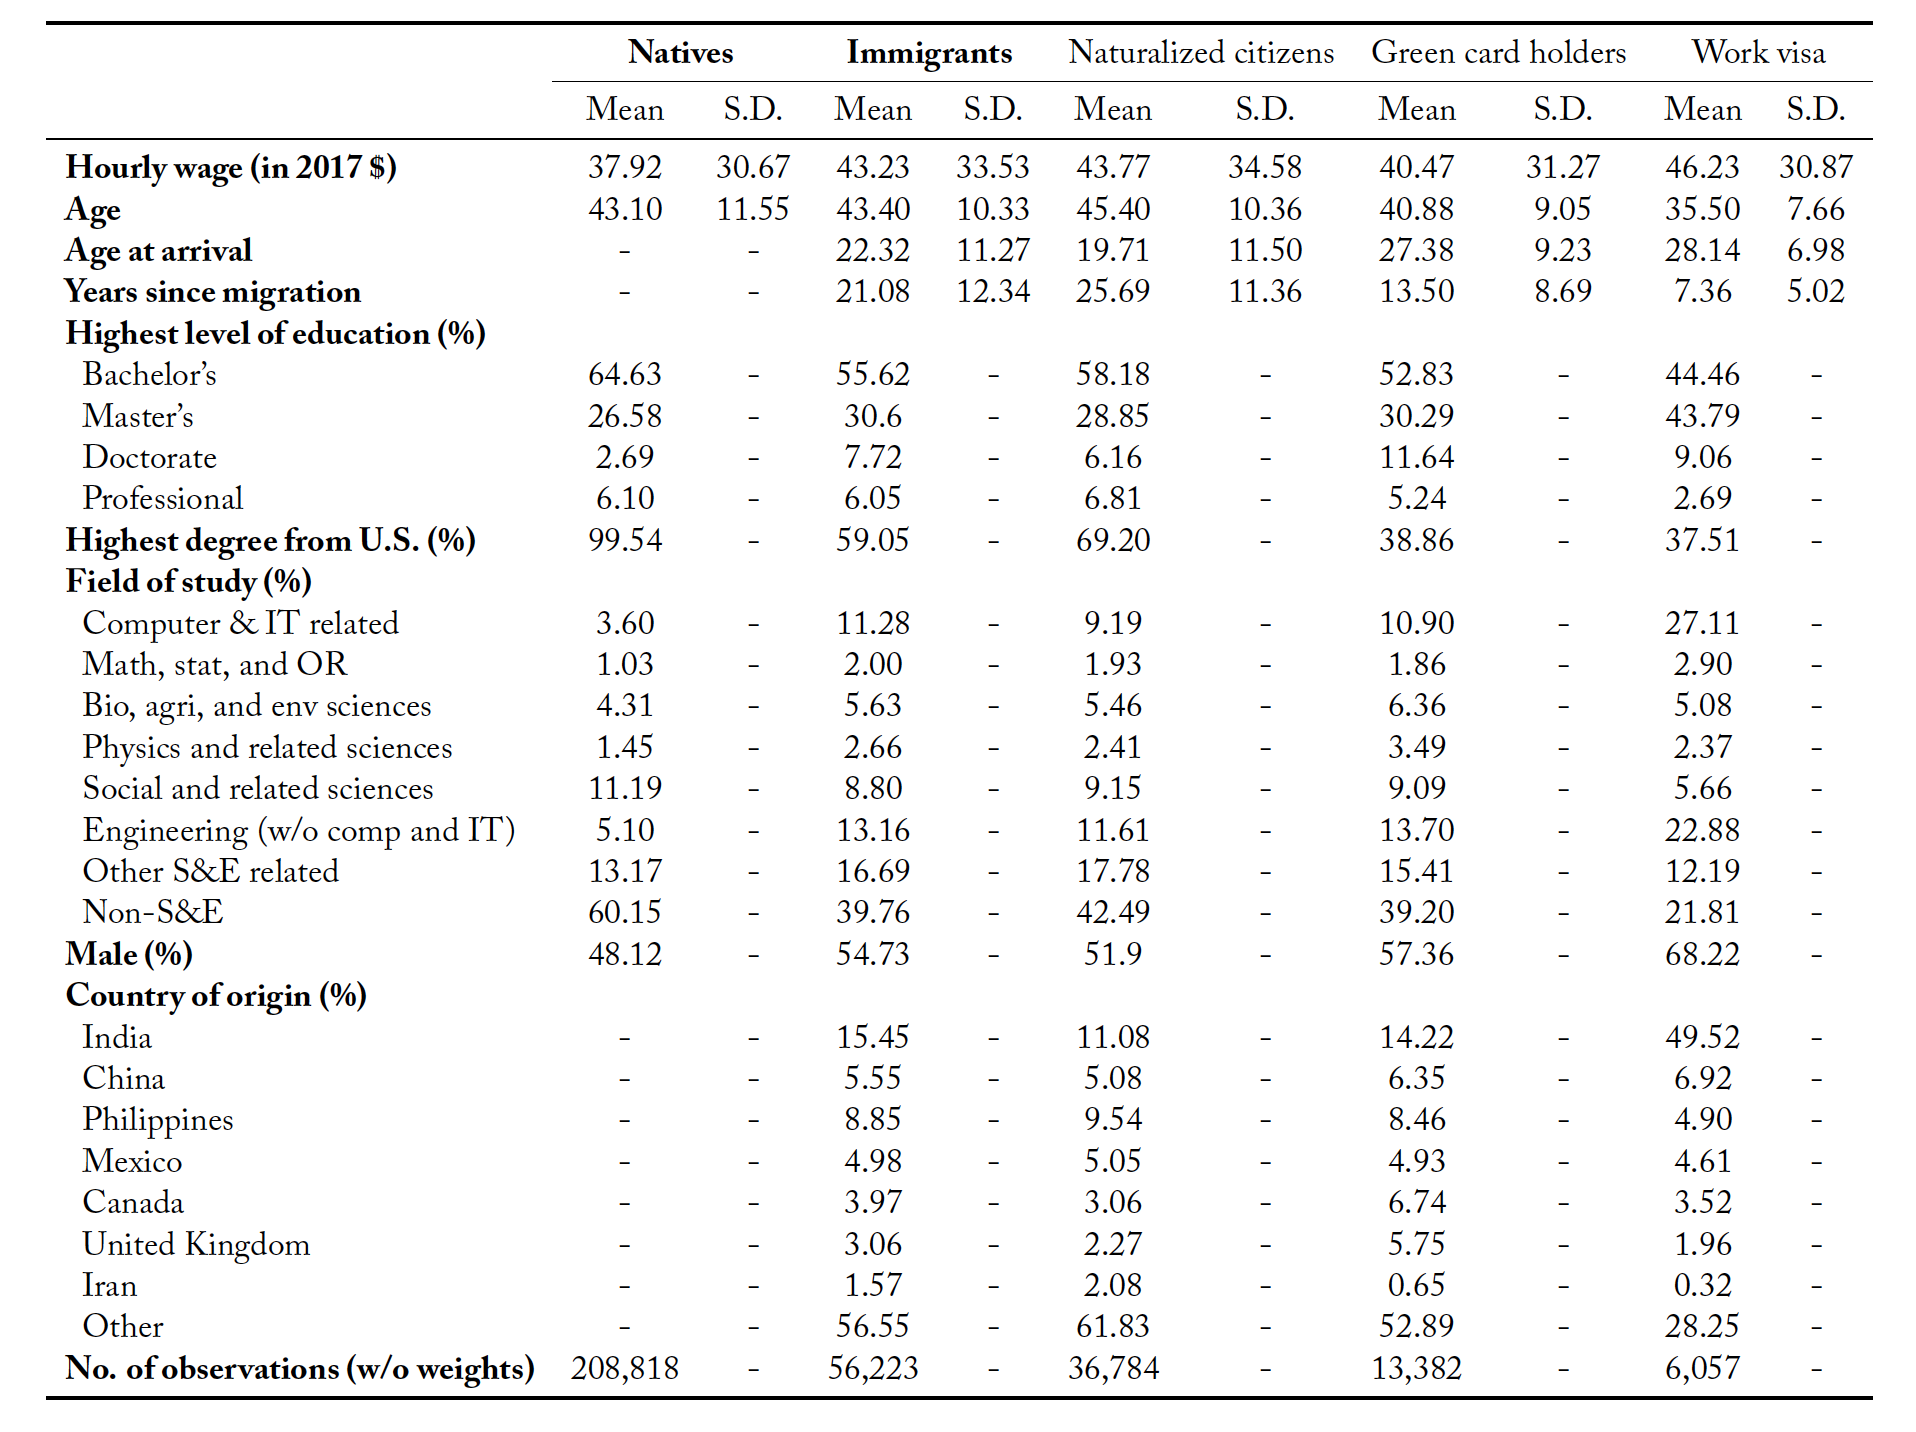
Table 3. Composition of Immigrant Observations (by Residency Status) in Different Survey Samples (Numbers Are in Percent)
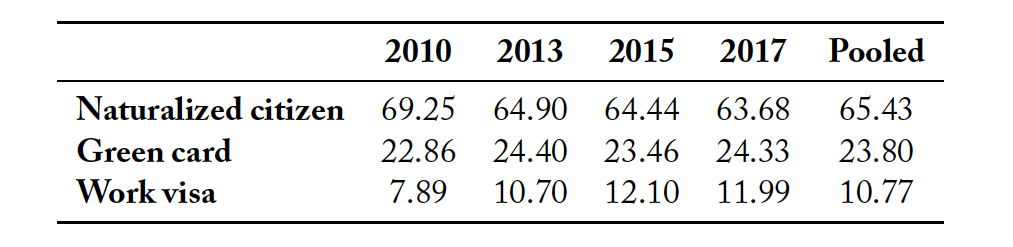
Table 4. Fields of Education of Natives & Immigrants on Temporary Work Visas in Different Survey Samples (Numbers Are in Percent)
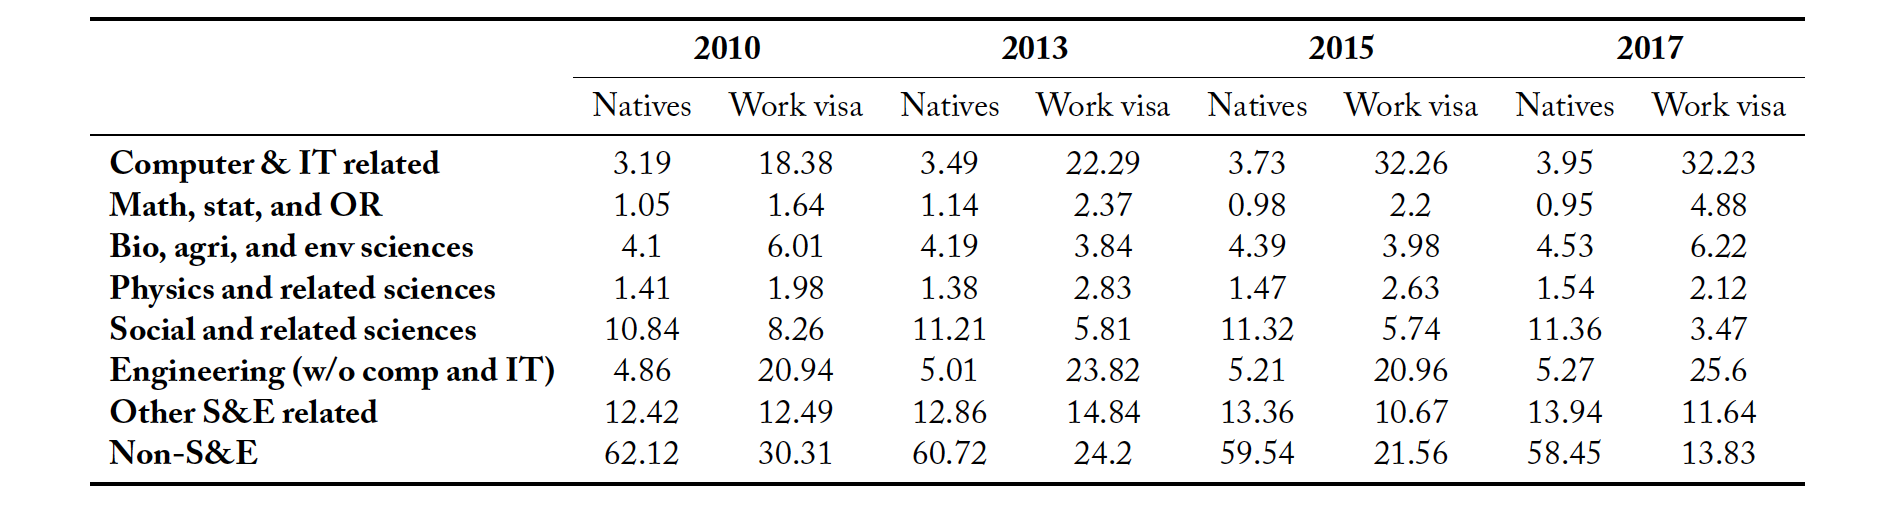
Table 5. Highest Degree of Natives & Immigrants on Temporary Work Visas in Different Survey Samples (Numbers Are in Percent)
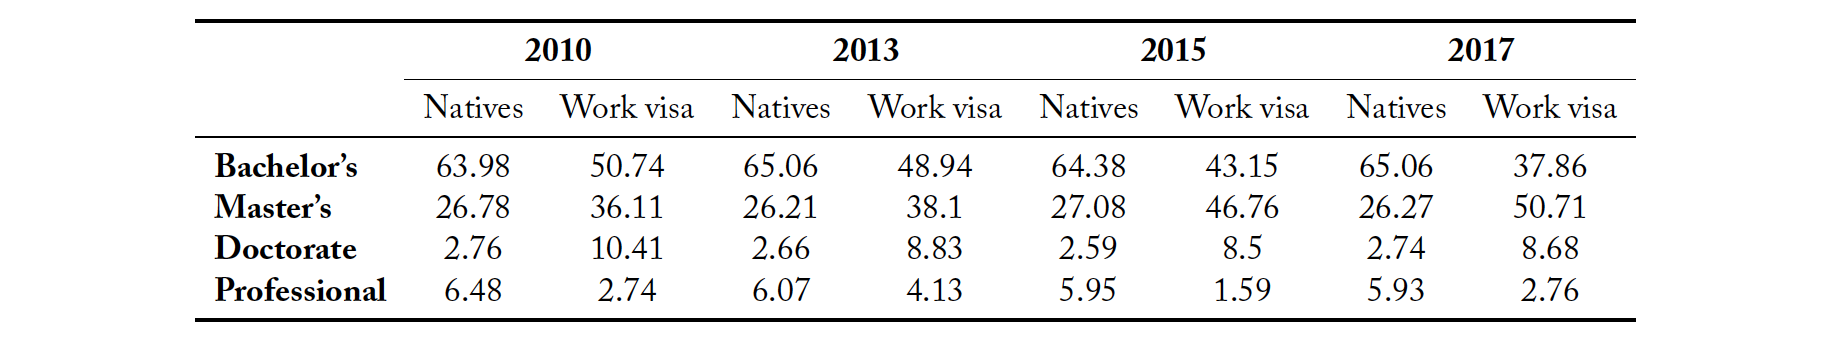
Figure 1. Kernel Density Distributions with Bandwidth of 0.7
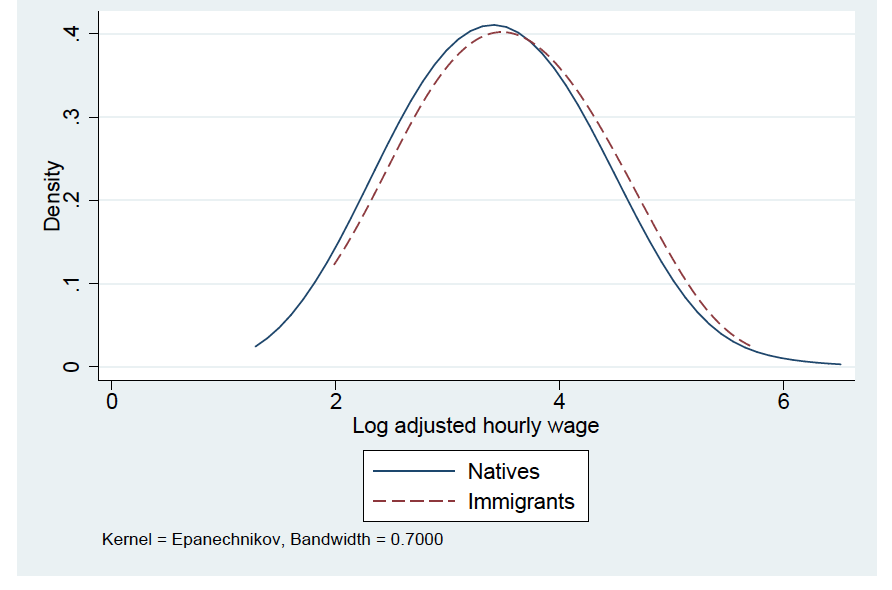
Figure 2. Age-earnings Profile of Natives
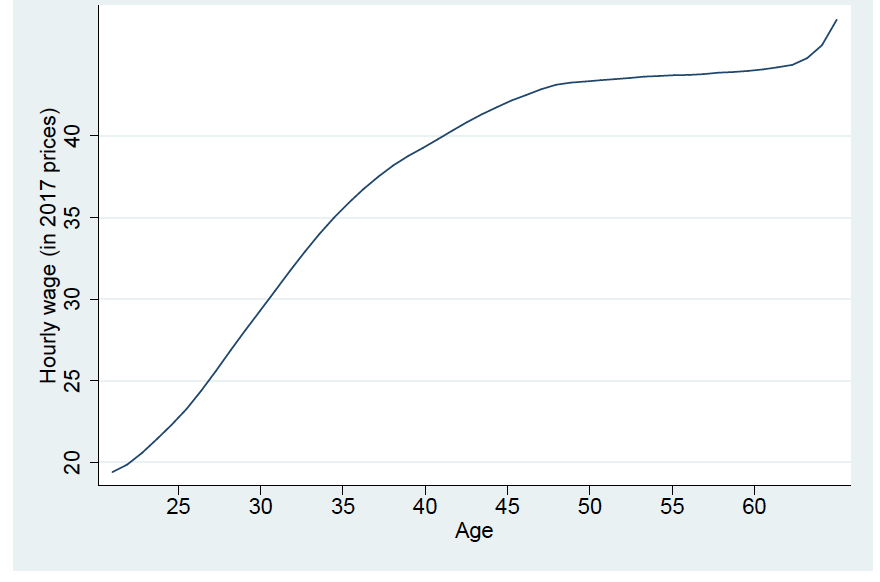
Figure 3. Age-earnings Profile of Immigrants
Methodology and Results
As described in the literature (e.g. Chiswick, 1978; Borjas, 1999), immigrants and natives have different human-capital earnings functions:
(1) 
(2) 
where w is wage (could be annual, monthly, weekly, or hourly), X is the vector of socio-economic and demographic characteristics (including education, gender, marital status, region of employment, etc.), A gives the age, and YSM counts the number of years that immigrant has resided in the host country.7Chiswick (1978) was the first to introduce the concept of “years since migration” for immigrants, and brought it into the Mincer (1974) wage equation with the explanation that the effect of years spent on education or on gaining experience in the home country of immigrants could be different from the effect of time spent in the destination country. Index n is used for natives and index i is used for immigrants. Since equation 2 controls for age and age-squared of immigrants, coefficients α4 and α5 measure the differential value that the host country’s labor market attaches to the time spent in the host country in contrast to the time spent in the home country (Borjas, 1999).
According to Borjas (1985), the arrival cohort should also be controlled for in equation 2 to capture the differences in the skills and characteristics of different cohorts of immigrants who entered the host country over different time periods. It should be noted though that in his study Borjas deals with immigrants at large, and his hypothesis for changes in the quality in different immigrant cohorts can make sense in that capacity. In this study, however, we are dealing with an elite group of highly educated and high-skill individuals with significantly less variations in the quality of entry cohorts.8In this study, in some models we control for the arrival cohort by dividing immigrants into 8 separate groups based on their arrival year: a. those who entered the U.S. before 1949; b. between 1950 and 1959; c. between 1960 and 1969; d. between 1970 and 1979; e. between 1980 and 1989; f. between 1990 and 1999; g. between 2000 and 2009; and h. those who arrived after year 2010. As expected, estimates for cohorts show no statistical significance. To check the robustness of our estimates of interest, the same models are run without controlling for cohorts and we find no significant changes to the results.
Multivariate Analysis: Using Pooled Data
The outcome of interest in this study is log of hourly wage.9Using the number of hours worked per week and number of weeks worked per year, the hourly wages are calculated from the reported annual salaries. In order to take advantage of all of the observations in 2010, 2013, 2015, and 2017 cycles, after applying all of the aforementioned cleaning to each cycle’s sample, we pool the observations of the four cycles together. Then, using the consumer price index (CPI) reported by the Bureau of Labor Statistics (BLS), we calculate hourly wages for 2010, 2013, and 2015 in 2017 prices.10According to the BLS, CPI in 2010, 2013, 2015, and 2017 was 218.1, 233.0, 237.0, and 245.1, respectively (Bureau of Labor Statistics, 2019). In addition, to control for and capture the differences in year-specific economic effects on earnings (like national and international macroeconomic shocks), we add time fixed effect to the following model with robust standard errors:
(3) 
where Xj includes the socio-economic and demographic attributes of the individual j in the sample such as their highest educational degree, whether the highest degree was earned in the United States, field of education for the highest degree, age, immigrant’s age at arrival to the U.S.11To break the potential collinearity between age, years since migration, and age at arrival, the latter is used in the model as a categorical variable taking values based on 10-year age groups., years since migration (takes zero for natives), arrival cohorts, gender, having child(ren), race, employment sector, self-employment status, firm size, physical disability indicator, etc. ft is the time fixed effect and δ is the error term.
I is a matrix containing dummies for all immigration and residency statuses (naturalized citizen, permanent resident (Green Card), and temporary work visa). Only one of these dummies will take 1 for each immigrant individual in the sample under study and they will all take zeros when it comes to a native. Therefore, the estimated coefficient on the indicator (dummy) variable of any above mentioned immigrant status (if significant) represents the log earnings difference between U.S.-born (native) workers and that group of immigrants.
Table 6 presents the results of running equation 3 on the pooled sample. The sample weight for each cycle is applied to the model for higher accuracy. Column 1 of the table reports the results when regressing log of hourly wage only on I. The estimated coefficient of holding a work visa shows that, unconditionally, individuals on temporary work visas earn 25.5 log points (25.5%) more than natives.
In the second regression, field of the highest degree is controlled for in 8 major groups: “Computer and IT related fields including computer engineering and IT engineering,” “Mathematics, statistics and operations research,” “Biology, agricultural and environmental sciences,” “Physics and related sciences,” “Social and related sciences,” “Engineering excluding computer and IT engineering.” “other science and engineering related fields,” and finally “non-science and engineering related fields.” The latter group is kept out as the base group. As shown in the table, only controlling for field of education is sufficient to reduce the premium to 12.6%. This drop makes sense because as shown in table 3, the majority of immigrants, especially those with work visas, have their highest degrees in computer related, engineering, or other S&E related fields which on average have higher wages, while most of natives have degrees in non-S&E disciplines.
In the third regression, the highest level of education (bachelor’s, master’s, doctorate, or professional) along with whether the highest degree is earned inside the United States are also controlled for (bachelor’s degree is chosen as the base group). The coefficient on the work visa dummy in such a case represents the difference between the average native and the average immigrant with a work visa who obtained a U.S. degree the same as that of a native in level and field. Such an immigrant has about 13% premium compared to the native. Recall that immigrants, especially temporary workers, on average, have higher levels of education compared to natives.
In the fourth regression (reported in column 4), we control for cubic in age (immigrants on work visas are on average 7.6 years younger than natives). The estimated coefficient on the work visa dummy now represents the difference between natives and work visa holders with the same ages who both received their highest degrees in the U.S. in a similar level and field. As mentioned in the table, after controlling for age along with all of the previous variables, an immigrant with a temporary work visa on average makes 25.7% more than a native with similar human capital.
In the fifth regression, we control for the age group at the time of arrival in the United States (10, 20, 30, 40, 50, and 50+), and also for potential U.S. and foreign experience.12A technique similar to what used in Hunt (2011) is engaged to calculate any potential U.S. or non-U.S. experience. Potential U.S. experience is calculated as years since earning the highest degree if the degree was gotten in the United States or by a native, or as years since migration if the highest degree was obtained abroad by an immigrant. Potential foreign experience is defined as the difference between the year of arrival in the U.S. and the year of getting the highest degree for immigrants who received their highest degrees abroad and zero for others. Since these variables are correlated to each other, controlling for one without the others could give misleading results. The estimated coefficient on the work visa dummy now represents the difference between natives and work visa holders who arrived in the United States after birth, received their highest degree in the U.S. in similar levels and fields to that of natives, and only have U.S. experience. Like having U.S. education, having U.S. work experience might cause a premium. Also, arriving to the U.S. at a younger age might have a positive effect on wage. As reported in the fifth column of the table, after controlling for all of the variables above, an immigrant with a temporary work visa on average earns 31.9% more than natives.
In the sixth run, a cubic in number of years since migration to the U.S. is also controlled for along with gender, having child(ren), the cohort (decade), whether the person is born in an English speaking country,13Native English speakers might have better chances in the U.S. labor market. Countries are Antigua-Barbuda, Australia,
Bahamas, Barbados, Bermuda, Canada, Dominica, Grenada, Guyana, Ireland, Jamaica, Liberia, New Zealand, Northern Ireland, South Africa, St. Vincent, Trinidad and Tobago, and the United Kingdom (Borjas, 2015).
and whether the immigrant is a citizen of India, China, Philippines, Canada, U.K., Mexico, or Iran.14These are some of the countries that have been sending a significant number of immigrants to the United States. Results show that men’s earnings are on average 14% more than women.15This difference could be due to several reasons such as discrimination, differences in motivation and interests, or differences in abilities. However, these are all questions for future research. After controlling for all of these parameters, column 6 shows a 34.9 log point difference between temporary workers and natives. Results of this regression also show an about 26% wage premium for immigrants (of any status) who are born in the United Kingdom, 15% for Indians, 12% for Canadians, and 10% for Chinese, compared to other nationalities. Other than being a native English speaker, one of the reasons that people born in the U.K. have such a considerable premium over other nationals could be the similarities between the labor markets of the United Kingdom and the United States.
As expected, the estimates for almost all of the cohort dummies are statistically insignificant. As discussed before, the NSCG data is a sample from an elite population that is highly skilled and highly educated. Consequently, we can presume that different cohorts of immigrants in this data have similar packages of human capital (quality) when they arrive to the United States. This may explain why we do not find any cohort effect.
In the seventh regression, we add controls for different races and also for any physical disability. Races are categorized into seven different groups: Asian, American Indian/Alaska native, Black, Hispanic, White, Pacific Islander, and multiple races. Asians are kept out as the base group. American Indian/Alaska native, Black, Hispanic, and White races show a negative premium in wages in the results compared to Asians.16Asians’ premiums over American Indian/Alaska native, Black, Hispanic, and White races are 21%, 14%, 12%, and 5%, respectively. After controlling for race and disability plus previously mentioned factors, as reported in column 7, natives are making 35% less than immigrants working in the U.S. with a temporary work visa.
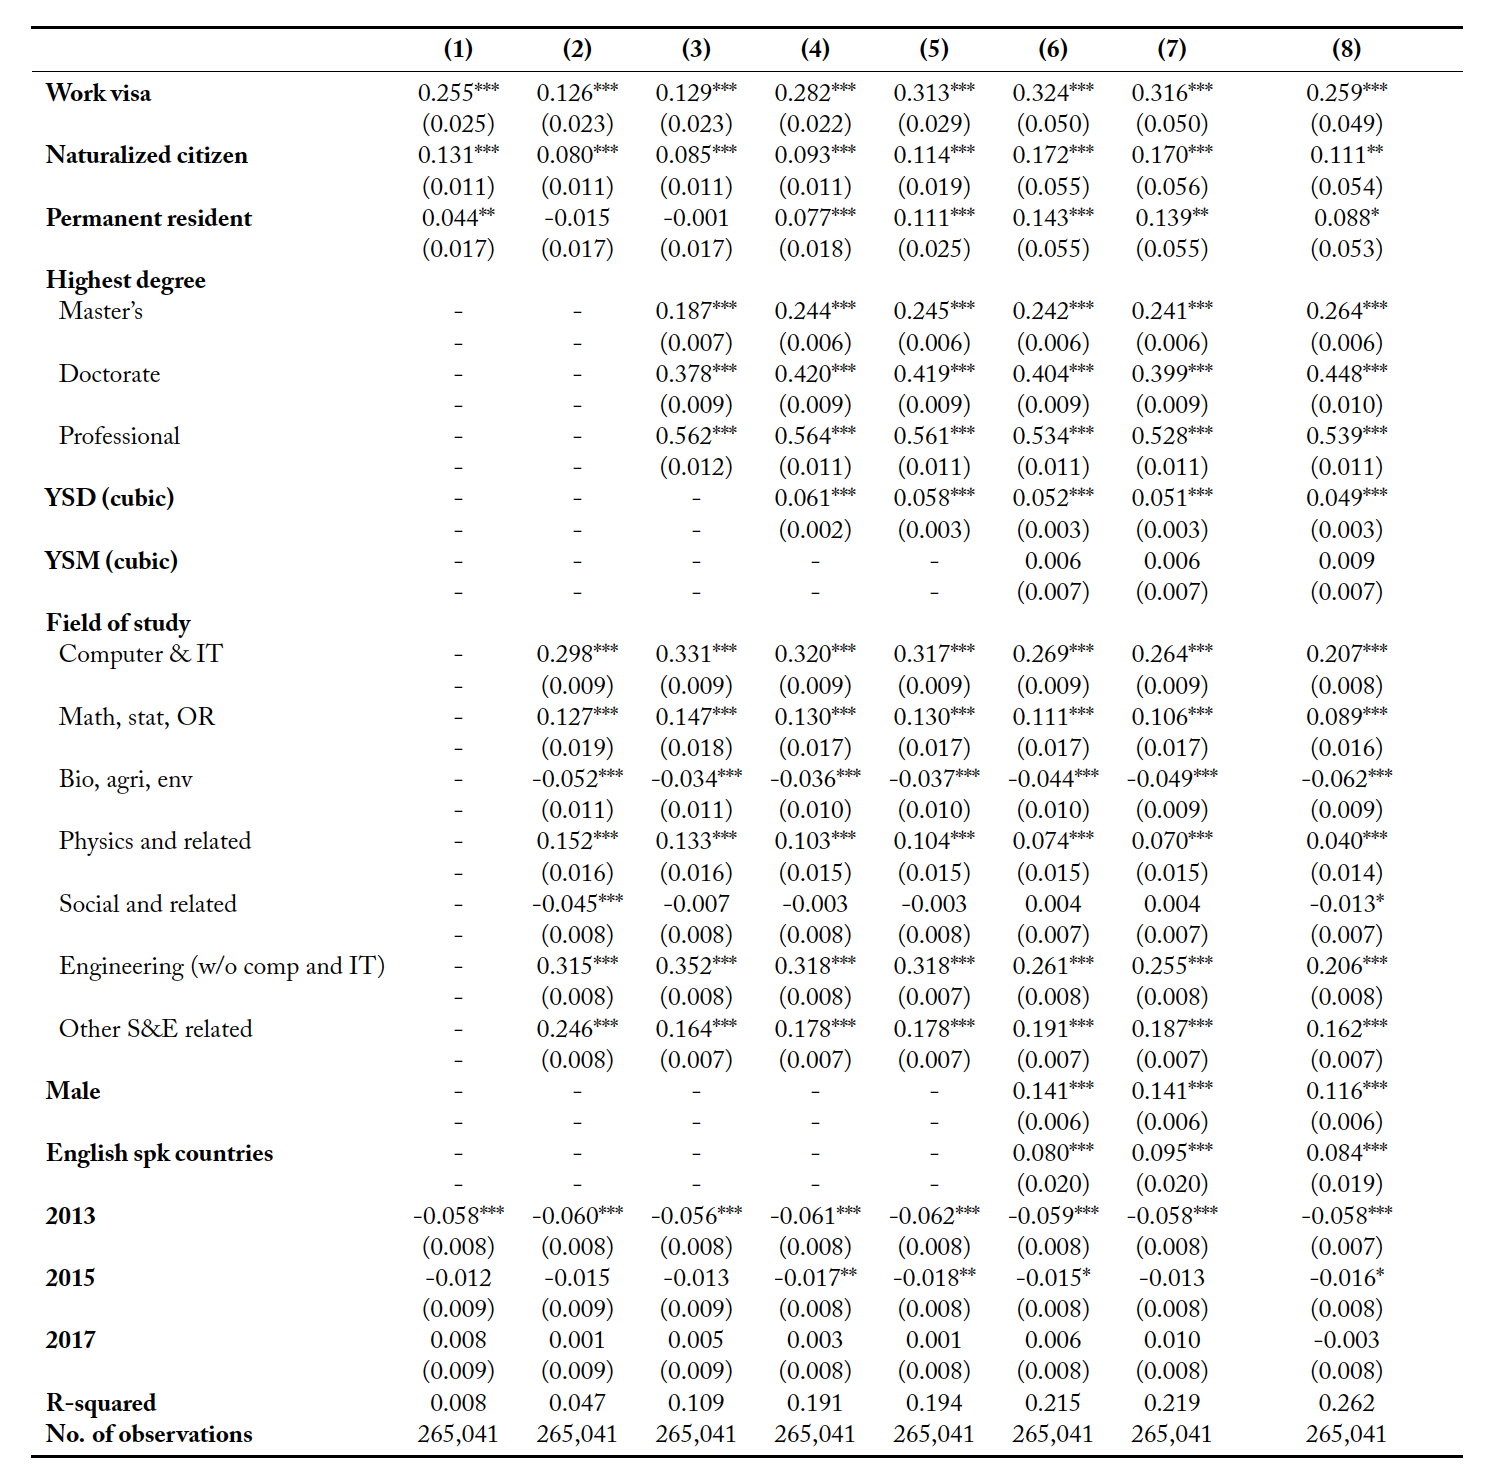
Finally, in the last regression we control for employer sector, size, and region17United States is categorized into 9 different regions in the NSCG data: New England, Middle Atlantic, East north central, West north central, South Atlantic, East south central, West south central, Mountain, and Pacific. The first region is chosen as the base, and most of the regions above show a negative wage premium compared to the New England region. As discussed in Hunt (2011), immigrants mostly live disproportionately in high-wage regions. So, region controls are appropriate if they pick up differences in price levels but inappropriate if they pick up genuine regional productivity differences of college graduates. College graduates in California, for instance, might be more productive than college graduates elsewhere. along with whether an individual is self-employed. Results show that except for the Pacific region (which includes California) and the Middle Atlantic (which includes the State of New York) which have a 6% and 2% premium compared to the New England region, respectively, people who work in other regions, on average, have lower salaries. Sectors are divided into 3 major groups: Educational, Governmental, and Business/Industry. We choose the first category as the base group and the second two sectors show 10 and 19 percent wage premiums compared to the educational sector, respectively. Employer size is determined by number of employees.18The NSCG has grouped employers into 8 groups: “with 10 or fewer employees,” “with 11–24 employees,” “with 25–99 employees,” “with 100–499 employees” “with 500–999 employees,” “with 1000–4999 employees,” “with 5000–24999 employees,” and “with 25000+ employees.” We take the smallest size as the base and the results strongly show that the bigger the firms are in number of employees, the bigger the wage premium of their employees will be. Results show that the employees of the last group on average get 31% more than those of the smallest size. One plausible reason for this could be that larger companies are generally successful and efficient businesses that can benefit from economies of scale and economies of scope and also offer high salaries to be able to attract more skilled, more educated, and more experienced individuals. As shown in column 8, after controlling for all socio-economic and demographic characteristics available in the data, individuals on a work visa are still getting 29.5% more than natives.19With the intention of testing the robustness of our findings, we make two small modifications to the model specifications. We first replace the age variable in our models with years since obtaining the highest degree as a proxy for work experience to see how such a change alters our point estimates for the work visa dummy. Table 1 in the online appendix demonstrates these results. As the second modification, we use the same eight model specifications (controlling for age), but we run them only on those observations of the pooled sample who hold full-time jobs. Table 2 of the appendix reports these results. As can be seen in both tables, although the estimated premiums under these new specifications might be 2–3% larger or smaller than what is reported in table 6, the differences are not very considerable, and the significant premiums hold.
One reason for such a significant premium for temporary workers could be the existence of strong “selectivity” among immigrants. Those who hold U.S. work visas should be individuals who earned the work visa in a tough competition due to their above average abilities and high motivations. Unfortunately, there is no information available in the NSCG data which can help us control for ability and motivation of individuals. So they are considered unobservables in our study.
Table 6 shows robust results for different highest degrees and different fields of study. As shown in the table, people with master’s degrees on average get about 15–23% more hourly wages compared to those who hold bachelor’s degree; those holding doctorate degrees get about 30–40% more, and holders of professional degrees have about 52–56% wage premium compared to those with bachelor’s degrees. In addition, individuals with certain fields of education have a wage premium compared to other majors. For instance, “Computer and IT related” or “Engineering” fields on average earn 20–30% more than other fields.
In addition, 2010 being the base year, in all of the eight regressions, the year fixed effect for 2013 shows on average about 5–6% less income in 2013 for college graduate individuals. 2015 and 2017, however, do not show any significant difference.
In order to know the native-temporary worker wage gaps for different disciplines and occupations and be able to compare them, we stratify the pooled data sample by fields of study and occupations and run regression 8 on every sub-sample. Table 7 reports the results for various fields of education. As can be seen, our results show that among people with an education in engineering fields, temporary workers have a premium of 20.5% over natives counterparts. This premium jumps to about 44% when we run the model on college educated individuals with an education in social sciences. No significant wage difference between work visa holders and natives is found for other education disciplines.
Table 6. Pooled OLS Regressions Results (All Four Cycles)

*** p<0.01, ** p<0.05, * p<0.1; Numbers in parentheses are robust standard errors; coefficients are estimated using OLS weighted by survey weights; log of hourly wages adjusted to 2017 dollars is the dependent variable. U.S. natives are the base group; other independent variables that exist in regressions but are not reported are as follows: U.S./non-U.S. degree (present in regressions 3 to 8) age2 and age3 (reg. 4 to 8), potential U.S. and non-U.S. work experience and age-at-arrival (reg. 5 to 8), YSM2 and YSM3, the arrival cohort (decade), child(ren), and country of origin (India, China, Philippines, Canada, U.K., Mexico, and Iran) (reg. 6 to 8), race, and physical disability (regressions 7 and 8), employer sector, employer size, employer region, and self-employed (present only in the 8th regression).
Table 7. OLS Regressions Results (Pooled)— Stratified by Field of Education
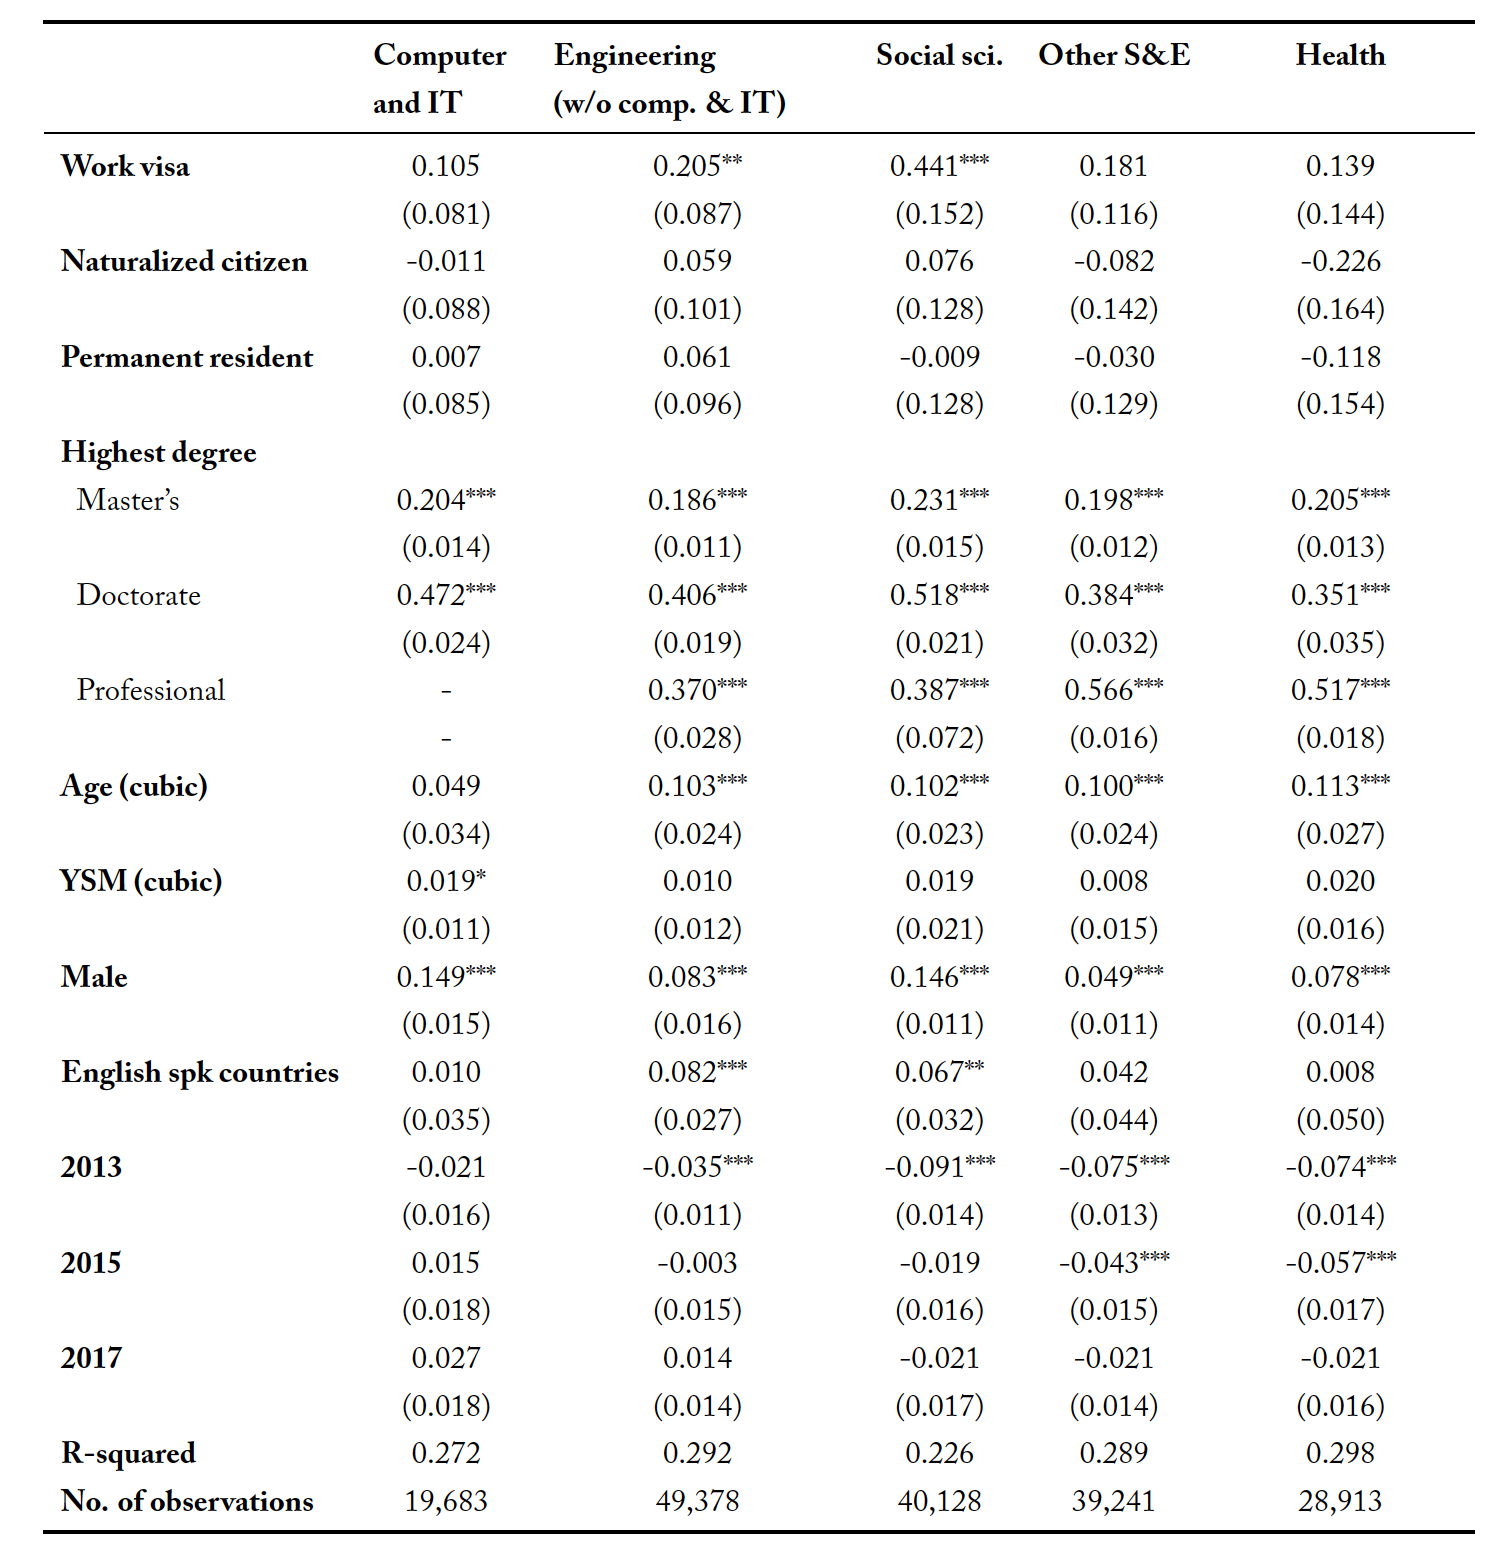
*** p<0.01, ** p<0.05, * p<0.1; Numbers in parentheses are robust standard errors; coefficients are estimated using OLS weighted by survey weights; log of hourly wages adjusted to 2017 dollars is the dependent variable. U.S. natives are the base group; other independent variables that exist in regressions but are not reported are as follows: U.S./non-U.S. degree, age2, age3, age-at-arrival, potential U.S. and non-U.S. work experience, YSM2, YSM3, the arrival cohort (decade), child(ren), country of origin (India, China, Philippines, Canada, U.K., Mexico, and Iran), race, physical disability, employer sector, employer size, employer region, and self-employed.
Table 8. OLS Regressions Results (Pooled)—Stratified by Occupation
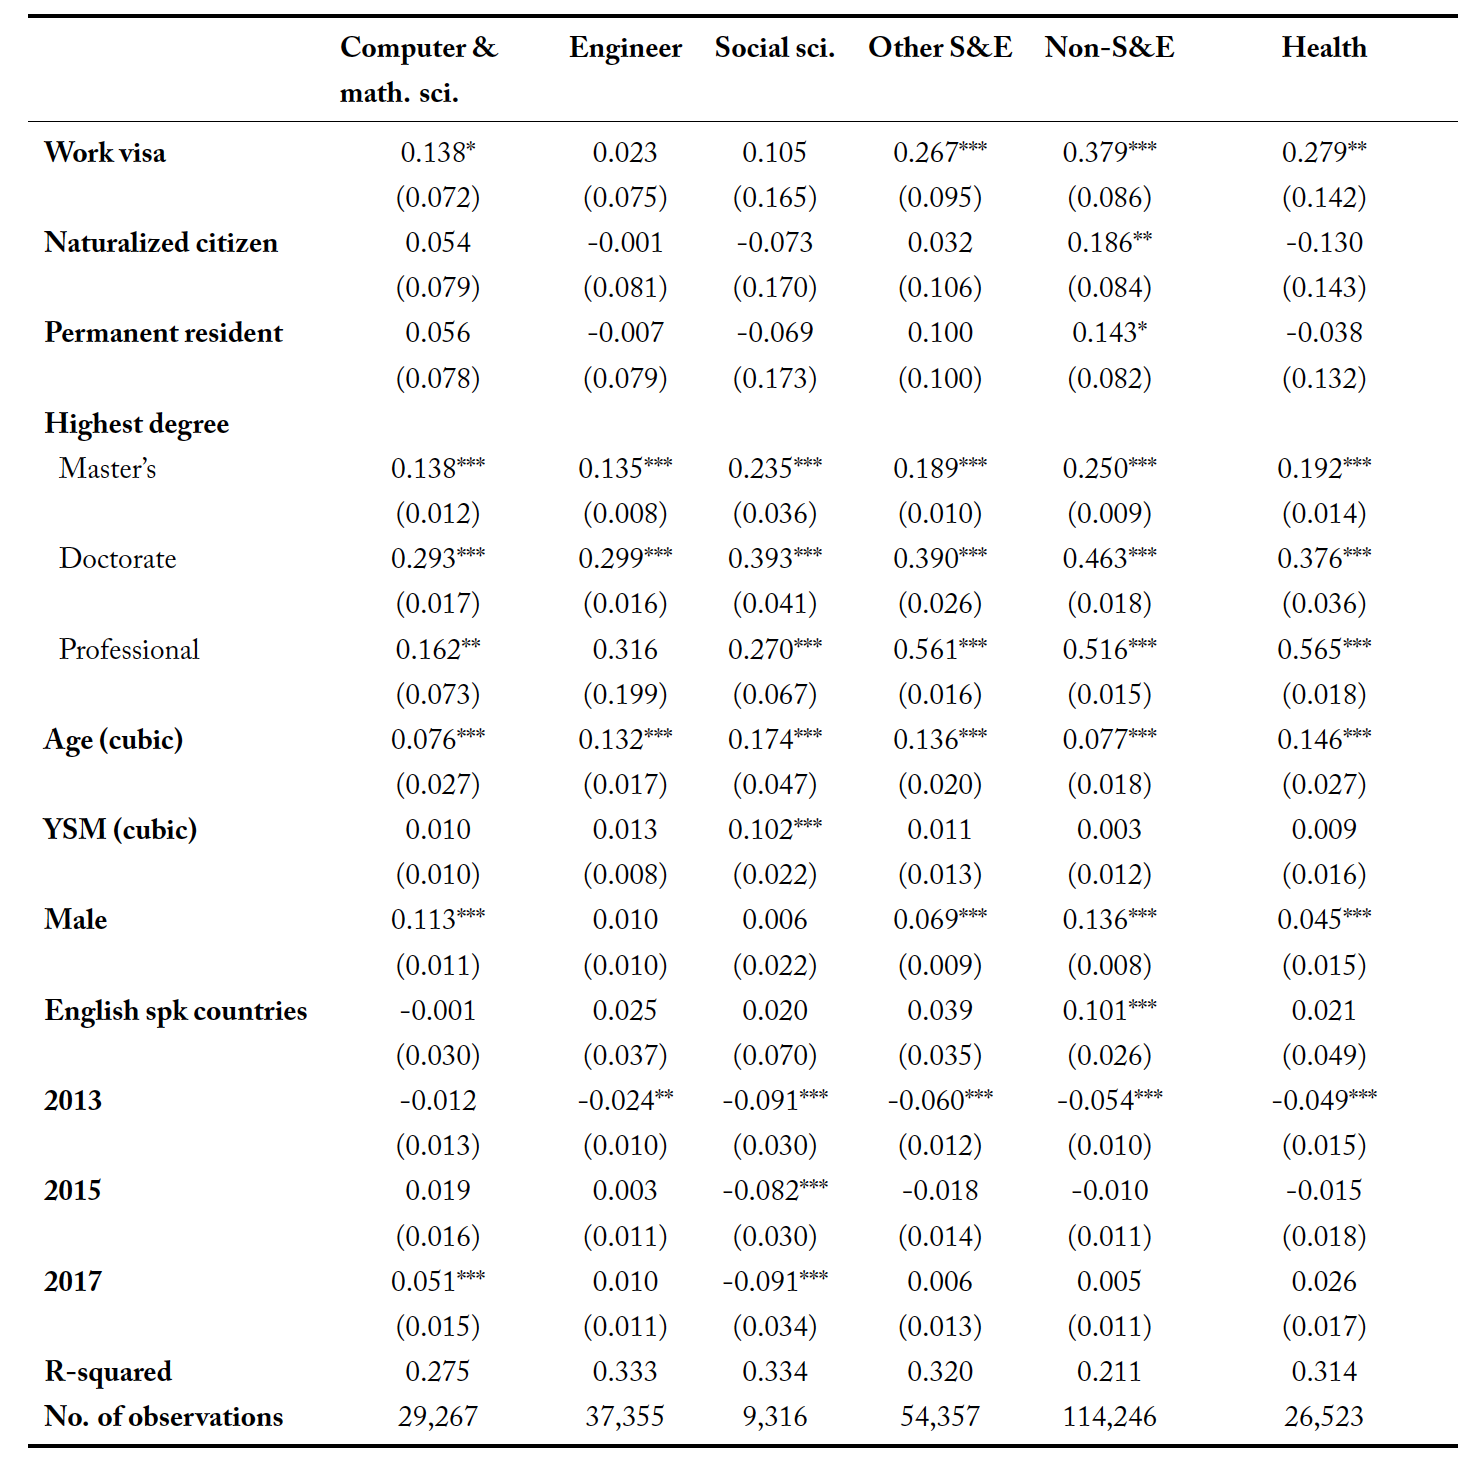
*** p<0.01, ** p<0.05, * p<0.1; Numbers in parentheses are robust standard errors; coefficients are estimated using OLS weighted by survey weights; log of hourly wages adjusted to 2017 dollars is the dependent variable. U.S. natives are the base group; other independent variables that exist in regressions but are not reported are as follows: U.S./non-U.S. degree, age2, age3, age-at-arrival, potential U.S. and non-U.S. work experience, YSM2, YSM3, the arrival cohort (decade), child(ren), country of origin (India, China, Philippines, Canada, U.K., Mexico, and Iran), race, physical disability, employer sector, employer size, employer region, and self-employed.
Table 8 shows our findings for various categories of occupations. It can be seen that for jobs and positions in computer and mathematical sciences temporary work visa holders on average make about 14% more than their U.S.-born counterparts. The results show no statistically significant wage differences for engineering and social science related jobs. However, we find that for other science and engineering related,
non-science and engineering, and health related jobs, temporary workers have premiums of about 27%, 38%, and 28%. One of the explanations for different results presented in tables 7 and 8 could be that many individuals might not work in the field of their education. In the NSCG data, almost 19% of people claim that their jobs are not related to their education, and only 55% of them claim that they are related.
As mentioned earlier, selective attrition could be an issue in our analysis. Such selectivity problem can even be more severe for longer years since migration, younger ages, and/or different residency statuses. Our models can also suffer from other endogeneity issues. For instance, immigrants’ entry to the U.S. by itself may increase or decrease natives’ wages and affect the gap, or field of education and/or education level might be determined by native/immigrant status. All of these factors can potentially cause endogeneity bias in our results. Therefore, what we are presenting as our results may be over-estimating (or under-estimating) the real immigrant-native wage gap.
Including Interaction Terms
As pointed out earlier, one of the important goals of this study is to see if the native-temporary worker wage gap that we found earlier is any different for people belonging to specific groups. In order to find the answer to this question, we employ some interaction terms in the least squares model (the eighth regression, which includes all of the control variables) and run it again. In order to take advantage of all of the four cycles, we run the model on the pooled data. The terms that we will be adding to the model are the interaction of the work visa dummy with the male dummy, dummies for some countries of origin (those mentioned above with big shares of immigrants in the U.S.), and the native English speaker dummy. We want to know if the work visa premium is different for men compared to women, for native English speaking immigrants, and/or for people originally from specific countries. Table 9 reports the results of running the model that includes interaction terms on the pooled data. Our estimates for the non-interactive covariates show robustness to adding interaction terms and do not show significant changes (compared to what reported in table 8). Therefore, only the estimates for interaction terms are reported in table 9.
Column 1 of table 9 shows the results when only the male and work visa interaction is added to the model. Column 2 reports the results when only the interaction of native English speaker and work visa is added. In the third regression, which is reported in column 3, we only control for the interactions of some countries of origin (India, China, Philippines, Mexico, Canada, UK, and Iran) and work visa. Columns 4 and 5 report the results of the regression 8 when the first two interaction terms and the last two interaction terms are simultaneously included, respectively. Finally, the last regression (results reported in column 6) includes all of the three types of interactions.
Table 9. Results of the Pooled OLS Regression with Interactions
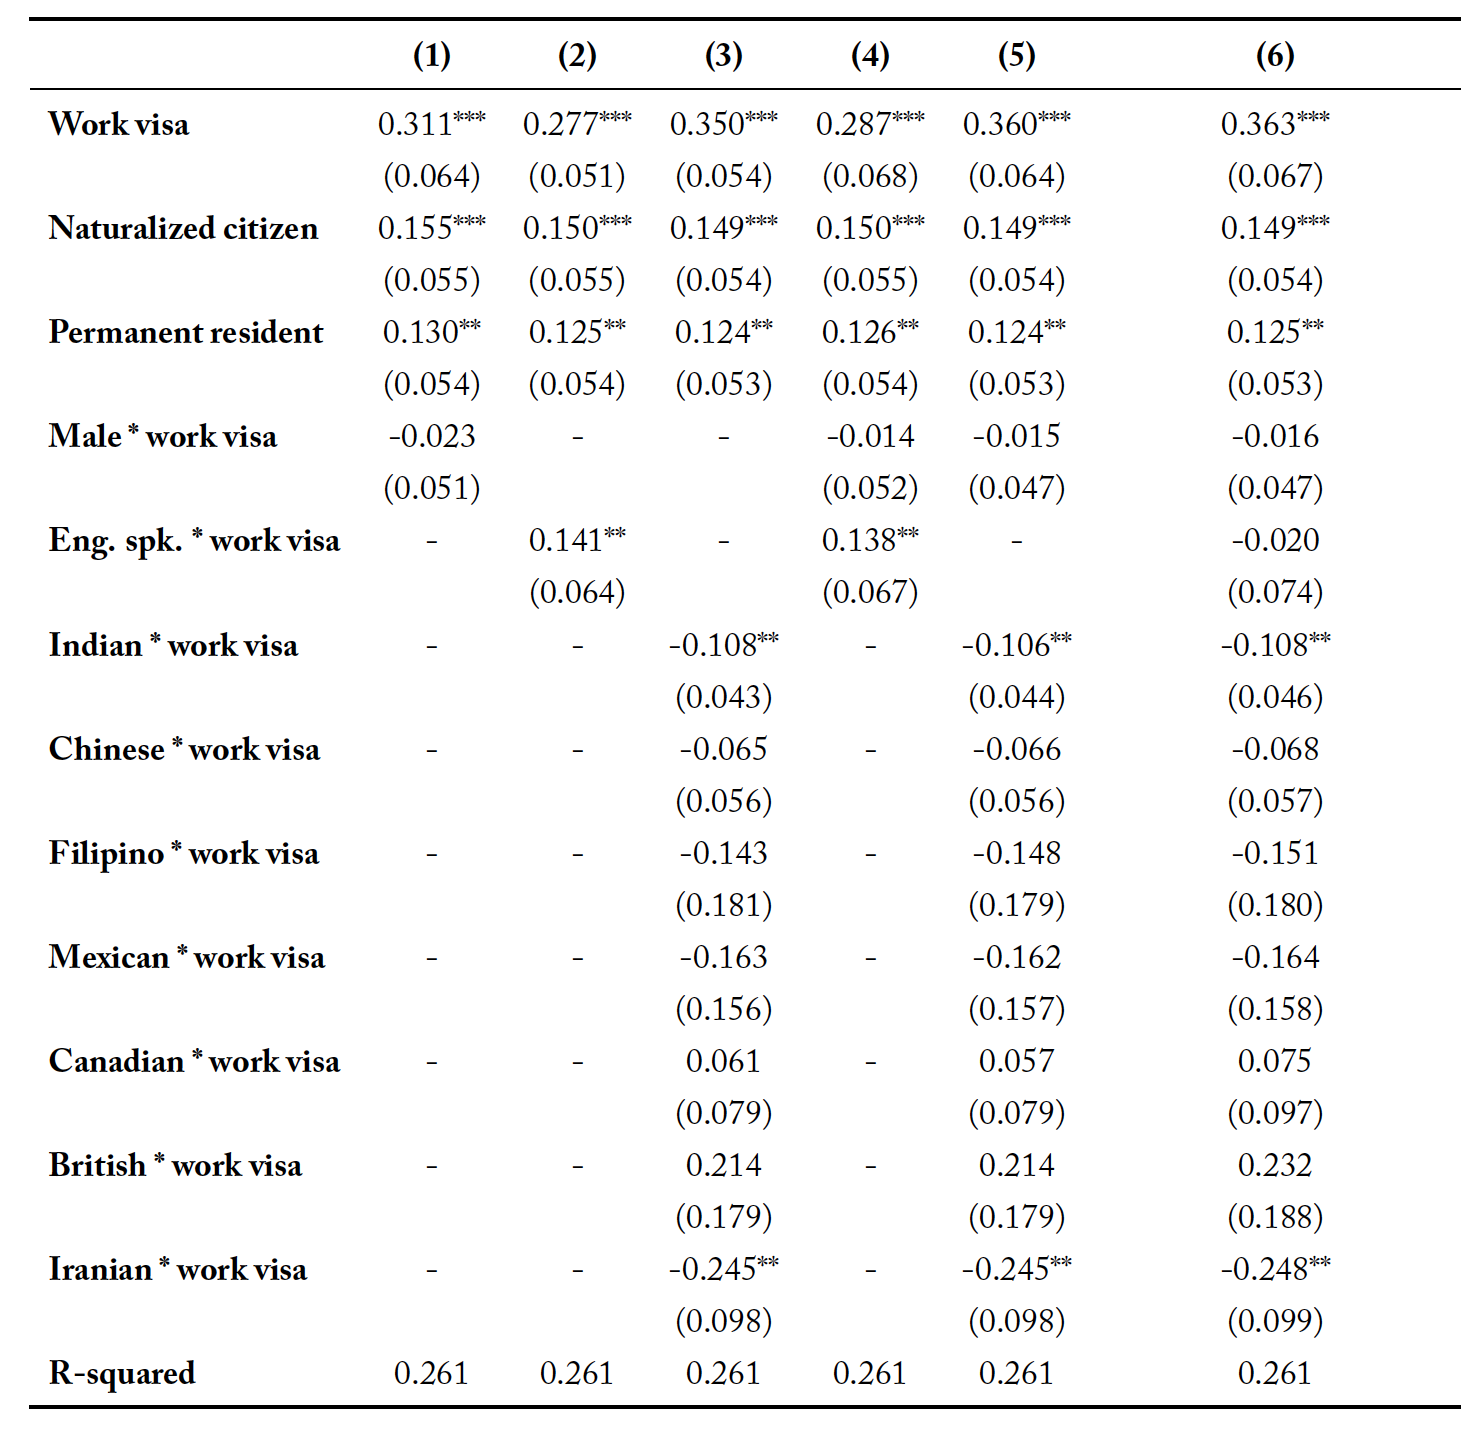
*** p<0.01, ** p<0.05, * p<0.1; Numbers in parentheses are robust standard errors; coefficients are estimated using OLS weighted by survey weights; log hourly wage is the dependent variable. U.S. natives are the base group; other independent variables that exist in regressions but are not reported are as follows: highest degree, U.S./non-U.S. degree, field of study, cubic of age, cubic of years since migration, ageat- arrival, potential U.S. and non-U.S. experience, the arrival cohort (decade), male, child(ren), native English speaker, country of origin (India, China, Philippines, Canada, U.K., Mexico, and Iran), race, physical disability, employer sector, employer size, employer region, and self-employed.
As reported in table 9, there is no evidence that shows immigrant men on work visas have a wage premium over their native male counterparts which is any different compared to that of female temporary workers over their native female counterparts. Based on our results, individuals on work visas who are native English speakers have about 14% higher premiums compared to temporary workers with non-English mother tongues.20This is similar to the results that other studies have found (e.g. Miranda and Zhu, 2013; Borjas, 2015; Rivera-Batiz, 1990). In addition, as shown in the table, Indians who hold work visas such as an H-1B have on average about 11% less income compared to other nationals with work permits. This gets even worse for Iranians, who earn about 25% less than temporary workers from other countries. It is hard to say for sure why the citizens of these countries earn significantly less than their counterparts with other origins. Many reasons could cause such an issue. For instance, the large number of Indians who are working on H-1B visas in the U.S. labor market could be a reason for the case of Indians, or issues between the governments of Iran and the United States might be a reason for the case of Iranians. Also, systemic discrimination can always be a factor in such cases. However, one cannot know the true reason unless more information is available.
Multivariate Analysis: Using Survey Cycles Separately
In order to find the change in the native-temporary worker wage gap from 2010 to 2017, in this part of the study we compare the results from running our models on each survey sample, separately. The following least squares model is used with robust standard errors (all variables used in this model are the same as what is explained for equation 3):
(4) 
Table 10 reports the results of running our first (with no control) and last (with full control) model specifications on the 2010, 2013, 2015, and 2017 samples, respectively. The same cleaning process explained earlier is applied to all samples; survey weights are employed for more accuracy. As can be seen in this table, although the unconditional wage difference between natives and temporary workers shows a positive trend, increasing from 15.6% in 2010 to 31.9% in 2017, the wage premium follows an opposite trend when all factors are controlled for. As reported in columns 2, 4, 6, and 8 of table 10, the wage premium that work-visa immigrants have compared to natives declines continuously: 63.5% in 2010; 40.3% in 2013; 35.3% in 2015; and 17.4% in 2017. In other words, although the gap between the nominal wages of college graduate immigrants on temporary work visas and their native counterparts in the U.S. labor market might have shown a continuous increase, after controlling for socioeconomic and demographic factors, we find that since 2010 such a wage premium has been shrinking at a high rate.
After the Great Recession, which hit the U.S. economy hard, 2010 was the beginning of a new growth era for the whole economy and also for many technology companies and start-ups. As a result, there could have been a huge demand for highly educated skilled professionals in most fields, especially in science and engineering. If the supply of such high-skill workers in the United States were not enough for the existing demand,21Recall that based on our data the majority of U.S.-born natives are neither interested in post-graduate education, nor in STEM fields (see tables 2, 4, and 5). companies would need to pay higher salaries to bring the professionals they need on work visas from other countries such as India and China. However, with a 65,000 cap on the number of H-1B visas per year, the shortage could persist for a while.
Table 10. OLS Regressions Results (2010–2017 Cycles)
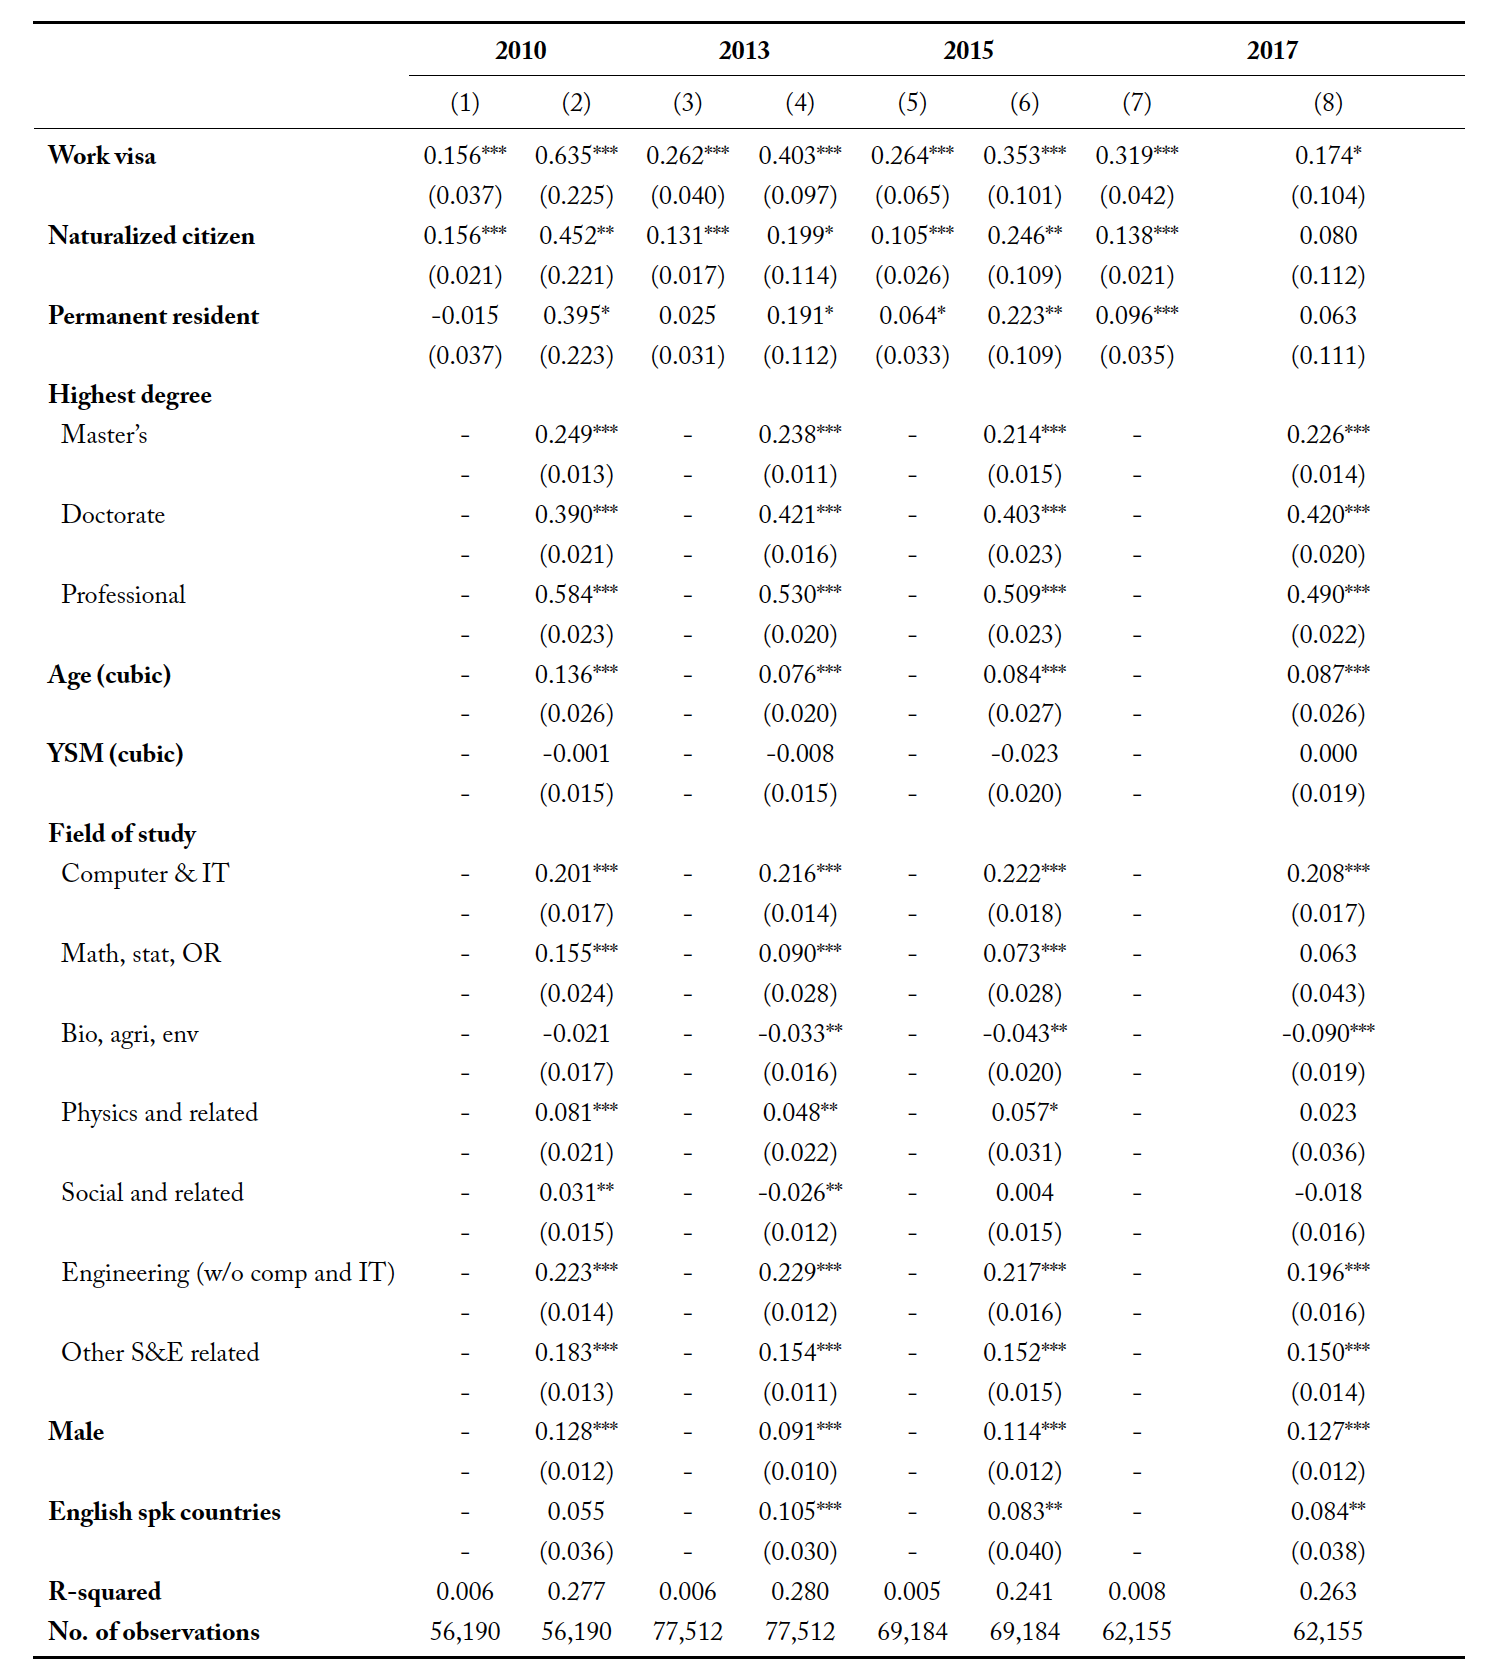
*** p<0.01, ** p<0.05, * p<0.1; Numbers in parentheses are robust standard errors; coefficients are estimated using OLS weighted by survey weights; log hourly wage is the dependent variable. U.S. natives are the base group; other independent variables that exist in regressions (2), (4), (6), and (8) but are not reported are as follows: U.S./non-U.S. degree, age2, age3, age-at-arrival, YSM2, YSM3, potential U.S. and non-U.S. work experience, the arrival cohort (decade), child(ren), country of origin (India, China, Philippines, Canada, U.K., Mexico, and Iran), race, physical disability, employer sector, employer size, employer region, and self-employed.
As reported in table 3, the share of temporary workers among all immigrants increases from 7.9% in the 2010 cycle of the NSCG to about 12% in the 2017 cycle. Also, according to a USCIS report, on average, about 240,000 H-1B visas got issued per year during 2007–2017 (U.S. Citizenship and Immigration Services, 2019). With a gradual increase in the supply of such elite professional workers over the years, assuming that the demand for them either stayed constant or increased at a lower rate, the decline in the temporary workers’ wage premium makes sense.
In addition, as can be seen in tables 4 and 5, from 2010 to 2017 the level of education among temporary workers in the U.S. increased significantly, as did the percentage of them who had degrees in computer, IT, and engineering fields. Neither of these two trends was seen among natives. That is why controlling for the level of education and field of education along with other factors causes a sharp decline in the work visa wage premium compared to the result driven from the unconditional model specification (model with no controls).
Conclusion
The 2010, 2013, 2015, and 2017 waves of the National Survey of College Graduates (NSCG) are used in this study to examine if there is any discrepancy between the earnings of immigrants, who are working in the United States on a temporary work visa and at least hold a bachelor’s degree, and those of college graduate natives. We exploit cross-sectional analysis and run our models on the pooled data to take advantage of all of the observations over 7 years. We also look further to see whether the native-temporary worker earnings gap is different for men compared to women, for native English speaking immigrants, for immigrants with specific countries of origin, and/or for people having different fields of study or occupations. In addition, we run the models on the four survey samples separately to see the changes in the native-temporary worker wage difference over time.
By running our regressions on the pooled data and controlling for a variety of socio-economic and demographic factors affecting earnings, we find that highly educated immigrants holding temporary work visas have 29.5 log point (29.5%) wage premium over U.S.-born natives. In addition, our results from running the model on 2010, 2013, 2015, and 2017 cycles show that the premium has decreased significantly from 2010 to 2017 (from 63.5% to 17.4%). According to our results, this wage premium is not different for men or women. However, although not significantly different for most of nationals, it is lower for temporary workers originally from countries such as India and Iran. We find that native English speaking temporary workers have a premium which is about 14% larger than others. In addition, our results show that while some fields of education and occupations do not have a wage difference, in some others we see up to a 44% gap between natives and temporary workers.
The immigrants’ wage premium that we found in this study might suggest that the demand for these workers outweighs the supply. If highly educated professionals who have migrated to the United States are being paid a premium over U.S.-born counterparts because the U.S. labor market demands more highly trained workers than there is supply for, then this would suggest that easing immigration rules for such workers22For instance, developing a merit-based immigration program like the Federal Skilled Worker program of Canada or the similar program in Australia could be a solution. may be very helpful to the U.S. economy and even prevent companies from moving jobs overseas. Another policy implication is that United States needs to encourage native-born workers to pursue training and education that meets the needs of its labor market.
As mentioned earlier, the NSCG data does not clarify the exact type of temporary work visas, and it includes all of the temporary work visa programs that are mentioned in table 1. However, since the H-1B program has the majority of temporary work visas in the United States, the findings of this study might cautiously be also applied to those on H-1B when compared to natives.
Appendix
Estimation results – age replaced by years since degree
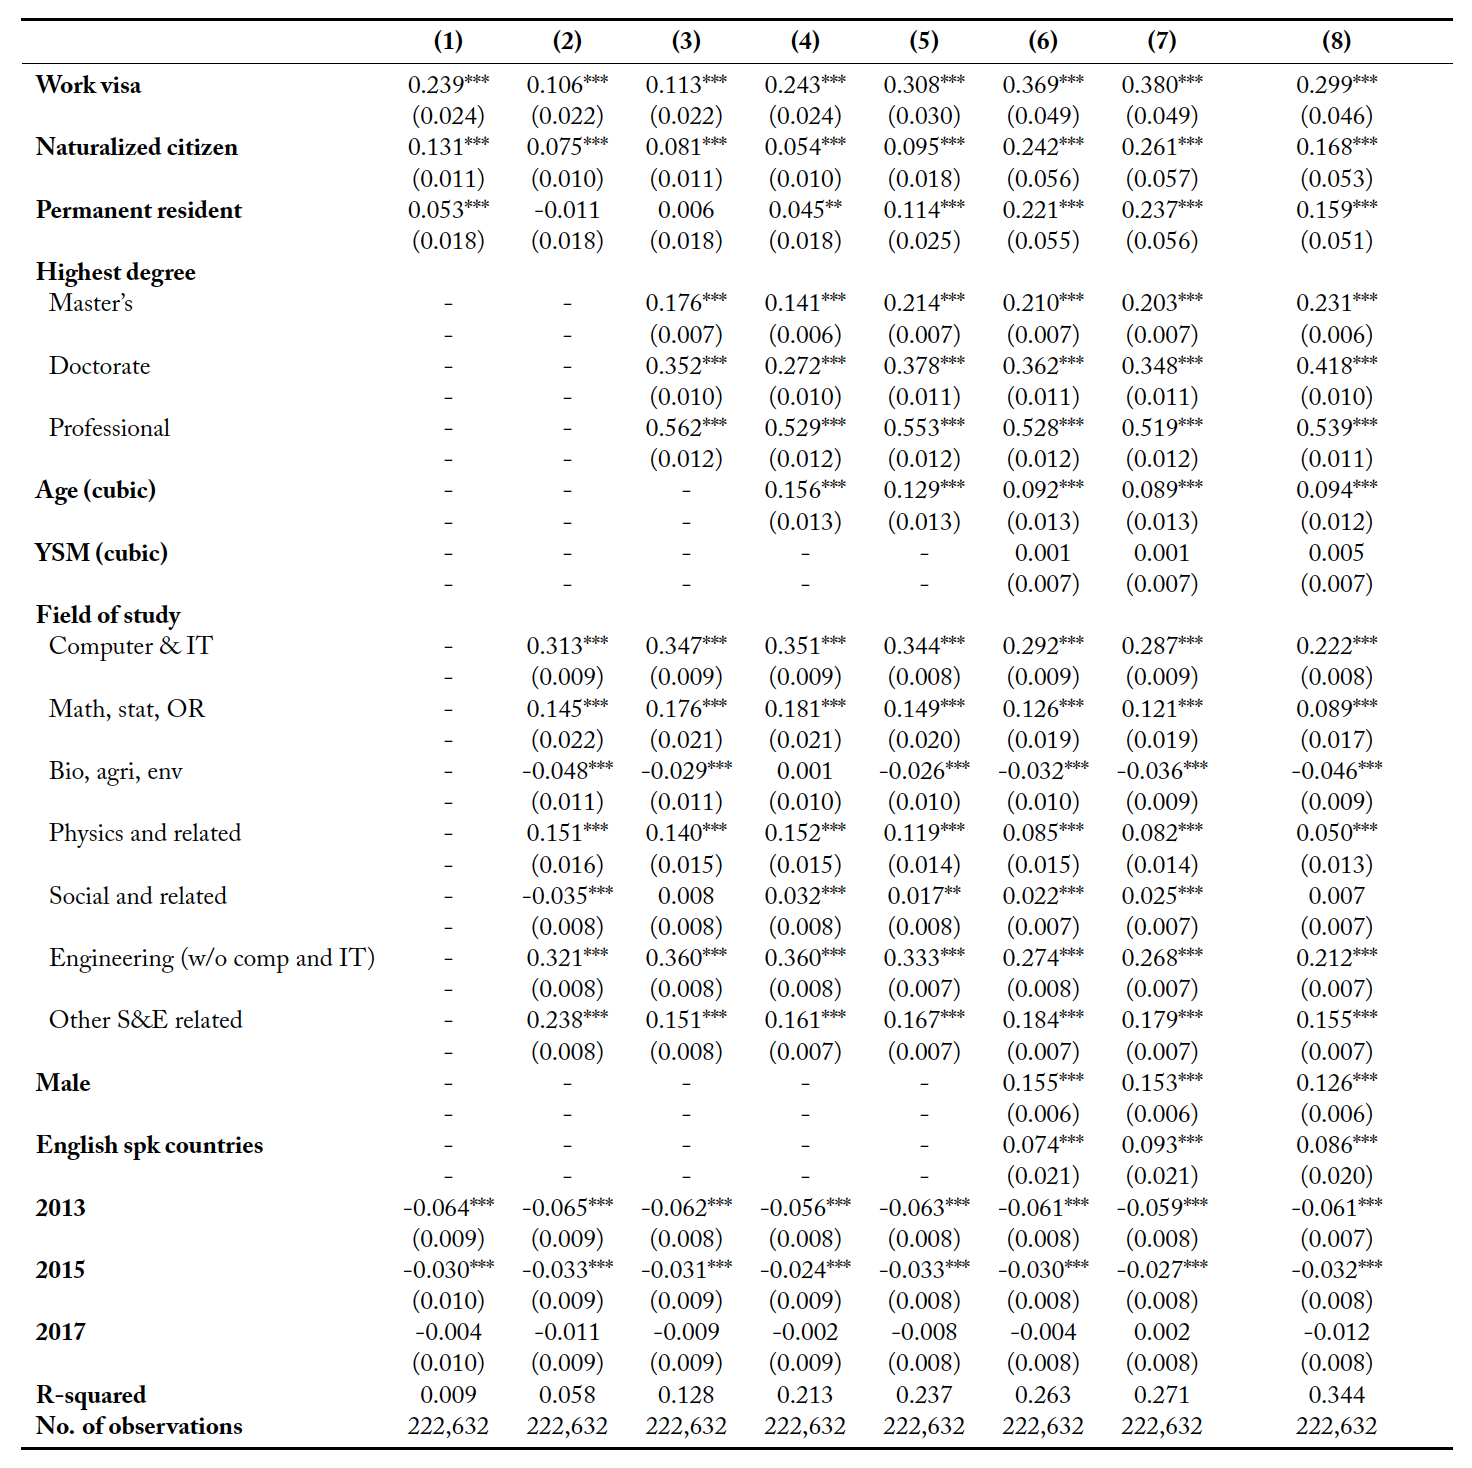
Table 1 depicts estimation results for the same eight models as shown in the main text, but using years since highest degree instead of age as a proxy of experience.
Estimation results using full-time employees only
Tables 2 depicts estimation results for the same eight models as shown in the main text, but only using observations that have full-time jobs.
Table 1. OLS Regressions Results (Pooled) – Age (Cubic) Replaced by YSD1 (Cubic)
1 YSD measures years since obtaining the highest degree.
*** p<0.01, ** p<0.05, * p<0.1; Numbers in parentheses are robust standard errors; coefficients are estimated using OLS weighted by survey weights; log of hourly wages adjusted to 2017 dollars is the dependent variable. U.S. natives are the base group; other independent variables that exist in regressions but are not reported are as follows: U.S./non-U.S. degree (present in regressions 3 to 8) YSD2 and YSD3 (reg. 4 to 8), age-at-arrival and potential foreign and US experience (reg. 5 to 8), YSM2 and YSM3, the arrival cohort (decade), children, and country of origin (India, China, Philippines, Canada, U.K., Mexico, and Iran) (reg. 6 to 8), race, and physical disability (regressions 7 and 8), employer sector, employer size, employer region, and self-employed (present only in the 8th regression).
Table 2. OLS Regressions Results (Pooled) – Full-Time Workers Only
*** p<0.01, ** p<0.05, * p<0.1; Numbers in parentheses are robust standard errors; coefficients are estimated using OLS weighted by survey weights; log of hourly wages adjusted to 2017 dollars is the dependent variable. U.S. natives are the base group; other independent variables that exist in regressions but are not reported are as follows: U.S./non-U.S. degree (present in regressions 3 to 8) YSD2 and YSD3 (reg. 4 to 8), age-at-arrival and potential foreign and US experience (reg. 5 to 8), YSM2 and YSM3, the arrival cohort (decade), children, and country of origin (India, China, Philippines, Canada, U.K., Mexico, and Iran) (reg. 6 to 8), race, and physical disability (regressions 7 and 8), employer sector, employer size, employer region, and self-employed (present only in the 8th regression).
References
Altonji, J. G. and D. Card (1991). The effects of immigration on the labor market outcomes of less-skilled natives. In Immigration, Trade, and the Labor Market, pp. 201–234. University of Chicago Press.
Aobdia, D., A. Srivastava, and E. Wang (2018). Are immigrants complements or substitutes? Evidence from the audit industry. Management Science 64(5), 1997–2012.
Borjas, G. J. (1985). Assimilation, changes in cohort quality, and the earnings of immigrants. Journal of Labor Economics, 463–489.
Borjas, G. J. (1994). The economics of immigration. Journal of Economic Literature 32(4), 1667–1717.
Borjas, G. J. (1999). The economic analysis of immigration. Handbook of Labor Economics 3, 1697–1760.
Borjas, G. J. (2005). The labor-market impact of high-skill immigration. American Economic Review 95(2), 56–60.
Borjas, G. J. (2015). The slowdown in the economic assimilation of immigrants: Aging and cohort effects revisited again. Journal of Human Capital 9(4), 483–517.
Bound, J., B. Braga, J. M. Golden, and G. Khanna (2015). Recruitment of foreigners in the market for computer scientists in the United States. Journal of Labor Economics 33(S1), S187–S223.
Bound, J., G. Khanna, and N. Morales (2017). Understanding the economic impact of the H-1B program on the United States. In High-Skilled Migration to the United States and Its Economic Consequences, pp. 109–175. University of Chicago Press.
Bourveau, T., D. Stice, H. Stice, and R. M. White (2019). H-1B visas and wages in accounting: Evidence from Deloitte’s payroll. Available at SSRN 3101562.
Bureau of Labor Statistics (2019). Consumer price index. Web site: http://www.bls.gov/cpi; last accessed May 5, 2019.
Card, D. (2005). Is the new immigration really so bad? Economic Journal , F300–F323.
Card, D. (2009). Immigration and inequality. Technical report, National Bureau of Economic Research. Chellaraj, G., K. E. Maskus, and A. Mattoo (2008). The contribution of international graduate students to US innovation. Review of International Economics 16(3), 444–462.
Chiswick, B. R. (1978). The effect of Americanization on the earnings of foreign-born men. The Journal of Political Economy, 897–921.
Chiswick, B. R. and W. Miller (2011). The “negative” assimilation of immigrants: A special case. Industrial & Labor Relations Review 64(3), 502–525.
Doran, K., A. Gelber, and A. Isen (2014). The effects of high-skilled immigration policy on firms: Evidence from H-1B visa lotteries. Technical report, National Bureau of Economic Research.
Drago, D. M. (2014). Losing the best and the brightest: The disappearing wage premium for H-1B visa recipients. Vand. J. Ent. & Tech. L. 17, 1051.
Dustmann, C. and Y. Weiss (2007). Return migration: Theory and empirical evidence from the UK. British Journal of Industrial Relations 45(2), 236–256.
Goldin, C. (1994). The political economy of immigration restriction in the United States, 1890 to 1921. In The Regulated Economy: A Historical Approach to Political Economy, pp. 223–258. University of Chicago Press.
Hunt, J. (1992). The impact of the 1962 repatriates from Algeria on the French labor market. ILR Review 45(3), 556–572.
Hunt, J. (2011). Which immigrants are most innovative and entrepreneurial? Distinctions by entry visa. Journal of Labor Economics 29(3), 417–457.
Hunt, J. and M. Gauthier-Loiselle (2010). How much does immigration boost innovation? American Economic Journal: Macroeconomics 2(2), 31–56.
Kerr, S. P., W. R. Kerr, and W. F. Lincoln (2015). Skilled immigration and the employment structures of US firms. Journal of Labor Economics 33(S1), S147–S186.
Kerr, W. R. and W. F. Lincoln (2010). The supply side of innovation: H-1B visa reforms and US ethnic invention. Journal of Labor Economics 28(3), 473–508.
Lindsay Lowell, B. and J. Avato (2014). The wages of skilled temporary migrants: Effects of visa pathways and job portability. International Migration 52(3), 85–98.
Lofstrom, M. and J. J. Hayes (2011). H-1Bs: How do they stack up to US born workers?
Mincer, J. A. (1974). Age and experience profiles of earnings. In Schooling, Experience, and Earnings, pp. 64–82. NBER.
Miranda, A. and Y. Zhu (2013). English deficiency and the native–immigrant wage gap. Economics Letters 118(1), 38–41.
Mithas, S. and H. C. Lucas Jr (2010). Are foreign IT workers cheaper? US visa policies and compensation of information technology professionals. Management Science 56(5), 745–765.
Monras, J. (2020). Immigration and wage dynamics: Evidence from the Mexican peso crisis. Journal of Political Economy 128(8), 3017–3089.
Mukhopadhyay, S. and D. Oxborrow (2012). The value of an employment-based green card. Demography 49(1), 219–237.
National Science Foundation (2019). National survey of college graduates. Web site: http://www.nsf.gov/statistics/srvygrads/#sd; last accessed May 3, 2019.
Orrenius, P. M. and M. Zavodny (2007). Does immigration affect wages? A look at occupation-level evidence. Labour Economics 14(5), 757–773.
Peri, G., K. Shih, and C. Sparber (2015). STEM workers, H-1B visas, and productivity in US cities. Journal of Labor Economics 33(S1), S225–S255.
Rivera-Batiz, F. L. (1990). English language proficiency and the economic progress of immigrants. Economics Letters 34(3), 295–300.
Rodríguez-Planas, N. and R. Vegas (2014). Do Moroccan migrants to Spain fare better or worse than other migrants? Middle East Development Journal 6(2), 308–328.
Sparber, C. (2018). Choosing skilled foreign-born workers: Evaluating alternative methods for allocating H-1B work permits. Industrial Relations: A Journal of Economy and Society 57(1), 3–34.
U.S. Citizenship and Immigration Services (2019). H-1B visa report: 2007–2017. Web site: https://www.uscis.gov/sites/default/files/USCIS/Resources/Reports%20and%20Studies/Immigration% 20Forms%20Data/BAHA/h-1b-2007-2017-trend-tables.pdf; last accessed November 5, 2020.
U.S. Citizenship and Immigration Services (2020a). Overview of optional practical training (OPT) for F-1 students. Web site: https://www.uscis.gov/working-in-the-united-states/students-and-exchange-visitors/optional-practical-training-opt-for-f-1-students; last accessed November 25, 2020.
U.S. Citizenship and Immigration Services (2020b). Overview of temporary (nonimmigrant) workers in the U.S. Web site: https://www.uscis.gov/working-in-the-united-states/temporary-nonimmigrant-workers; last accessed November 25, 2020.
U.S. Department of Homeland Security (2020). Overview of U.S. study visas. Web site: https://studyinthestates.dhs.gov/2015/01/which-visa-classification-right-me; last accessed November 25, 2020.
U.S. Department of States (2020). Overview of U.S. temporary worker visas. Web site: https://travel.state.gov/content/travel/en/us-visas/employment/temporary-worker-visas.html; last accessed November 5, 2020.