


 Orlando Sentinel
 Climate Power
I. Introduction
In September 2017 Hurricanes Irma and Maria struck Puerto Rico in rapid succession, bringing catastrophic losses in property and lives to hundreds of thousands of families. In the months following the hurricanes, over 120,000 individuals and families rapidly fled Puerto Rico for the U.S. mainland. This paper examines the short-run economic impact of this sudden migration event on Orlando, the city which received a plurality of these refugees. Along with studying the impact of this event on the broader labor market, we examine whether there is evidence of effects on employment and earnings for incumbent workers, as well as which sectors were affected and whether there was a firm-creation response. To do so, we employ a synthetic control approach using a data source that provides virtually-complete coverage of county-level employment outcomes at a high frequency throughout our study period. Our results are consistent with a story in which migrants place modest downward pressure on earnings for natives in sectors most exposed to the new migrant labor, while having positive effects on employment and earnings for workers in sectors which meet the consumer demand of migrants.
Measuring the impact of immigrants on local economies has been a focus of economists for decades. Several papers have analyzed the local labor market effects of sudden waves of immigration. Examples include the analysis of the inflow of Soviet Jews to Israel during the 1990s (Cohen-Goldner and Paserman, 2011); the inflow of Syrians to Turkey in 2013–15 (Ceritoglu et al., 2017); and the inflow of Algerians to France in the 1950s (Hunt, 1992). The only case similarly studied in the U.S.—potentially over-studied, given the limited amount of data available and the fact that the event now happened 40 years ago—is the Mariel Boatlift.1Another weather event similar to Maria, Hurricane Katrina, has also been studied quite substantially, although most of the papers focus on the impact on the out-migrants who fled New Orleans and the surrounding area (rather than on people in the receiving communities). De Silva et al. (2010) look at the impact on wages of a large relocation of evacuees to Houston, and find that there was an aggregate, small wage depression of 0.7 percent in low-skill industries. Compared to De Silva et al. (2010), our paper uses a more recently developed and, we argue, more appropriate estimation strategy to test a similar set of outcomes. This was an episode in 1980, in which approximately 100,000 people fled from Cuba, mainly relocating to Miami. While early studies established that this large inflow had no impact on local wages even in the short run (Card (1990)), recent re-analyses of the event have generated some disagreement on the effects, especially with respect to the impact on the small subgroup of male, less-educated, native workers (Borjas, 2017; Peri and Yasenov, 2019; Clemens and Hunt, 2019). The details of the controversy are centered on measurement, sample choice, and methods used.
For several reasons, the event we study here is much more relevant than the Mariel Boatlift for informing our current understanding of the local labor market impact of immigration in the U.S. First, the episode we study is much more recent, and the economy of Orlando in 2018 is more comparable to current U.S. metropolitan areas than was the economy of Miami in 1980. Second, the impact of this episode is a consequence of migration in response to an extreme weather event—an occurrence likely to become more frequent in the future. Third, the case of immigration from Puerto Rico involves people who have similar levels of education to native mainland U.S. workers, while the Cubans in the Mariel Boatlift (Marielitos) had much lower levels of education. This means that the Hurricane Maria migration closely resembled the sort of immigration the U.S. has received in the last 20 years (i.e., 2000–2018)—which included a large share of college-educated immigrants—while the low-skilled immigration of Marielitos was more similar to the immigration of the 1990s. We also note that, similarly to the Cuban Marielitos, immigrants from Puerto Rico had immediate access to the U.S. labor market and other benefits available to U.S. citizens. This implies that their potential crowding-out impact on native workers would be at a maximum. Hence our findings of no crowding-out and of small overall wage effects, positive in certain sectors and negative in others, are particularly compelling.
Fourth, we employ the more current “synthetic control” estimating strategy (similarly to Peri and Yasenov (2019)) first proposed by Abadie and Gardeazabal (2003) and further developed in Abadie et al. (2010, 2015), and subject to recent important improvements.2Readers are pointed to Abadie (Forthcoming) for an excellent current review of the synthetic control literature, which is continually expanding A fifth advantage of our study, relative to the Mariel Boatlift literature—which relies on small, weighted samples of survey data from the Current Population Survey (CPS)—is that we use data from the Quarterly Census of Employment and Wages (QCEW) and the Quarterly Workforce Indicators (QWI). These are county-by-industry-level administrative data covering 95+% of all workers, observed on a quarterly basis.3Employment is observed on a monthly basis in the QCEW. The other variables are observed quarterly. The detail and precision of our analysis is therefore significantly greater than in those studies. Sixth, we also analyze the impact on number of firms—an important and under-researched margin of adjustment to immigration (recently, Beerli et al. (2018) show the importance of firms’ response to increased availability of immigrants for understanding labor market impacts). Seventh, and finally, we analyze a potential positive labor demand effect generated by the immigrants’ local consumption behavior, analyzed through different impacts across sectors (the previous standard for this type of analysis was Bodvarsson et al. (2008)).
Using data from FEMA applications for assistance related to the hurricanes, and with reference to other analyses examining social media usage and air travel of Puerto Ricans in the months after Hurricane Maria hit Puerto Rico, we establish that the Orlando Metropolitan Area almost certainly received more people from the Island than did any other city.4We take Orlando to be the five counties which comprise the Orlando Commuting Zone: Lake, Orange, Osceola, and Seminole—which comprise the Orlando Metropolitan Area—plus Sumter County. Over 120,000 people left Puerto Rico for the U.S. mainland in the months from September 2017 to March 2018, 24,000 of whom we estimate ended up in Orlando. This represents around 1 percent of Orlando’s pre-hurricane population and around 2 percent of its
pre-hurricane total employment. Both in levels and as a percentage of the population, Orlando received many more refugees than the next most-impacted metropolitan areas (New York and Miami). We therefore consider it as the treated unit in our analysis. This sudden out-migration of Puerto Ricans from the Island and into Orlando, as a result of Hurricane Maria, constitutes a good approximation to a natural experiment—a sudden and unexpected event, uncorrelated with conditions in the Orlando local economy.
We analyze the impact of this migration event between September 2017 and September 2018 on employment and earnings in the Orlando area. We look first at aggregate effects, then shift our focus to specific sectors—namely the construction, retail trade, and accommodations & food services sectors (hereafter, hospitality). We do this first for all workers, then specifically for non-Hispanic and less-educated subgroups (those with a high-school degree or less education) as proximate measures, respectively, of the incumbent native-worker population (Orlando non-Hispanic residents are likely to be U.S.-born, i.e., natives) and of those who may be in competition with the new Puerto Rican arrivals if they took manual and less-skilled jobs.
Sector-specific analysis in the short-run helps us to identify potential effects of the shock on labor demand and labor supply. We demonstrate that the construction sector was the most likely to experience a sudden increase in labor supply in the short run. A large share of Hispanics were already employed in the construction sector before the hurricane, and most construction jobs require limited use of the English language—which less than 40% of Puerto Rican residents speak “well.” Moreover, while increased demand for new buildings may eventually follow the arrival of immigrants, we see no evidence the housing market was affected in the short run. On the other hand, the retail and hospitality sectors were likely to experience positive demand shocks in the short run, as new additions to a local population require accommodations, retail goods, and food services. While some immigrants were employed in these sectors, the short-run impact of the new arrivals should mainly reflect an increase in demand for retail and hospitality workers, resulting from the increased consumer demand in those sectors. By quantifying the effect on employment and wages in each sector, we learn about the potential labor supply and labor demand shifts as a consequence of immigration.
Additionally, we consider the response of establishments in the area. The speed and magnitude of the response by firms to this expansion is important for understanding the mechanisms through which the labor supply shock was absorbed by the local economy in the short run. While our estimated effects are all positive, their pre-treatment trends are noisy enough that none of them reach a conventional level of significance according to our test statistics.5Our 12-month estimate of the impact on construction establishments is significant according to our moving block p-value, but not according to our more conservative test statistics. The overall evidence is suggestive of a positive firm-creation response, but not large enough to be significant in the short-run.
Broadly, our results are consistent with a story in which Puerto Rican refugees in Orlando constituted both a labor supply shock concentrated in the construction sector, and a local demand shock for goods and services in the retail and hospitality sectors which resulted in increased labor demand in those sectors. While we do find evidence of a negative impact on construction sector wages of natives and less-educated workers 12 months after the migration event (-2.5% and -1.5%, respectively), we also find evidence that retail earnings increased for natives and less-educated workers (+2.1% and +1.2%, respectively) over that same period.6The construction sector employed between 5 and 6.5% of Orlando workers over the period, while the retail sector typically employed between 12 and 13%. Looking across all sectors and all workers, despite the large and sudden influx of thousands of new workers into the region, we find no evidence of any negative impact on wages (the point estimates are, in fact, positive yet not robustly significant), suggesting that the sector-specific positive wage effects at least offset the negative ones in the aggregate. This aggregate balancing effect holds for native and less-educated workers as well. In fact, we also estimate a 0.8% increase in aggregate employment for each of those groups 12 months after the hurricane. These results are broadly robust to several controls and specifications, and suggest that this large inflow of workers was quickly absorbed into and grew the local economy.
The rest of this paper proceeds as follows: Section II. describes the demographic and employment trends of immigrants from Puerto Rico in the mainland United States, and justifies focusing on Orlando as the (most intensely) treated unit. Section III. describes our data and empirical methodology. Section IV. describes the results from our analyses, and presents a series of robustness checks—including a test for whether our results were impacted by Hurricane Irma’s effects on Orlando, and an analysis of housing market conditions before the migrants’ arrival. Section V. concludes.
II. Characteristics and Trends of Puerto Rican Immigration
A. Historical Migration and Characteristics of Migrants
During the first half of the 20th century and for several decades thereafter, rates of migration from Puerto Rico to the mainland remained low. The Puerto Rican population on the mainland was an estimated 1,513 in 1910 and 226,110 in 1950, respectively constituting 0.002 percent and 0.15 percent of the total population in those years (Whalen and Vazquez-Hernandez, 2005). During the later half of the 20th century and continuing into the 21st, however, Puerto Rican migration to the mainland United States increased significantly. As of 2015 an estimated 5.4 million Puerto Ricans resided in the mainland U.S. (constituting 1.6 percent of the U.S. population). This number is particularly striking when compared to the total population of 3.5 million people residing in Puerto Rico as of 2018 (Whalen and Vazquez-Hernandez, 2005). During these years, large Puerto Rican communities formed in New York City and the surrounding areas, in Philadelphia and Chicago, and in parts of Florida. Migration followed the usual pattern, with new immigrants settling in areas with relatively large Puerto Rican communities.
In recent decades, the most significant concentrations of Puerto Ricans developed in the New York area and in the Orlando area (see online Appendix Figure A1) with Orlando becoming a particularly popular destination in the years leading up to 2017. Puerto Ricans’ full access to labor opportunities in the mainland United States suggests that the availability of jobs in the U.S. may have been the largest driver of mobility from the Island to the mainland.7Migrants coming to the United States are often positively “selected” from their country in terms of education, mainly because of the large skill premium paid in the U.S. relative to countries of origin (Grogger and Hanson, 2011). Borjas (2008), however, documented negative selection of pre-2000 Puerto Rican immigrants, in terms of education.
Table 1 shows differences in average characteristics of Puerto Rican migrants who arrived in the year preceding Hurricane Maria, compared to reference groups.8Individuals are restricted to those who are in the labor force. The first column shows the difference with U.S. natives, the second with residents of Puerto Rico, the third with U.S. natives in Florida.9A negative value implies that the Puerto Rico migrants have a smaller value for that variable relative to the comparison group. The largest difference between recent Puerto Rican immigrants and U.S. natives is in their average age, as Puerto Rico immigrants are significantly younger and less likely to be married than natives. They are also more likely to be male. On the other hand, education levels are similar. While the difference in average years of schooling compared to U.S. natives is statistically significant, compared to the average Florida native it is not significant and it is small—equal to 0.38 and 0.13 years of schooling, respectively. There is no significant difference in the share of college-educated immigrants from Puerto Rico and natives in the U.S. or in Florida. The inflow can therefore be characterized as mostly young, with an education composition similar to that of natives.
B. Migration After Hurricane Maria
Early estimates put the number of Puerto Ricans who fled to Florida alone in the early months after September 2017 at over 200,000 people. Later estimates, based on Facebook data, substantially revised this number down, to 44,000 people who moved from Puerto Rico to Florida and stayed there until at least March 2018 (Alexander et al., 2019). Estimates based on flight passenger lists confirm between 30,000 and 50,000 people moved out of Puerto Rico to Florida in the months after the hurricane (Rayer, 2018). Meanwhile, an analysis of ACS/PRCS data from the U.S. Census Bureau puts the number of net out-migrants from Puerto Rico between July 2017 and July 2018 at 123,399 (U.S. Census Bureau, 2018), and the Center for Puerto Rican Studies estimates this number to be more than 135,000 (Centro, 2018). We complement these estimates with additional evidence to get an idea of the distribution of those evacuees across the U.S. Data from applications for disaster relief from the Federal Emergency Management Agency (FEMA) are useful to gather a geographic distribution of evacuees. These application data, obtained through a Freedom of Information Act (FOIA) request, represent claims made to FEMA to obtain disaster relief funds filed by people who had a home in Puerto Rico which was damaged by Hurricanes Irma and/or Maria. By looking at the ZIP code of residence before the hurricane and the ZIP code at the time of filing (after Hurricane Maria occurred), we can identify the likely residence of these Puerto Ricans on the mainland in the months after the hurricane. The distribution of these applications (aggregated to commuting zones and shown in Figure A2 in the online Appendix, in both level and per capita terms) reveals that these FEMA applications were heavily concentrated in relatively few areas.
Especially in per capita terms, the Orlando area exhibits by far the largest concentrations: with nearly 4,000 applications, Orlando had more than two-and-a-half times as many applications as the next most heavily affected commuting zones (Fort Lauderdale-Miami and New York-Nassau-Suffolk). These FEMA applications in the Orlando area represent 20 percent of the total received. Combining the U.S. Census Bureau estimate of 123,399 net out-migrants from Puerto Rico between July 2017 and July 2018 with the FEMA application data as an approximate estimate of the geographic relocation of these migrants, we conservatively estimate that around 24,000 Puerto Ricans relocated to the Orlando area in the months following the hurricanes. This represents over 1 percent of Orlando’s population, 1.5 percent of its working-age population (aged 16–64), and around 2 percent of its pre-hurricane total employment. We conservatively estimate that at least half of these migrations are directly attributable to the hurricanes (based on out-migration trends from Puerto Rico in the years prior). This inflow was smaller than that of Cubans arriving in Miami after the Boatlift (which equaled 5–6% of the Miami labor force). Nevertheless, the post-Maria Puerto Rican refugee flows provided a significant shock to Orlando’s population and labor force, especially as the large majority of this inflow took place within a relatively short period of 1-3 months. To put this in context, an inflow of immigrants equal to 1 percent of the labor force is larger than the annual inflow of Mexicans during the 1990s, when Mexican immigration into the U.S. was highest. This inflow as a percent of Orlando’s labor force is thus comparable to or higher than immigration inflows in the peak years for the U.S. as a whole, and it was concentrated in the months between September 2017 and March 2018. To compare this inflow to another well-known international event, the inflow of Syrian refugees in Turkey was comparable to our setting, at 2.5 percent of the local population over the course of a couple of years (see Tumen (2015)).
C. Sector Distribution of Puerto Rican Migrants
Before the hurricanes the distribution of Puerto Rican migrants across sectors of employment in Orlando was not very different from that of natives (online Appendix Table A1). As of 2016, Puerto Rican natives were slightly more concentrated in local services such as transportation and retail, and slightly less concentrated in education and management.10It is difficult to use the 2017 or 2018 ACS to calculate the sector composition of Puerto Rican migrants in Orlando after Maria, as this group is very small in the ACS and sampling variation can be quite large. Additionally, because the month of interview is uncertain, it is hard to tell who, among those who arrived in a given year, is an evacuee in the 2017 or the 2018 ACS samples. In our analysis we use the QWI data to identify non-Hispanics, allowing us to study the native response to immigrants. However, when we consider the sector distribution of all Hispanics and of Hispanics born abroad, (columns (3) and (4) of online Appendix Table A1) we see a significant over-representation in the construction sector. Because of language and cultural commonalities, this extended Hispanic group can be a very important network for Puerto Ricans to find jobs. Moreover the construction sector may have been a particularly important industry for those workers in the short run—it is the sector in Orlando with the largest percentage of workers who do not speak English well (11.8 percent do not speak English or do not speak it well). The majority of Puerto Rican residents are not fluent in English (only about a third speak English “well” according to the Puerto Rico 2010 ACS), hence a job in construction would have been more attainable in the short run. We also note the Bureau of Labor Statistics (2015) also shows that in 2014 Hispanic workers in the U.S. were more likely to work in the construction sector than any other sector in the economy. Finally, we use the QWI to look at employment in Orlando and demonstrate that construction saw substantially larger growth in the Hispanic share of employment between Q2 2017 (before the hurricane hit), and Q2 2018 compared to other industries (online Appendix Figure A3).11There was growth in the Hispanic employment share in all sectors, as Orlando has in general been experiencing higher growth in its Hispanic population than in its population as a whole. Combining these pieces of information, it is reasonable to think that the evacuees from Maria found in Orlando’s construction sector a quickly accessible and attractive source of jobs, at least in the short run, relative to other sectors.
III. Data and Methodology
A. Overview
The migration push out of Puerto Rico was very sudden and, as triggered by the hurricanes, fully uncorrelated with economic fundamentals in Orlando. It was the presence of a large community and network of Puerto Ricans already in Orlando that attracted the migrants there much more than to other cities. Taken together, these features constitute a natural experiment and make this event a good candidate to estimate the causal effects on Orlando’s economic outcomes, by comparing them to those of similar and unaffected cities. We focus on the Orlando-area labor market captured by its commuting zone (CZ)—an aggregation of counties constituting the Orlando labor market—to internalize most of the effects.12These have become the standard units of analysis when considering labor market impacts (see, for instance, Autor et al. (2013); Autor and Dorn (2013)). On a county basis (i.e., prior to cross-walking our QCEW and QWI data into 1990 CZs), we combine the five boroughs of New York City, and individually combine Virginia’s independent cities with their surrounding counties.
We call the Orlando CZ our “treated unit” and we adopt a synthetic control approach to estimate the effects on local (log) employment, compensation per worker, and establishment counts. We analyze the local economy in aggregate, and also focus on three sectors: the construction sector (NAICS 23) which, as argued in the previous section, received potentially the largest labor supply increase from the migrants’ arrival; the retail trade sector (NAICS 44-45) and the accommodation & food services, or hospitality, sector (NAICS 72). Retail and hospitality are non-tradable sectors most likely to have experienced a labor demand shock associated with the increased demand for local accommodations, hospitality services, and goods for purchase which the migrants would have wanted. While some immigrants may have worked in these sectors, Puerto Rican employment does not appear to have disproportionately concentrated here. Therefore, while any effects on construction employment and wages are primarily the result of a labor supply shock in that sector, the effects on retail and hospitality should primarily be the result of a labor demand shock (with a possible small labor supply increase). The aggregate effects, then, are a combination of both the supply of new workers and the expenditures of new consumers in the Orlando economy.
After analyzing overall employment and average wage effects, we turn our attention to a second group of outcomes which approximate the effects on native workers (as done in in Card (1990); Borjas (2017); Peri and Yasenov (2019)). To do this we analyze the employment and wages of non-Hispanic workers, who are very likely to be U.S. born, both in the overall economy and in the specific sectors where separate labor demand and supply effects should be more visible.
We also try to identify effects on the group of workers that is more vulnerable and in the short-run may be more affected by labor market competition from immigrants—who may take jobs that do not require sophisticated language skills and are disproportionately concentrated in the construction sector. These are typically workers with low levels of education (high school or less) and who often receive relatively low pay (on average). While immigrants from Puerto Rico may not have had levels of schooling significantly lower than natives, in the short run they may have been willing to “downgrade” their job expectations in order to find work (e.g., if their English language skills were not particularly strong). In such a case, even with a similar education distribution among immigrants and natives, there may still have been stronger competition for less-skilled jobs in the short run.
Finally, we look at changes in the number of local establishments as a proxy of the response of local investment, at least in the short-term. Firm creation is an important mechanism of adjustment to immigration in the long run, but there has been very little work done studying the rapidity of its response in a local economy.
B. Data
Our primary analysis is conducted using data from the Quarterly Census of Employment and Wages (QCEW), published by the U.S. Census Bureau. The QCEW is derived from the Unemployment Insurance (UI) accounting system in each state, and effectively covers 95%+ of all employed individuals from UI-reporting establishments. The data are available at the industry-by-county level down to the 6-digit NAICS definition, and are observed monthly for employment and quarterly for earnings and establishments. For cells that are particularly small there may be “suppression” of data due to privacy reasons, but there are almost no suppressions at the 2-digit NAICS level. This provides complete coverage of employment and earnings, and the availability of these data each month or quarter (depending on the variable) allow us to conduct a reliable short-run analysis along several dimensions. The complete coverage and high reliability are also substantial advantages relative to studies of the Mariel Boatlift, which are all based on small, weighted samples from the Current Population Survey. Of our variables of interest, employment is observed monthly while compensation, establishments, and the derived compensation-per-worker variables are observed on a quarterly basis. We focus on the period 2014 Q1 – 2018 Q3 for the quarterly-observed variables, and January 2014 — August 2018 for employment. This allows us to include three and a half years of pre-hurricane data and one year of post-hurricane data.
Additional analysis is conducted using data from the Quarterly Workforce Indicators (QWI). A product of the U.S. Census Bureau, the QWI data are the result of the Longitudinal Employer-Household Dynamics (LEHD) program, which (as with the QCEW) uses data from state UI accounting systems, as well as other sources. The QWI data report employment and earnings of employees at the industry-by-county level, and they also break the data down by education level and by ethnicity. This, as mentioned above, allows us to measure labor market outcomes for a subset of workers who are likely to be natives in the Orlando labor market (non-Hispanic workers), as well as for workers with a high school degree or less education, who could face more precarious employment. There are some issues with the QWI data relative to the QCEW: all variables including employment are only observed on a quarterly basis; for less-educated workers, only non-youth individuals (aged 25+) are observed; a few states are missing observations for some quarters of interest; and the available data series do not cover all counties in all states for a full year after Hurricane Maria.13States missing observations for some or all counties include Arkansas, Maine, Minnesota, Mississippi, Missouri, New Jersey, Pennsylvania, South Dakota, Virginia, and Washington. This final issue somewhat restricts the number of commuting zones that can be used as control in the post-Hurricane Maria period.
C. Empirical Approach
C.1. Synthetic Control Estimator
Our main econometric analysis follows the synthetic control estimator approach introduced by Abadie and Gardeazabal (2003) and further refined by Abadie et al. (2010, 2015). This method is most often utilized with a single observed unit which experienced a treatment beginning at a single point in time, while a “donor pool” of potential “control” units did not receive such a treatment.14Recently the method has been extended to deal with multiple treated units, e.g., Cavallo et al. (2013); Abadie and L’Hour (2019); Ben-Michael et al. (2019). In our case, treatment is the inflow of Puerto Ricans to the city of Orlando, which began immediately after the sudden and unanticipated Hurricanes Irma and Maria devastated Puerto Rico. The innovation of this estimating strategy is that it identifies an appropriate control unit—the synthetic control —as a weighted average of a subset of units in the “donor pool” (an appropriate set of untreated units) that best match the pre-treatment values of a set of predictors of the outcome, including linear combinations of the period-specific pre-treatment outcomes. The path of synthetic control outcomes after treatment represents the path of counterfactual outcomes for the Orlando commuting zone, had it not been treated. The difference between the observed value in Orlando and the value for the corresponding synthetic control is the causal estimate of the treatment effect on the outcome of interest.
Formally, we observe  units (commuting zones), indexed by
  , where
  is the single treated unit (Orlando, in our case) and the remaining
  units are the untreated units in the donor pool. Each unit is observed
  total periods, indexed by
  , with
  total pre-treatment periods and
  treated periods.
  is the potential outcome observed in
  if j is not treated at , and is the potential outcome observed in if is treated at . The treatment effect (also often referred to as the “gap”) can be defined as:
(1) 
The observed outcome in j,t is: Yj,t = YN + α j,tDj,t. As only j = 1 is treated, we have:
(2) 
The goal is to estimate the dynamic path of treatment effects,  . As
. As  is observable
  , we need only estimate
  . The synthetic control estimator for is a weighted sum of the same outcomes for the non-treated units:
(3) 
The weights are obtained by minimizing the distance, between the treated unit and the non-treated ones in the donor pool, of a set of  predictor variables plus
  linear combinations of the outcomes before the treatment year. Specifically the synthetic control method selects the vector of weights
  on the units in the donor pool, given the matrix
  of weights on the
  predictor variables,15Given the relatively small number of pre-treatment periods, we follow the advice of Abadie et al. (2015) and estimate V using the regression-based method adopted as the default in the synth command for Stata Abadie et al. (2011) described in detail in Kaul et al. (2015) that solve the following problem:
(4) 
where  of dimension
  includes the values of the
  selected covariates in the pre-treatment period plus the linear combinations of the pre-treatment period observations of the outcome variable, while matrix
  includes in each row the vector of values for the same variables and time periods as in but for untreated units
  in the donor pool.16Our estimator imposes the no-intercept, adding-up, non-negativity and exact-balance constraints considered by Doudchenko and Imbens (2016). These constraints are commonly imposed on synthetic control estimators. Abadie et al. (2015) emphasize the value of the non-negativity condition, in particular, as it ensures estimates are not subject to potential extrapolation bias and helps preserve interpretability (see, also, Abadie and L’Hour (2019)).
These estimated weights are used to calculate  , and finally our estimated elements of
  :
:
(5) 
As it is important that units in the donor pool are not affected by the treatment (see e.g., Cao and Dowd (2019)) we restrict the donor pool by excluding any CZs that received any significant number of Puerto Rican evacuees (10 or more Puerto Rican Irma- or Maria-associated FEMA applications per 100,000 population). When analyzing sector-specific outcomes, to reduce the possibility of interpolation bias (i.e., including in the synthetic control some units which may match well on certain important variables but poorly on others), we further restrict the donor pool to include only those CZs at or above the 75th percentile of sector-specific employment levels. This ensures we are only allowing the synthetic Orlando (for each sector of focus) to be comprised of other CZs with large pools of workers in the same sector.17Otherwise, as Abadie (Forthcoming) notes, ”Including in the donor pool units that are regarded by the analyst to be unsuitable controls because of large discrepancies in the values of their observed attributes…or because of suspected large differences in the values of the unobserved attributes…relative to the treated unit is a recipe for bias.” For each outcome variable we also drop any commuting zone for which the outcome is not observed in every period.
This yields the group of 148–170 commuting zones18128–137 CZs for the 12-month QWI estimates (depending on the sector of focus, and including Orlando) in the United States for which data is consistently available at monthly or quarterly frequency for the time period before and after Hurricane Maria (September 2017) and which meets our qualification thresholds for inclusion (see Figure 4). These criteria exclude every commuting zone which borders Orlando, and nearly every CZ in Florida, which also minimizes the risk of any treatment spillover on the control group. Finally in order to increase homogeneity and comparability across commuting zones, for each outcome we cleaned each series of seasonal variation.19For each observed outcome of interest,  , in each CZ and each period , our LHS values are the residualized outcomes
  . This is obtained from J individual OLS regressions of a model
  , estimated separately for each and each
  , where
  is the quarter (or month) associated with each , as appropriate for each
  given the data source.
  is the local intercept for each in commuting zone , and
  is the seasonal element in associated with . That is, is the quarterly (or monthly) fixed effect associated with in , for each . Then
  is the sum of the values of the associated coefficient estimates.
September 2017 is the first treated period,  , for employment (observed monthly); Q3 in 2017 is the first treated period for variables observed on a quarterly basis. The pre-treatment period starts at the beginning of 2014, when the recovery from the Great Recession had firmly taken root. This avoids heterogeneous, short-run local labor market dynamics that occurred after the Great Recession.20One of our robustness checks extends the pre-treatment period back to the beginning of 2013. In the analysis using the QCEW data, we have
  pre-treatment periods (months) and consider
  treated periods corresponding to half a year and one year after the hurricanes hit Puerto Rico, for our outcomes observed on a monthly basis (namely employment). For the quarterly outcomes (earnings and establishments), and when using the QWI data, we have
  pre-treatment periods and consider
  treated periods.
The predictor variables included in matrix are as follows: average quarterly local construction and hospitality employment, each as proportions of aggregate local employment;21To match the economy of the synthetic Orlando with that of the actual Orlando. and the pre-treatment values of the outcomes at 6-month intervals from 2014 to 2015, and at quarterly intervals from 2016 through Q2 2017.22Kaul et al. (2015) argue that including the full set of pre-treatment outcomes as predictors will result in certain zero  weights for some covariates which may actually be important for predicting future values of the outcome variables. This can bias estimated treatment effects; thus we ensure a number are excluded. In total we have
  predictor variables in our primary specifications. 23For each specification of interest and given
  , the existence of sparse solutions to (3) with no more than
  strictly positive weights
  follows from Carathéodory’s theorem, while uniqueness obtains with a maximum of strictly positive weights provided Orlando does not fall within the convex hull of the donor pool units, and provided the columns of the predictor matrix are in general position (see Abadie and L’Hour (2019)) Figure 4 shows the commuting zones included in the donor pool when analyzing employment in aggregate and in the construction, retail, and hospitality sectors. Figure 5 shows those CZs that receive positive weight in the synthetic control for the employment and earnings outcomes, in aggregate and in the construction sector. Note that the Las Vegas and Reno commuting zones, and some commuting zones in the Los Angeles area, often receive large positive weights. This is reasonable as their economies, which strongly rely on tourism and construction, and have large numbers of Hispanic workers, each resemble the economy of Orlando.24The list of those positively-weighted CZs is also reported for these outcomes in online Appendix Table A2.
C.2. Inference
Once we have estimated the treatment effects  a key question is whether they are significantly different from 0. Hypothesis testing using a synthetic control approach comes with challenges, as this method does not produce standard errors, and large-sample inferential approaches are not appropriate. Most of the proposed approaches involve the construction of a test statistic based on some form of falsification test.25The literature on conducting inference with synthetic control estimators is relatively young and rapidly evolving. See for instance Abadie et al. (2015); Doudchenko and Imbens (2016); Hahn and Shi (2017); Ferman and Pinto (2017); Chernozhukov et al. (2017); Firpo and Possebom (2018); Abadie and L’Hour (2019) The one proposed in Abadie et al. (2015) and endorsed in Firpo and Possebom (2018) as the uniformly most powerful is the ratio of the treated-period mean squared prediction error (MSPE) to the pre-treatment-period MSPE, referred to as the RMSPE. A substantial benefit of a test statistic based on the RMSPE is that, by construction, post-treatment deviations from the null are normalized by the pre-treatment fit, such that large post-treatment deviations are not attributed undue significance if the pre-treatment fit is poor.
Alternatives to the RMPSE are proposed by Hahn and Shi (2017), who argue that permutation tests of this sort may suffer from incorrect statistical size and suggest the Andrews (2003) end-of-sample instability test, and by Chernozhukov et al. (2017), who propose an alternative moving block permutation test which may be ideal but is not the current standard. We thus apply all three tests to our estimates and present the corresponding p-values in Table 2. We also present the Andrews and moving block p-values for our secondary estimates in Table A3 in the online Appendix.26Andrews p-values and moving block p-values for our other estimates are available upon request. As the RMPSE test is the most conservative of these three (as can generally be seen in Table 2) and is the current standard for synthetic control inference, we generally base our claims of statistically significant treatment effects on RMSPE tests and report the results of that test for our secondary estimates in Table 3 and for our robustness checks in online Appendix Tables A4-A6.
The RMSPE p-value is constructed by repeating the synthetic control estimation procedure for each commuting zone in our donor pool, effectively conducting falsification or “placebo“ tests by reassigning treatment to each of the  untreated CZs in our donor pool to estimate
  . For each
  we then calculate the summary statistic:
(6) 
Our test statistic is then constructed as a p-value based on the empirical distribution of these RMSPEj:
(7) ![\begin{equation*} p=\frac{\Sigma^{J+1}_{j=1} 1[RMSPE_{j}\geq RMSPE_{1}] } {N} \end{equation*}](https://www.thecgo.org/wp-content/ql-cache/quicklatex.com-5b7a7f5a87f7dfefccedd6e51ceaa120_l3.svg "Rendered by QuickLaTeX.com")
is the total number of units and our actual treated unit (Orlando) is . Thus if the deviations between observed post-treatment outcomes and the synthetic control relative to the pre-treatment fit are large enough in Orlando relative to the distribution of differences from our placebo tests, our p-values will be small and we will reject our null hypothesis of no effect.
IV. Results
A. Effects on All Workers
Our primary synthetic control estimates are for all workers. Results for employment are illustrated in the four panels of Figure 1. Each panel of the figure plots the observed (de-seasonalized, logarithm of ) employment in Orlando against that of its synthetic control, first in aggregate (Panel A) then for the construction (Panel B), retail (Panel C), and hospitality (Panel D) sectors. We set the value to zero at the beginning of our pre-treatment period, which is January 2014. The month in which the hurricane hit (the initial period of treatment), September 2017, is the shaded area. The six months following the shaded area are those in which Orlando experienced the largest inflow of people from Puerto Rico fleeing Hurricane Maria. If they caused any significant effect on Orlando’s labor market relative to the synthetic control, it should be visible in the portion to the right of the shaded area. The distance—or “gap”—between the line representing Orlando and that of its synthetic control, after September 2017 represents our estimates of the causal effect of the inflow of Puerto Ricans as a result of the Hurricane. These gaps are shown as percentages in Figure 3, as the solid black line in each panel.
Three facts emerge from inspection of Figure 1. First, for each of our outcomes, the pre-Hurricane match between Orlando and its synthetic control is remarkably good. This implies that the commuting zones constituting our synthetic controls mimic quite well the short run fluctuations and long run trends in Orlando employment before September 2017. Figure 5 shows the commuting zones included in each particular donor pool. In particular, nine donor pool CZs were assigned positive weights for Orlando’s aggregate de-seasonalized log employment synthetic control. These donor CZs are as follows, in ascending order of weights: Fort Walton Beach-Pensacola, FL (2.7%); Fresno-Visalia-Tulare-Parterville, CA (5.3%); Las Vegas, NV-AZ (6.5%); Boise City, ID (6.7%); El Paso, TX-Las Cruces, NM (7%); Nashville, TN (11%); Provo-Orem, UT (15.3%); Fayetteville-Springdale-Rogers, AR (18.6%); and Gainesville, GA (26.9%).27Online Appendix Table A2 provides these lists for a broader set of synthetic controls. Comparing this map with Figure A2 in the online Appendix, we can see that none of the donor CZs received any meaningful number of evacuees Second, Figure 1 shows that, for aggregate as well as sector-specific employment, Orlando realized positive employment effects as a result of the migration event.28This is more obviously shown by the black lines in Figure 3 Third, this positive employment effect is largest and most clearly seen in the construction sector. One year after the hurricane hit Puerto Rico, Orlando’s construction employment was about four log points (4 percent) larger than its synthetic control.
Treatment effects (the post-treatment gaps) from Figure 1 are quantified in the first two columns of Table 2. The entries are the treatment effects 6 months (column (1)) and 12 months (column (2)) after September 2017. The table also shows the RMSPE statistics and their p-values, as well as the Andrews and the moving block p-values described in Section C.2.. These statistics indicate the significance of the treatment effect in Orlando by conducting numerous “placebo” tests in which each CZ in our donor pool is assigned treatment status (none of which were exposed to the inflow of Puerto Ricans). High positive estimated treatment effects and low p-values imply that the treatment effect is positive and significant relative to the placebos.
The treatment effect on aggregate employment 12 months after the hurricane is positive and significant at the 5% level using any of our three p-value calculation procedures. Despite the seemingly small effect size, this result is consistent with most evacuees finding jobs in Orlando, and corroborates estimates of the number of evacuees that, at least in the year after the hurricane, remained on the mainland. Specifically, this effect is about 0.4 percent of aggregate employment in Orlando. Approximately 24,000 Puerto Ricans arrived in Orlando over the 6 months following the hurricanes, at least 11,000 of whom can be attributed to the hurricanes, constituting 0.65 percent of the pre-treatment working-age population. In the years preceding the hurricanes, around 75 percent of Puerto Ricans in Orlando (and more widely) were aged 16 and over, around 60 percent of whom were employed (U.S. Census Bureau, 2017). If these patterns held among the 11,000 refugees, this would amount to about a 0.3 percent increase in the local labor force. That is, three-fourths of Orlando’s post-treatment growth in aggregate employment (relative to the synthetic control) was due to the new arrivals, with no evidence that local workers were displaced.
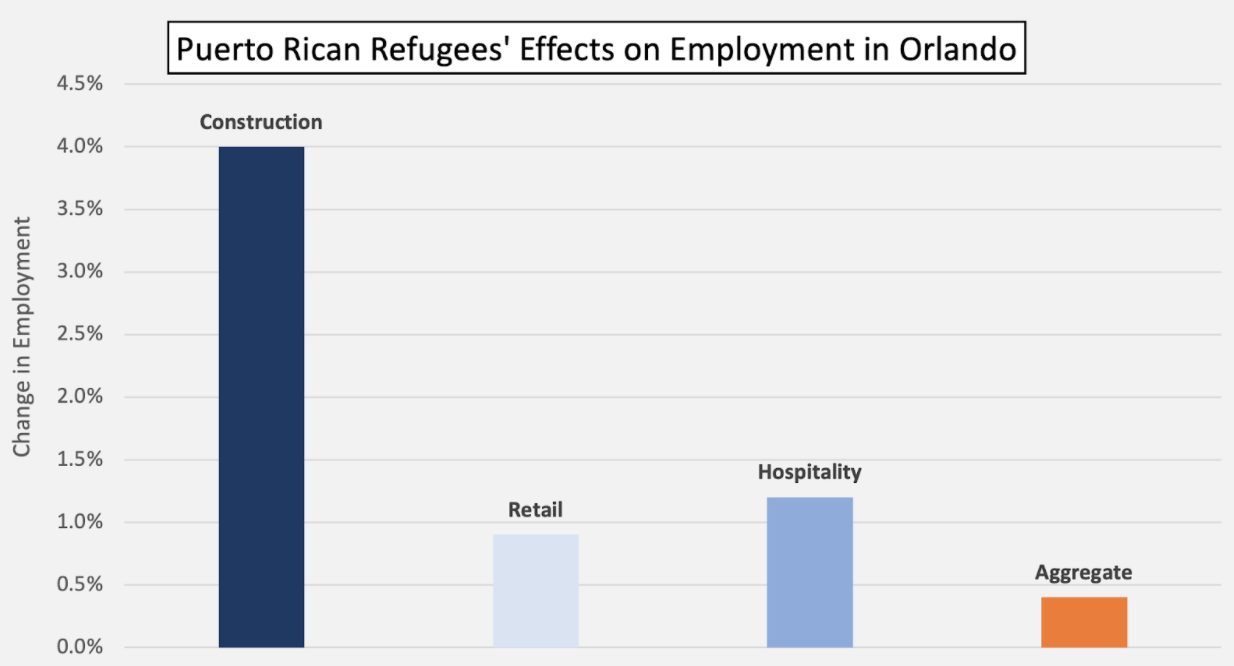
The construction sector experienced the largest and most significant increase in employment, perfectly in line with the idea that this sector received a supply “shock” from the inflow. We estimate a 1.5 percent increase in construction employment 6 months into the treated period, although this estimate is not quite significant at the 10 percent level using our most conservative p-value calculation. Our estimated treatment effect 12 months into the treated period, however, corresponds to 4 percent increase in construction employment and is highly significant (RMSPE p-value of 0.01). This growth in construction employment would account for a full 80 percent of the employed refugees if their age and employment patterns were similar to those of the Puerto Ricans who preceded them. Retail and hospitality employment show a more modest treatment effect equal to about 1 percent of their employment. We have argued above that the construction sector was most likely to absorb the immigrants, many of whom were unlikely to be fluent in English.
The retail and hospitality sectors, on the other hand, were much more likely to be affected by this migration event through increased demand for consumer goods and services, which could translate to increased labor demand. Looking at the retail sector, employment did significantly increase—slowly at first, with a 0.3 percent increase seen after 6 months (RMSPE p-value of 0.04) and then a 0.9 percent increase seen after 12 months (RMSPE p-value of 0.06). We also estimate a 1.2 percent increase in hospitality sector employment 12 months after treatment, though here significance is only seen using the Andrews and moving block p-values (0.02 and 0.05, respectively).
To visualize the significance of the treatment effects on aggregate employment in Orlando and on each sector—especially construction—Figure 3 shows the estimated (treatment-synthetic control) gap for Orlando together with the same gap calculated for all of the other (non-treated) commuting zones in the donor pool. As in Figure 1, Panel A is relative to (residualized logarithm of ) aggregate employment, Panel B represents employment in the construction Sector, Panel C employment in retail, and Panel D employment in hospitality. The gaps for the other commuting zones are shown as light grey lines.
Additionally, the dark dashed line shows the gap for Los Angeles—a tourism-based, Latino-dense large metropolitan area that provides a useful reference.29L.A. and some surrounding CZs, along with Reno, NV, and Las Vegas, NV, typically receive substantial weighting in the synthetic controls. See Figure 5 as well as Table A2 in the online Appendix Note that for aggregate and retail employment and, much more clearly, for construction employment, the Orlando-synthetic control gap in the post-hurricane period is in the top part of the grey trajectories, while it is not far from the average in the pre-hurricane period. This means that Orlando had an unusual increase in aggregate and especially construction employment in the post-hurricane period. We also observe a one-month dip in employment in every sector, but especially construction, exactly in September 2017, before the increases occurred. We will show that this was likely the impact of Hurricane Irma, causing a temporary slow-down in economic activity when it hit Orlando. In section D., below, we consider the possible confounding effects of this event and show that our estimates are likely free of associated bias.
Focusing on earnings, the panels of Figure2 show the plots relative to (de-seasonalized, natural logarithm of ) earnings per worker for Orlando relative to synthetic control, and follows a similar structure to Figure 1. The impact on earnings per worker was a combination of the increased labor supply and increased local demand produced by the new arrivals. Our estimates of treatment effects on earnings are reported, 6 and 12 months after the hurricane, in columns (3) and (4) of Table 2. The table also shows the significance of the estimates from each of our three p-values.
Interestingly, in spite of the significant increase in aggregate employment driven by the evacuees inflow, earnings per worker was stable in aggregate over the first 6 and 12 months of treatment. Provided labor demand is not perfectly elastic, this implies that labor demand grew along with labor supply. When looking at the sector level, we do not find any negative treatment effect on earnings per worker in the sectors considered above. In the construction sector, compensation per worker actually grew by 3.3 percent (RMSPE p-value of 0.05). Thus the large increase in the construction-sector workforce did not have a negative effect overall on construction sector earnings per worker. This may have been a mixture of composition effects, as more people became employed with different effects on incumbent workers of different skills, depending on their complementarity and substitutability with evacuees. We investigate this further in the next section.
The hospitality sector, on the other hand, experienced the most significant effect on earnings per worker (according to the RMPSE p-value, and due especially to the particularly good fit in the pre-treatment period). Wages were a significant 1.4 percent higher 12 months after the migration event (RMSPE p-value of 0.03).30We estimate earnings per worker grew by a statistically significant 0.1 percent 6 months after treatment began, but view this estimate as too small to be considered economically significant. The estimated effects on earnings per retail-sector worker are positive but small and not significant. Together with the employment effects on these sectors, these patterns may have emerged because the arrival of the refugees constituted a shock to local demand for consumer goods and services. Employers in the hospitality sector would then have had to raise wages to compete with other sectors to maintain staffing levels as demand increased. While this story is plausible and consistent with the patterns of our estimated treatment effects, our data do not allow us to test it directly. Overall, however, the results suggest a significant labor demand increase, particularly in hospitality and retail, and a labor supply increase in construction that was matched by increased aggregate demand such that aggregate earnings per worker did not decline.
Finally, columns (5) and (6) of Table 2 show the estimated treatment effects on numbers of establishments. In aggregate, the treatment effect on the number of establishments amounted to a positive, though not statistically significant, increase of 0.5 to 0.6 percent. Similarly, for each of our sectors of interest we have positive effects around 1 percent, but no statistical significance. This is suggestive (but not conclusive) evidence that even as quickly as a few months after the arrival of the evacuees, firms may have started to open new local establishments to take advantage of higher labor supply and consumer demand. The noise in the data31There is a notable dip in Orlando establishments in mid-2015 (see, for example, the Orlando trend in Panels B and D of Figure 6) which eliminates our RMPSE p-value significance. If we instead consider the moving block p-value for construction, the treatment effect of around 1% is significant (p-value of 0.06). and the short period of time, however, do not allow us to produce robust and conservative statistically significant results on this outcome.
Overall, Table 2 paints a picture of a significant wave of Puerto Rican evacuees being absorbed into the Orlando labor market, with positive effects on employment and per-worker earnings. The estimates suggests significant positive effects even on employment and earnings per worker in sectors which likely did not absorb these new arrivals as workers, but may have been affected by their demand for goods and services. The employment effects of the labor supply shock were particularly large in the construction sector, which, as argued earlier, was the most likely place for the refugees to find work. The effects of the consumer demand shock were clear increases in retail employment and in hospitality earnings per worker, and possibly in hospitality employment as well. We find no conclusive evidence of significant changes in the numbers of local establishments—though the point estimates are all positive—and thus cannot draw any conclusions about the impact of this migration event on local investment. We find no evidence of displacement or decline in aggregate wages or in sector wages overall.
B. Effects on Non-Hispanic and Less-Educated Workers
One common question addressed in the economics of immigration literature is how migrants impact the wages of natives and of other groups against whom immigrants are thought to compete in the labor market. In order to study this set of questions in our setting, we require data not found in the QCEW, which measure employment and wages of sub-groups of workers in the local economy. We thus turn to the Quarterly Workforce Indicators (QWI), which allow us to view the same labor market outcomes as the QCEW but for various subgroups of workers stratified by ethnicity and educational attainment. Similar to the QCEW data used in our previous analyses, the QWI collects information on employment and wages for each industry and county and offers the same geographical coverage as the QCEW, although all variables are observed at quarterly frequencies. One cost of using the QWI for these analyses is that we lose about 20 percent of our sample when looking one full year after the hurricane, primarily due to issues around data reporting from particular states.
While we are not able to observe nativity of workers directly, we can approximate the group of native workers quite well by focusing on ethnicity. Using ACS data we calculate that, five years prior to the hurricane, 88 percent of “non-Hispanic” workers were “native,” meaning they were born in one of the 50 states in the U.S. We also observe that the overwhelming majority of people from Puerto Rico (99%) identify as Hispanic. Hence the subgroup of non-Hispanic workers serves as a good proxy for natives, and we can be certain that the group will not include the evacuees when observed in the period after the Hurricane.
We thus repeat the analysis performed in the previous section, but using the QWI data and focusing on non-Hispanic workers. The estimates of the treatment effects on log employment (columns (1) and (2)) and on log compensation per worker (columns (3) and (4)), 6 and 12 months after the Hurricane, are presented in Table 3. We do not find any evidence of a negative effect on non-Hispanic employment either in the aggregate nor in any of the sectors we consider. Rather, the point estimates of the employment effects on non-Hispanic workers are positive and, though not statistically significant in our sectoral analyses, they are significant for the aggregate analysis (the construction employment effect of +0.7 percent is significant according to the moving block p-value only). We estimate an increase of 0.8 percent in non-Hispanic employment 12 months after the hurricane. This may represent some “crowding-in” driven by complementarities between immigrants and natives (as in Ottaviano and Peri (2012)). However, given how large this effect is relative to the overall employment increase estimated in the previous section, we should remain cautious when interpreting this result. We also fail to find an effect, either positive or negative, on employment of non-Hispanic workers in the construction, retail, or hospitality sectors. Small positive and non-significant point estimates suggest, again, no crowding-out of non-Hispanic workers.
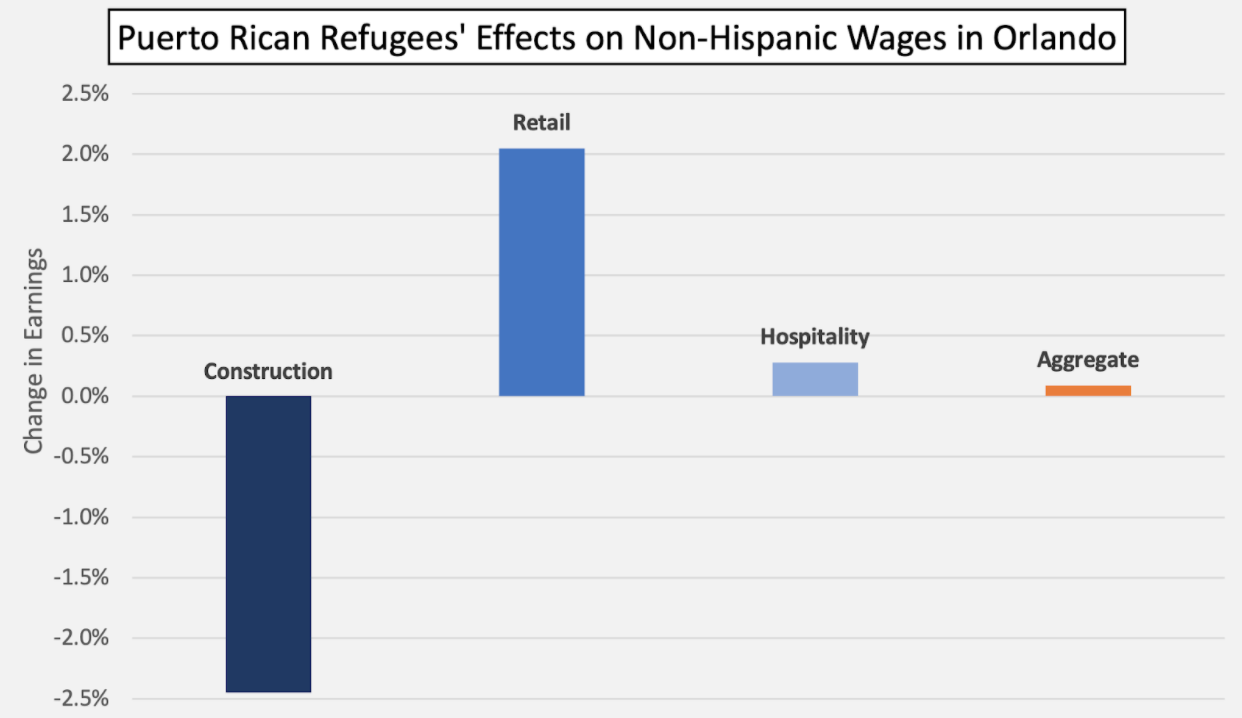
Focusing on earnings per worker of non-Hispanics, we estimate a very small and non-significant increase in the aggregate, both 6 and 12 months after the hurricane. This null aggregate effect seems to average a significant negative 2.5 percent impact on construction and a positive 2 percent impact on retail sector earnings. The retail sector result is not significant according to the RMSPE p-value, but is significant according to the Andrews and moving block p-values (0.07 and 0.00, respectively, identical to those for the construction estimate) reported in Table A3 in the online Appendix. While a short-run decrease in non-Hispanic construction wages of 2.5 percent in response to a 4 percent increase in construction employment is not impossible, and would imply an elasticity of -0.6, which is certainly plausible, the fact that we do not find any effect on aggregate wages for all workers in Table 2 (which include Hispanics, who should experience the strongest competition effect) casts some doubt on this estimate. It seems unlikely that non-Hispanic wages are more responsive than Hispanic wages to competition from Puerto Ricans. In general, however, for non-Hispanics there may have been small negative effects on construction wages and small positive effects on retail wages which balanced out in the non-Hispanic aggregate, and the retail effect would be consistent with a positive labor demand shock.
A second group that is often the focus within the immigration-labor literature are those individuals with a high school degree or less, as their wages have declined in recent decades (Autor et al., 2008) and as competition with immigrants in relatively low-skilled jobs may hurt their opportunities Borjas (2003). This group of workers constituted about 40 percent of the U.S. labor force in 2016. In the retail and hospitality sectors in Orlando, 49 percent of workers had a high school degree or less as of 2016 (the year before Hurricane Maria hit Puerto Rico). In the construction sector this share was 60 percent. We repeat our primary analysis using the QWI data, limited to workers with high school degree or less. As noted earlier, the education levels of workers under age 25 are not observed, meaning this part of our analysis is limited to non-youth workers. Columns (5)–(8) in Table 3 present our results. We find no evidence of a significant impact on overall employment or compensation per worker in this group 6 months after the hurricane.
However, 12 months after the hurricane we see a significant 0.8 percent increase in aggregate employment for this subgroup (p-value of 0.04) and a 1.9 percent, significant decrease in their per-worker earnings. We view this latter result with some skepticism, however, as there is nothing to suggest that aggregate per-worker earnings decreased either for all workers or for non-Hispanic workers, and also because that estimate is not particularly precise. The +1.7 percent effect on construction employment is only significant according to the Andrews and moving block p-values. Interestingly, the wage effects for less-educated workers in specific sectors range from a positive 1.2 percent effect for retail workers32The p-value was 0.02. Positive and significant effects in this sector are already evident 6 months after the hurricane hit. to a 1.5 percent decline in the construction sector (p-value of 0.06). The estimate on hospitality earnings is positive 1.3 percent after 12 months, but this is not even close to significant according to the RMSPE or the Andrews p-values. These results are again consistent with the idea that retail and hospitality received a positive labor demand shock that put upward pressure on their workers’ employment and compensation, while the construction sector received a supply shock which increased employment but possibly reduced wages for incumbent workers.
Putting together the results for all workers (Table 2), and for non-Hispanics and less-educated workers (Table 3), as well as the sector-specific analyses we perform, we are left with three significant findings. First, during the post-hurricane period the large inflow of evacuees from Puerto Rico led to an increase in total employment and also employment of both non-Hispanic and less-educated workers in Orlando. Second, the retail and hospitality sectors experienced not only employment growth, but also positive growth of compensation per worker, both overall and within the non-Hispanic and less educated subgroups (although this last effect was not significant). We see this as clear evidence of a labor demand increase in those sectors, likely as a consequence of new demand for local goods and services from the evacuees. Finally, the construction sector saw the most significant increase in employment due to the evacuees and potentially also due to increases in non-Hispanic and less-educated employment. While this increase in labor supply did not seem to produce a depressive wage effect on the average worker in that sector, it may have hurt the earnings of non-Hispanic and less educated construction workers. We interpret these results as evidence that, even in the very short run, this large inflow of migrants likely had an overall positive impact on native and less-educated workers’ employment and wages, though native and less-educated workers in the sector most heavily exposed to the labor supply shock did face some downward pressure on earnings.
C. Regression-based Estimates
An alternative method to conduct inference, adopted in Peri and Yasenov (2019), is to use the synthetic control method to identify the control units (i.e., those getting positive weight in the distance-minimization problem) and then perform difference-in-differences regression-based estimates considering Orlando as the only treated unit and the other units as control(s). Abadie et al. (2015) note how regression-based estimates implicitly weight the control units in a way similar to how a synthetic control estimator does.33The regression approach, however, does not constrain the weights to be non-negative; thus a regression-based approach allows extrapolation outside the support of the data. Additionally, failing to restrict the sample of donor pool units to match the pre-treatment characteristics of the treated unit (conditional on included covariates) increases the probability that the “parallel trends” condition will be violated. While this method allows a very simple and straightforward check of our estimates and is intuitive, the standard errors may not be quite correct, especially when we consider the “synthetic Orlando” as the only control unit in the regression. Moreover, any simple regression model with a single post-treatment period fails to capture any trend-changes post-treatment. For these reasons, we view our regression-based DD estimates with a deal of caution and only as additional evidence on the qualitative findings of our synthetic control approach.
For each regression-based DD model we consider two ways of constructing the control groups. In Table 4, columns (1) and (2), we include in the control group all commuting zones that are positively weighted in the synthetic control unit. In column (3), we instead only include the constructed synthetic control (the weighted composite) as the “control group.”34Thus the estimates in columns (1) and (2) of Table 4 more likely suffer from bias realized through interpolation and extrapolation, while those in column (3) are free from extrapolation bias and less likely to suffer from interpolation bias. To implement the difference-in-differences estimate, we regress the outcome variable (alternatively [de-seasonalized] log employment, log compensation per worker, and log establishments) on a treatment dummy which equals one for Orlando after September 2017 and zero otherwise, and on time fixed effects (column (1) of Table 4) or on time and unit fixed effects (column (2)). For column (3), where we have only a single treatment and a single control unit, we can include only time effects. In Table 5, instead of one single “post-Hurricane” Orlando treatment dummy, we include an Orlando dummy interacted with each half-year period, both before and after the hurricanes, and estimate against the composite synthetic control (showing results for employment and earnings). This serves to test whether there are deviations from zero in the pre-hurricane period, which would imply non-similar trends between Orlando and the control group. The latter half of 2017 is the period of the “treatment” (when the hurricanes hit Puerto Rico and the migration occurred) and is therefore treated as the reference period in the analysis.
The estimates in Table 4 mostly confirm the synthetic control results. Because the estimates in column (3) are most likely to be free of extrapolation and interpolation bias (see above), we focus primarily on these. First, aggregate employment exhibits a positive and significant treatment effect of 0.3 percent, and the construction sector shows the largest positive employment effect, although now it is only 1.5 percent rather than 4 percent (as this is an average over the entire post-hurricane period). Second, log earnings per worker show extremely small effects, usually non-significant, that vary between positive and negative depending on which control group (column) one chooses. Third, these estimates show significantly positive effects on establishments, especially in aggregate and in the construction sector. In Tables 5 and ?? we show the estimates of the Orlando dummy interacted with each half-year period, showing employment (columns (1)–(4)) and compensation per worker (columns (5)–(8)). The four columns for each outcome variable correspond, left to right, to the aggregate economy, and to the construction, retail, and hospitality sectors. In general, the deviations of Orlando from control, both in employment and per-worker earnings, are small in the pre-hurricane period. However, there are small but significant deviations which may suggest modest negative pre-trends for construction and hospitality employment and for aggregate and hospitality earnings per worker, and possibly a modest positive pre-trend for retail employment. It is also clear that the post-hurricane employment and earnings effects are positive and significant, especially by Q3 of 2018 (one year after the hurricanes). In general the regression results confirm the findings of the synthetic control method and, while they reveal a certain variability of the pre-hurricane differences between Orlando and its control, they do not show systematic and significant departures.
D. Robustness Checks
In addition to our difference-in-differences estimates, we conduct several robustness checks to address three concerns. First, we both use an alternative inference procedure as well as extend the pre-period in our analysis to test the stability of our results. Second, we check whether the impact of Hurricane Irma (which hit Orlando a few weeks before Maria) might have biased our estimates. Finally, we look at housing prices in Orlando to test whether there was a booming real estate market before the migrants arrived which may have driven labor demand in the construction sector. As we show below, our results are robust to each of these tests.
Our alternative hypothesis testing procedure implies that in our RSMPE and relative p-value calculations we correct for possible deviations between treatment and synthetic control at the time of the treatment. Specifically, we define our treatment effects as the difference between observed outcomes and synthetic control outcomes minus that difference in the period immediately prior to treatment. This has essentially the flavor of a difference-in-differences estimator on the treated and synthetic control units. That is, we define  and our alternative estimated treatment effects are then
  . This subtracts from any estimated treatment the gap in , defining the relevant statistic as the change in the gap between and . Using this statistic and evaluating the corresponding p-value (Table A4 in the online Appendix) shows very similar significance levels as with the usual method. This indicates that there was no significant deviation between Orlando and control at the time of the shock.
Our second robustness check extends the length of the pre-treatment period. In our primary specification, the pre-treatment period begins in the first period of 2014 (quarter or month, as appropriate) and continues through to the period immediately prior to the hurricane. The reason we begin in 2014 involves concerns that the impact and duration of the recovery from the Great Recession was heterogeneous across commuting zones and could pollute pre-2014 data. Still, extending the pre-treatment period to the beginning of 2013 helps test the stability of our results. We conduct this robustness check by extending the pre-treatment period to the beginning of 2013, de-seasonalizing the raw data over this period, and then implementing our estimating strategy as before. The results are presented in online Appendix Table A5 and confirm our primary findings from Table 2, showing very similar treatment effects for all variables considered.
We then consider the role of Hurricane Irma, which hit Florida in September 2017, downing trees and power lines and causing other damage (although the damage was much less severe than either Irma or Maria did in Puerto Rico). The immediate local economic impact was almost certainly negative as a result of Irma and is likely captured in the significant dip in Orlando’s employment in September 2017, evident in Figures 1, 2, and 3. It is theoretically possible that the aftermath would yield movement in economic activity in either direction (e.g., Groen et al. (2020)). Damage to infrastructure, for example, could hamper economic activity for months, or there could be a boost to the economy as the result of rebuilding efforts. This motivates our attempt to isolate potential consequences of exposure to Irma. To do this, we consider a large commuting zone which received very few Puerto Rican refugees but which lay approximately the same distance from the path taken by Irma’s eye as did Orlando: Jacksonville, FL.
Compared to the 3,972 relevant FEMA applications filed in Orlando, Jacksonville saw fewer than one-seventeenth (221) relevant FEMA applications. On a per capita basis (around 17 applications per 100,000 population), Jacksonville saw less than a tenth of those seen in Orlando, which saw 178 applications per 100,000 population.35We note this number of applications still disqualified Jacksonville from inclusion in our donor pools for the analyses above. Any robust estimated labor market treatment effect in Jacksonville—particularly in the construction sector, which we view as the most likely to demonstrate any positive post-hurricane impact as a result of reconstruction efforts—is thus much more likely to measure the lingering impact of exposure to Irma rather than the impact of an inflow of Puerto Rican evacuees.
The gap for aggregate employment and for construction employment between treatment and synthetic control for Orlando and Jacksonville, respectively, is shown in Figure 6, Panels A and C (the results are quantified in Table A6 in the online Appendix). The panels also include also the other placebo gaps for all the donor units. Two things clearly emerge from this figures. First, the gaps (vs synthetic control) in Jacksonville experienced very similar dips to those seen in Orlando in September 2017, when both labor markets were directly exposed to Hurricane Irma, both in aggregate employment and in construction sector employment. This confirms the similarity of potential effects of Irma. Second, the employment gaps—both in aggregate and in the construction sector—6 and 12 months after the hurricane hit are significantly larger for Orlando than for Jacksonville. While we observe some ups and down in the gap for construction employment in Jacksonville before and after Irma, we do not see anything comparable to the significant increase in Orlando (which also has more stable paths of gaps in the pre-hurricane period). In Jacksonville the estimated treatment effect on construction employment 12 months after Irma is 2.5 percent, but the RMSPE is quite small (1.01), reflecting the substantial amount of noise in the period before the hurricane relative to the period afterward. The associated RMSPE p-value, at 0.81, makes clear this point estimate is not in any way significant when compared to the associated placebo tests (nearly 81 percent of the placebo runs yielded a larger RMSPE).
Overall, Jacksonville seems a valid counterfactual observation of the impact of Irma on Orlando in the absence of the Puerto Rican migrant inflow. These results show that the one-month dip in employment can be attributed to that event, while the one-year surge in employment in Orlando, especially in construction, should be attributed to the impact of the migrants.36We note that Jacksonville may be less of a good counterfactual for the retail or hospitality sectors because several large retailers started operations here in the treatment period. Amazon opened a distribution center in September 2017 and another in October 2017, both of which were around 1,000,000 square feet, and opened a sorting center in September 2018; Ikea opened a store in November 2017; and Walmart opened a new Supercenter in June 2018 and began hiring in August 2018 for another new store which opened in November 2018. We also plot the results for establishments in Orlando and Jacksonville in Panels B and D. While none of our synthetic control estimates on Orlando establishment numbers were significant, they were all positive (around 1 percent) and these panels demonstrate how the DD estimates (averaged over the whole post-treatment period) were significant. They also show that Jacksonville did not have any apparent establishment response post-Irma, further supporting our claim of no positive bias from Irma in our Orlando estimates.
Finally, to address the possibility that Orlando experienced a housing boom before September 2017, continuing into the treatment period, and whether such a boom might be driving our construction employment results, we conduct two checks. First, in Figure 7 we plot the (log) Zillow Home Value Index of all homes in Orlando and any of the MSAs approximately corresponding to commuting zones which receive positive weights in our construction employment synthetic control unit. We normalize this value to be equal to one in September 2017 for all units and plot the values through May 2020. We see that during the pre- and post-hurricane periods, Orlando’s trend appears to be rather average and is in no way indicative of a housing price boom relative to the control units. We also estimate a difference-in-differences model similar to those mentioned in Section C., using as the outcome the same (log) Zillow Home Value Index but restricting the treatment period through September 2018 for consistency with our 12-month estimates. The regression results confirm the visual inspection and do not show any evidence that Orlando experienced a housing price boom in the periods before or after September 2017. These results give us confidence that there were no secular trends or trend breaks in housing prices in the Orlando area, relative to cities in the construction employment synthetic control, before or around the period of Hurricane Maria. More broadly, the combined results of our robustness checks give us confidence that our estimates reflect the un-confounded causal impacts of the inflow of Puerto Rican migrants.
V. Conclusions
We use various sources, including data from FEMA disaster relief applications, to show that a sudden wave of evacuees from Puerto Rico relocated to Orlando after Hurricane Maria struck in September 2017. This provides a unique opportunity to measure with some precision the short-run impact of a sudden, sizeable increase in predominantly Spanish-speaking labor supply on the local labor market outcomes of Orlando—specifically on aggregate and sector-specific employment and wages for all workers, and also for natives and less-educated workers.
We use the QCEW data aggregated by commuting zone, and implement a synthetic control estimation strategy to measure the impact of these migrant inflows on outcomes in Orlando relative to a synthetic control. We find that overall employment in Orlando increased by 0.4 percent one year after the inflow began, and increased by 4 percent in the construction sector. The quantitative increase in employment compared to the estimated arrival of evacuees is consistent with absorption of this wave with no crowding-out effects, and with a large share finding employment in the construction sector. We also find that, one year after the inflow began, retail-sector employment rose by nearly 1 percent and earnings per worker in the hospitality sector grew by 1.4 percent. We view these as the results of employers responding to growth in local demand for consumer goods and services, which itself resulted from the consumer demand of these new arrivals. These results are broadly robust to a series of checks. We perform additional analysis with the QWI data and find that, when focusing on subgroups like non-Hispanic or less-educated workers, the migration event increased their employment by 0.8 percent with little effect on aggregate earnings per worker for those groups, and with increased earnings for them in the retail sector. We also see a decrease in earnings for likely-native and less-educated workers in the construction sector, which absorbed the majority of the labor supply shock.
Our results37Results can be found in Table A7 of the online Appendix. support a story in which immigration brought both a positive shock in labor supply and a consumer demand shock that spurred greater labor demand in the local economy. Orlando’s construction sector, in particular, was exposed to the labor supply shock, while the retail and hospitality portions of the Orlando economy were primarily exposed to the consumer demand shock. The new workers were fully absorbed by the local economy without displacing native workers and without any significant overall negative effect on earnings, though there was some downward pressure on construction earnings for natives and less-educated workers, specifically. However, retail employment and hospitality earnings were both positively impacted, such that the overall effect on natives was to increase their employment without any clear impact on their earnings.
Appendix
FIG. 1.—Log Employment, Orlando vs Synthetic Orlando.
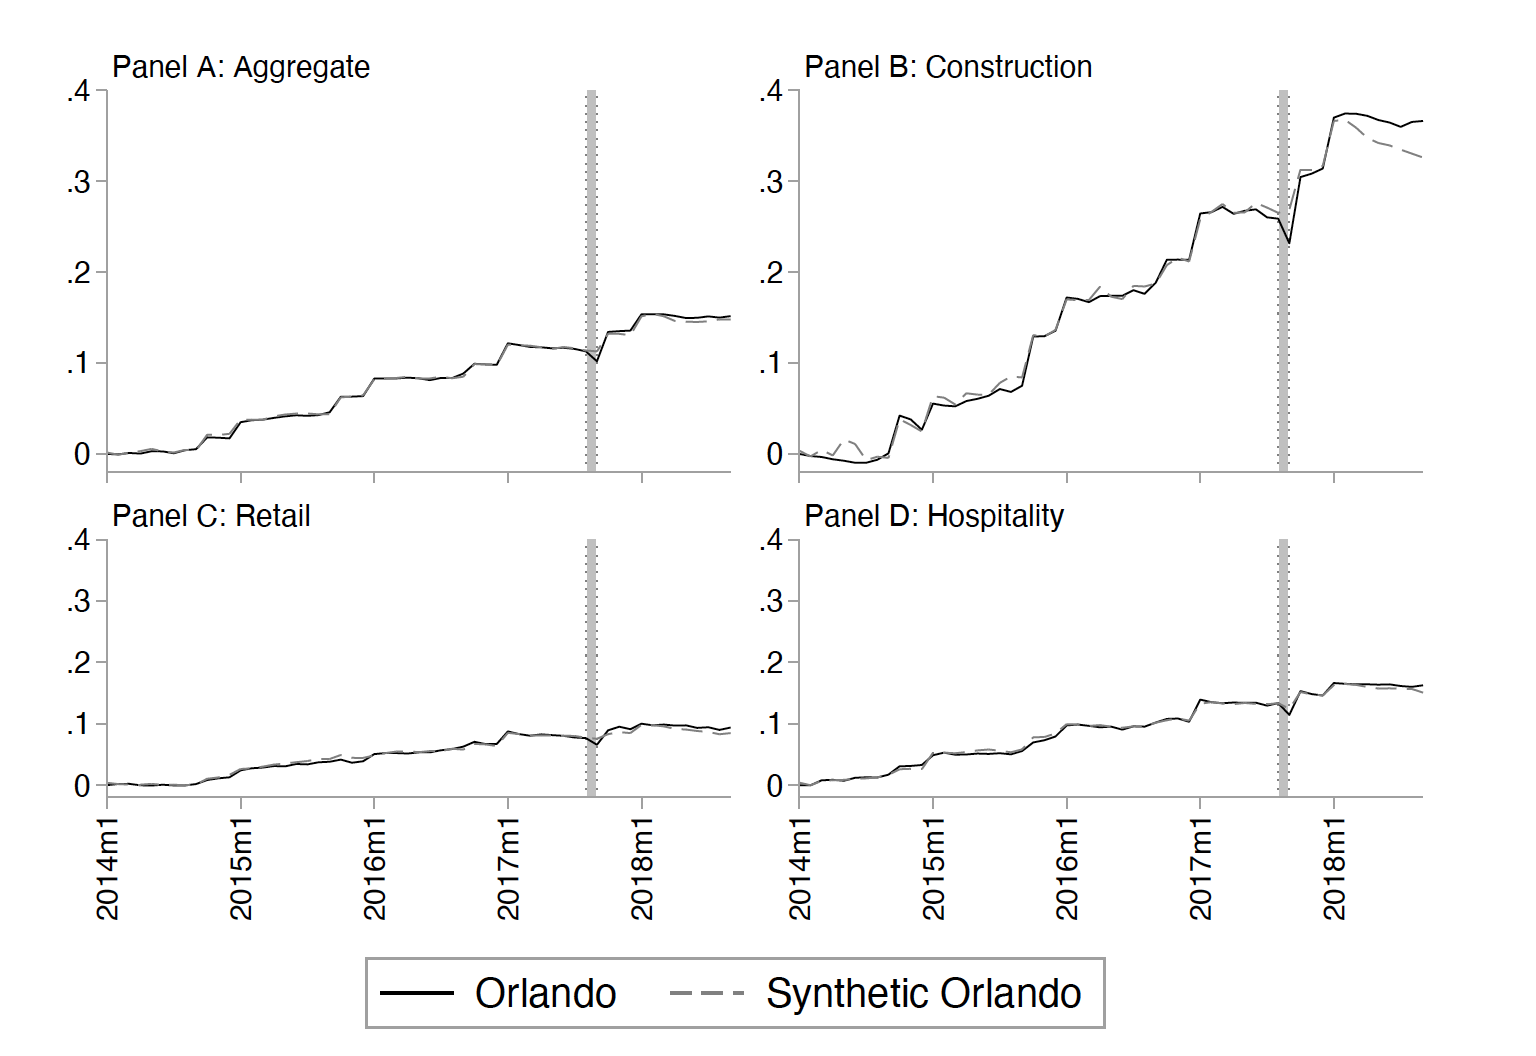
Each panel represents the residualized (after accounting for seasonal component and intercept) logarithm of employment in aggregate (Panel A), in construction (Panel B), retail (Panel C), and hospitality (Panel D) for Orlando and its synthetic control. The data, from the QCEW, are at a monthly frequency. The shaded period is September 2017, when Hurricane Maria hit Puerto Rico.
FIG. 2.—Log Earnings per Worker, Orlando vs Synthetic Control.
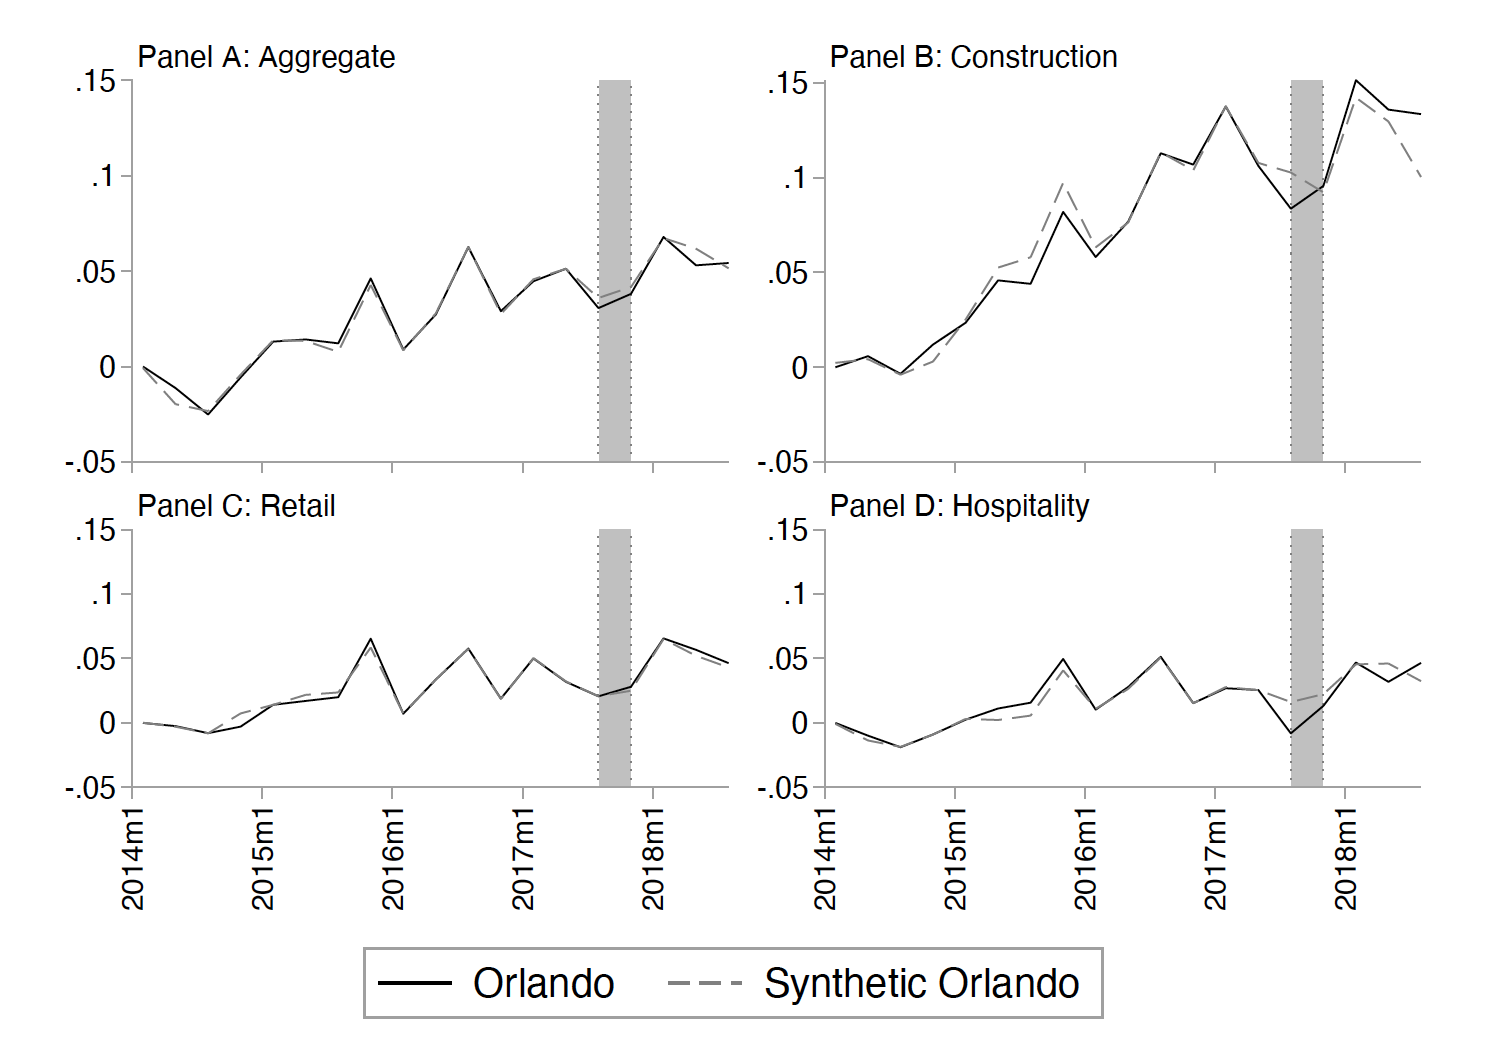
Each panel represents the residualized (after accounting for seasonal component and intercept) logarithm of earnings per worker in aggregate (Panel A), in construction (Panel B), retail (Panel C), and hospitality (Panel D) for Orlando and its synthetic control. The data, from the QCEW, are at quarterly frequency. The shaded period is Q3 2017, when Hurricane Maria hit Puerto Rico.
FIG. 3.—Placebo Test Gaps for Employment, Orlando and Donor Pool.
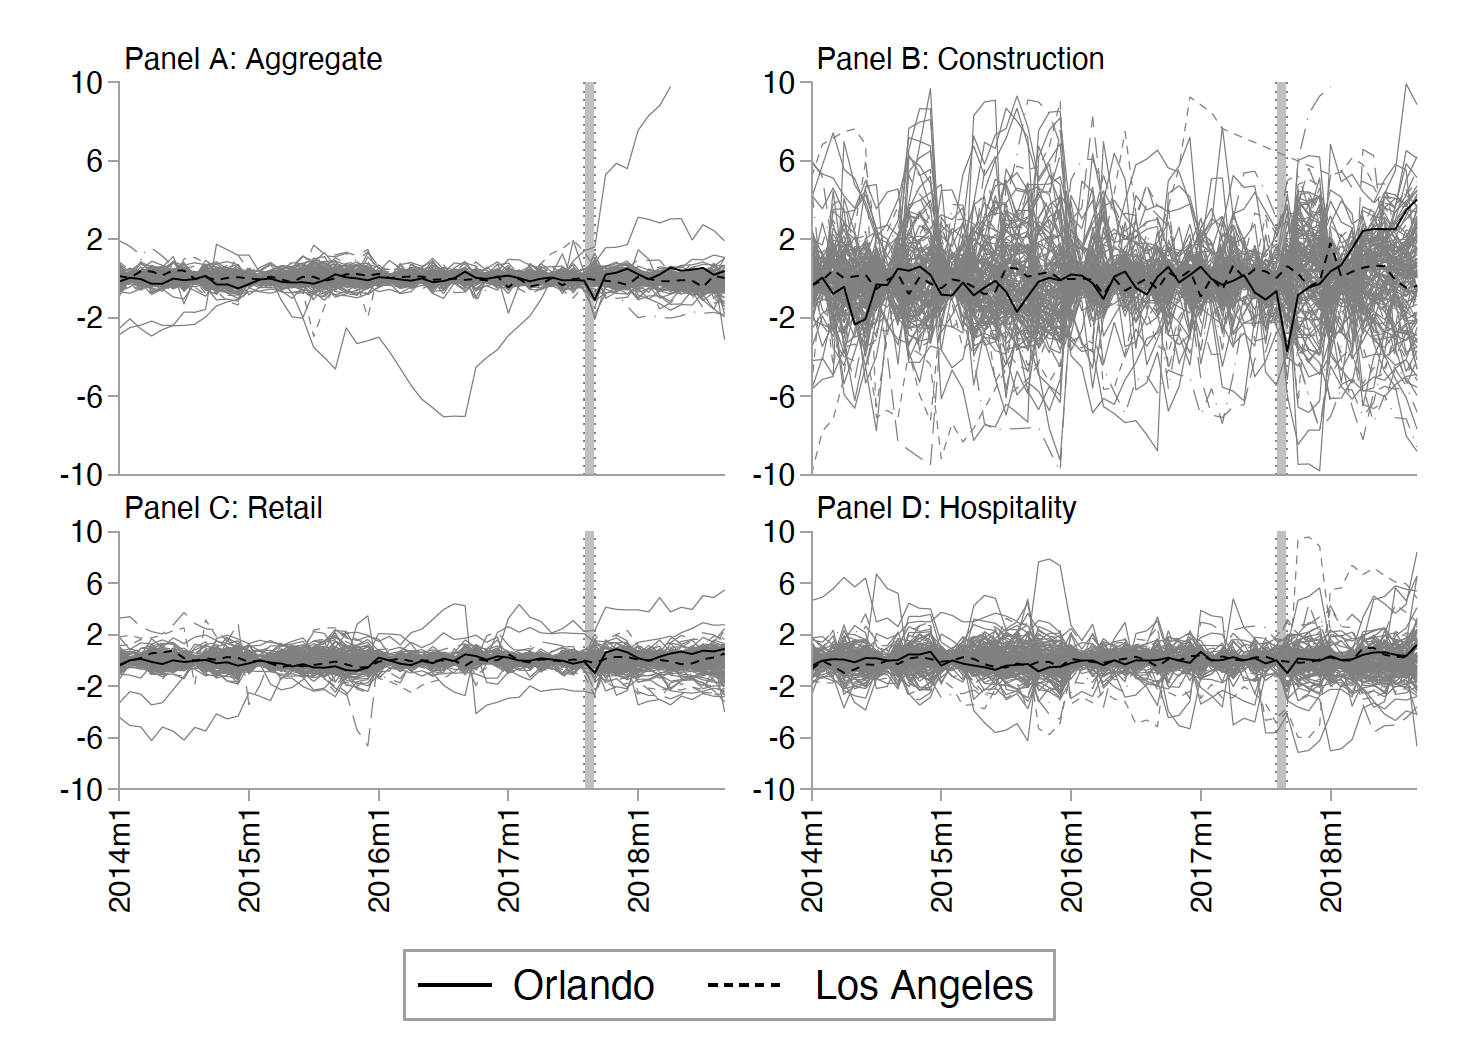
Each panel represents the % gap between the “treated” unit and its control, for Orlando and for each commuting zone in the donor pool (placebo treatments), for each outcome’s synthetic control. The variable plotted is 100× the gap in residualized (after accounting for seasonal component and intercept) logarithm of employment in aggregate (Panel A, N = 165), in construction (Panel B, N = 149), retail (Panel C, N = 170) and hospitality (Panel D, N =148). The data, from the QCEW, are at a monthly frequency. The shaded period is September 2017, when Hurricane Maria hit Puerto Rico. The dark line represents Orlando; the dashed dark line represents Los Angeles.
FIG. 4.—Synthetic Control Donor Pools, by Sector.
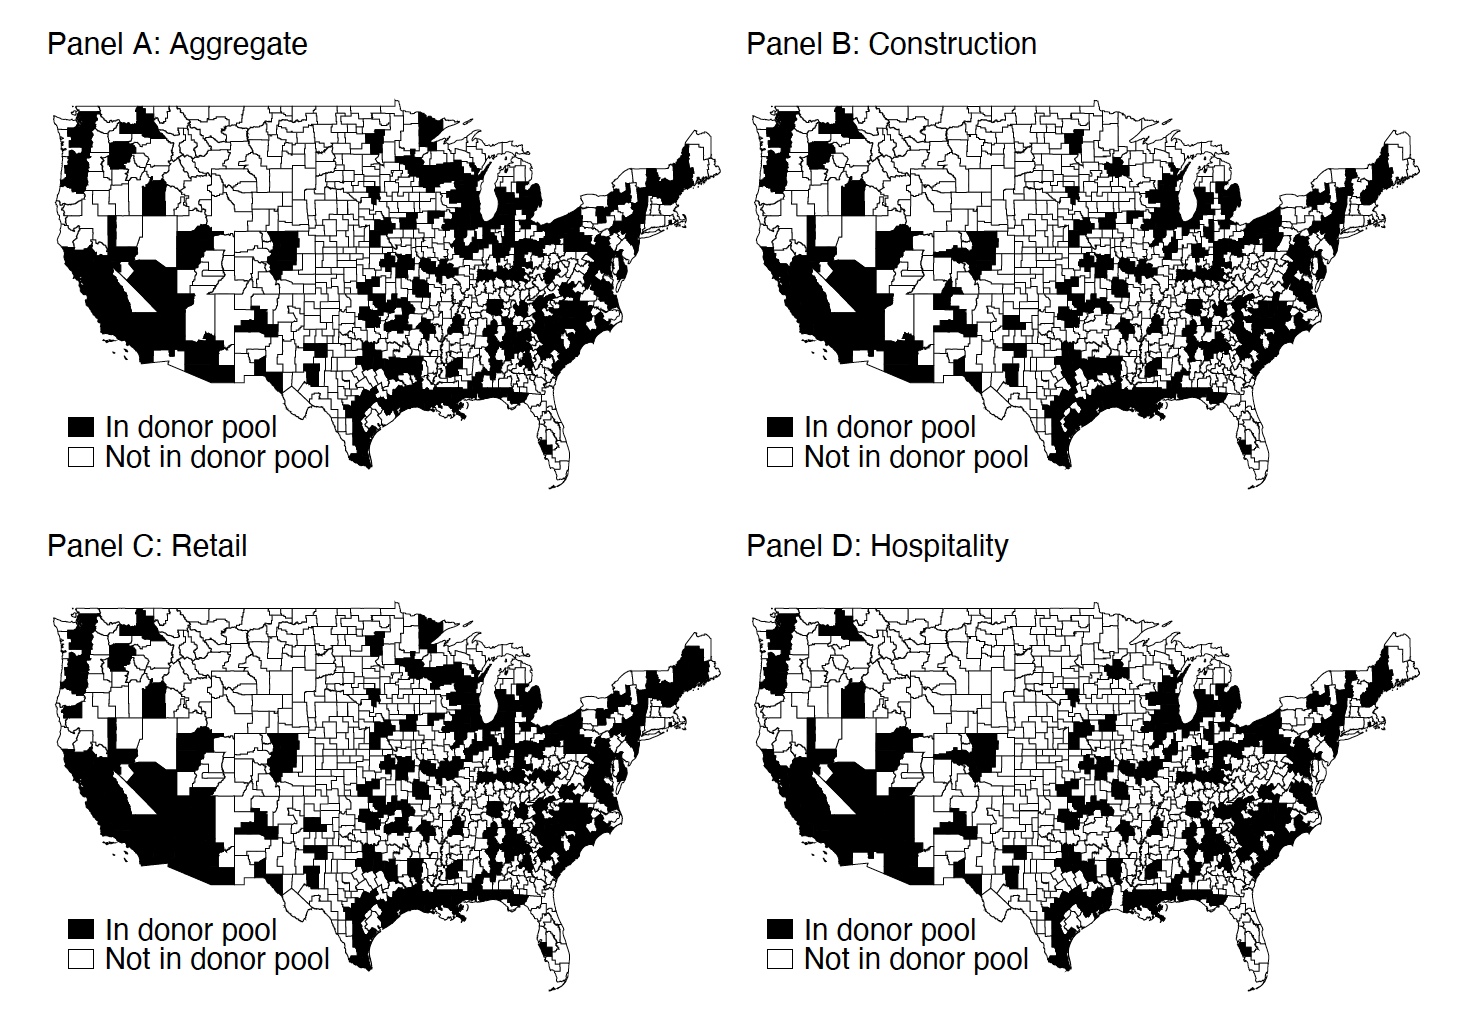
Each panel represents the entire donor pool of commuting zones for the synthetic Orlando, for the indicated outcome. The donor pools are restricted to exclude CZs which received more than .0001 FEMA applications per capita or were below the 75th percentile of industry-specific employment levels.
FIG. 5.—Synthetic Control Donor Pools, by Weight.
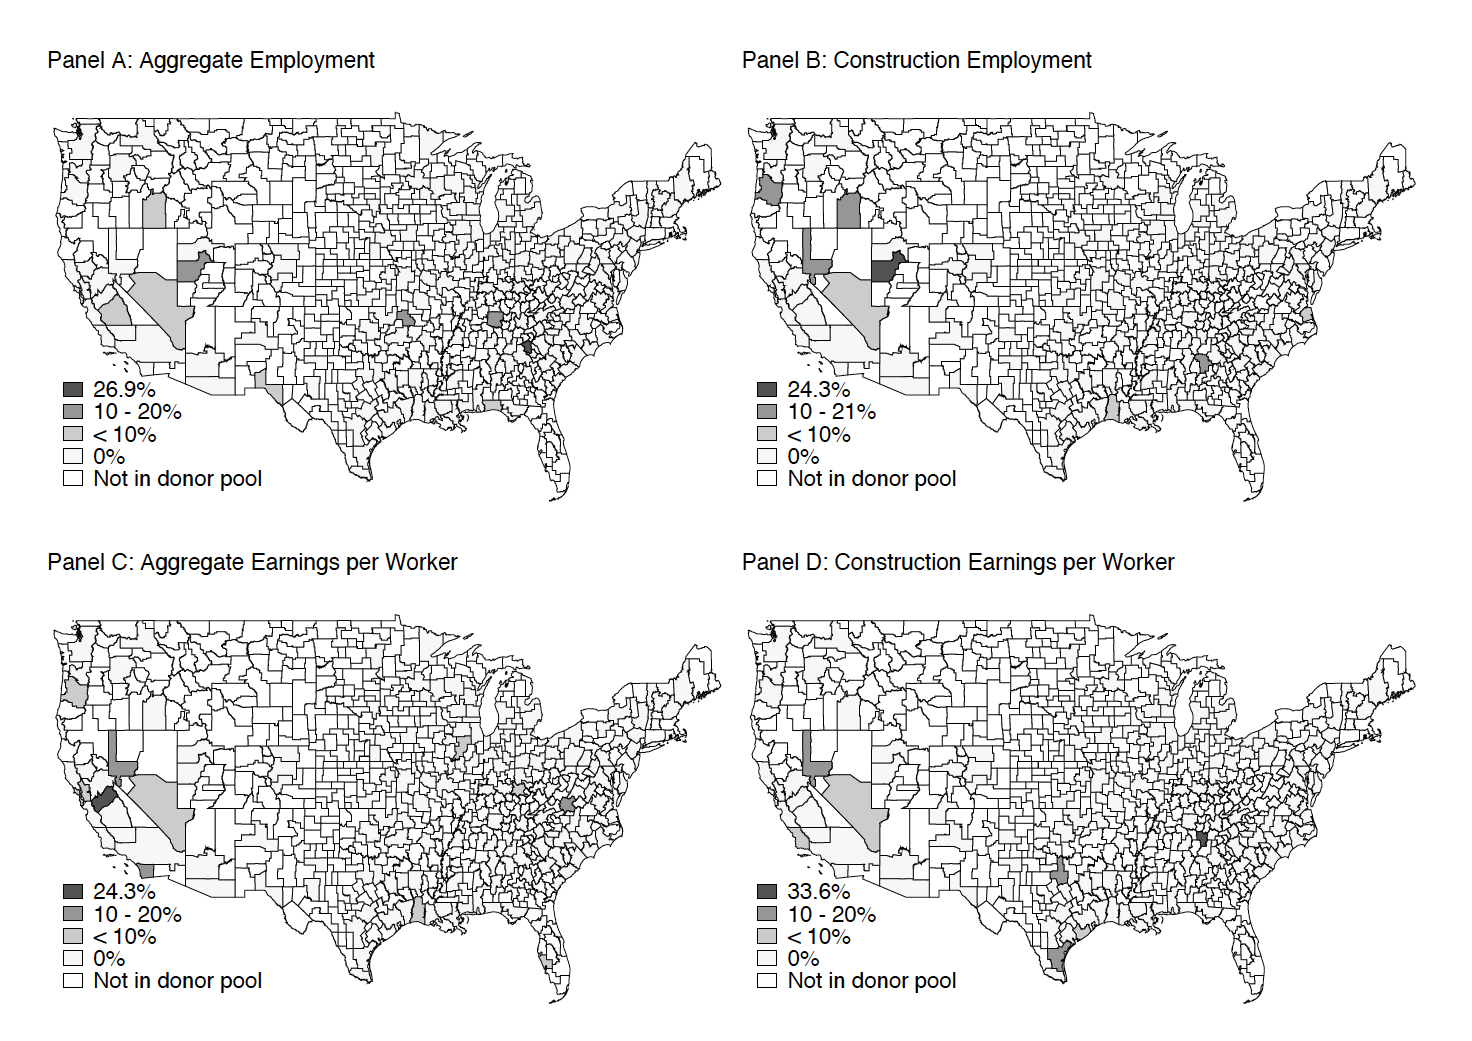
Each panel represents the donor pool of the synthetic Orlando for the indicated outcome by its assigned weight. Shown for aggregate and construction-sector employment and earnings. The data, from the QCEW, are at a monthly frequency for employment and a quarterly frequency for earnings.
FIG. 6.—Test for Impact of Hurricane Irma on Orlando Treating Jacksonville as Counterfactual Orlando.
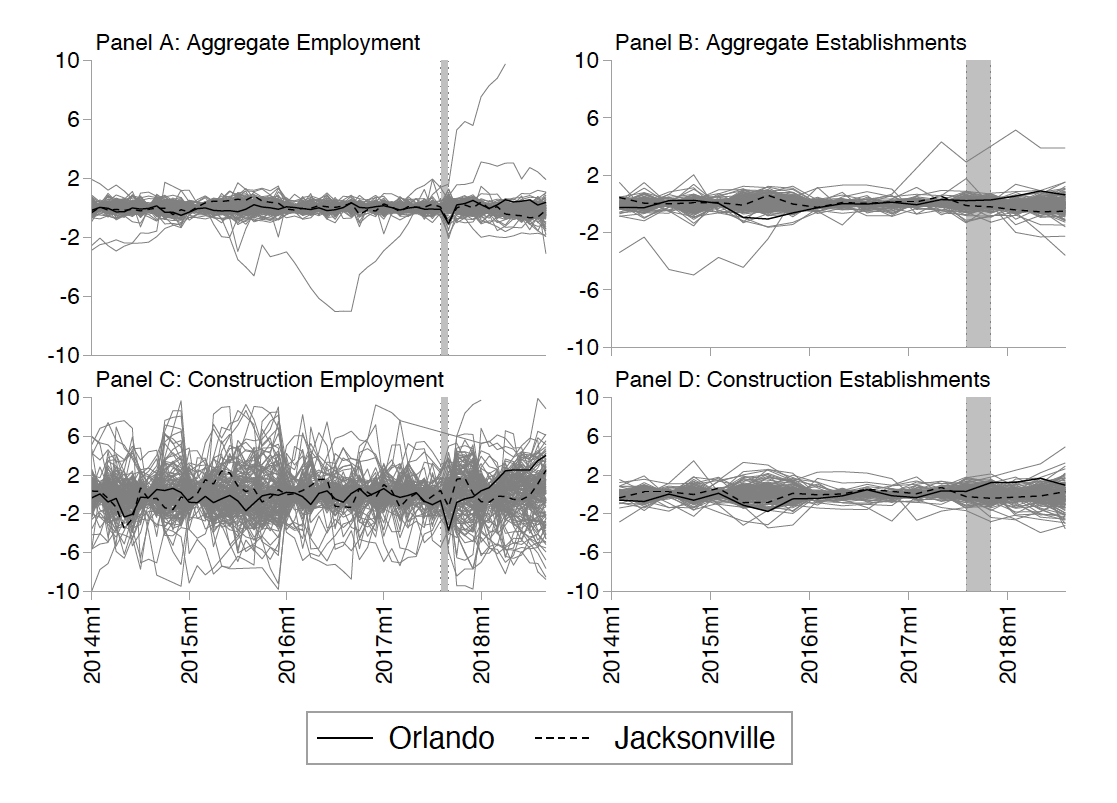
Each panel represents the gap between treated unit and control for Jacksonville and for each commuting zone in the Jacksonville donor pool, for each outcome’s synthetic Jacksonville. The gap for Orlando vs the outcome’s synthetic Orlando is also plotted for comparison. The variable plotted is the gap in residualized (after accounting for seasonal component and intercept) logarithm of aggregate employment (Panel A), aggregate establishments (Panel B), construction employment (Panel C) and construction establishments (Panel D). The data, from the QCEW, are at a monthly frequency for employment and a quarterly frequency for establishments. The shaded period is September 2017 for employment and Q3 2017 for establishments, when Hurricane Maria hit Puerto Rico and Hurricane Irma hit both Orlando and Jacksonville at the same strength and approximately the same distance from its eye. The dark line represents Orlando; the dashed dark line represents Jacksonville. Because Jacksonville’s exposure to Irma was comparable to Orlando’s, and because Jacksonville did not receive a notable number of Puerto Rican FEMA applications related to Irma or Maria, any significant and robust post-Irma effects seen in Jacksonville may represent the impact of Irma on Orlando, which would confound our estimates of the impact of the Puerto Rican migrants.
FIG. 7.—House Prices, Orlando and Synthetic Control Donors.
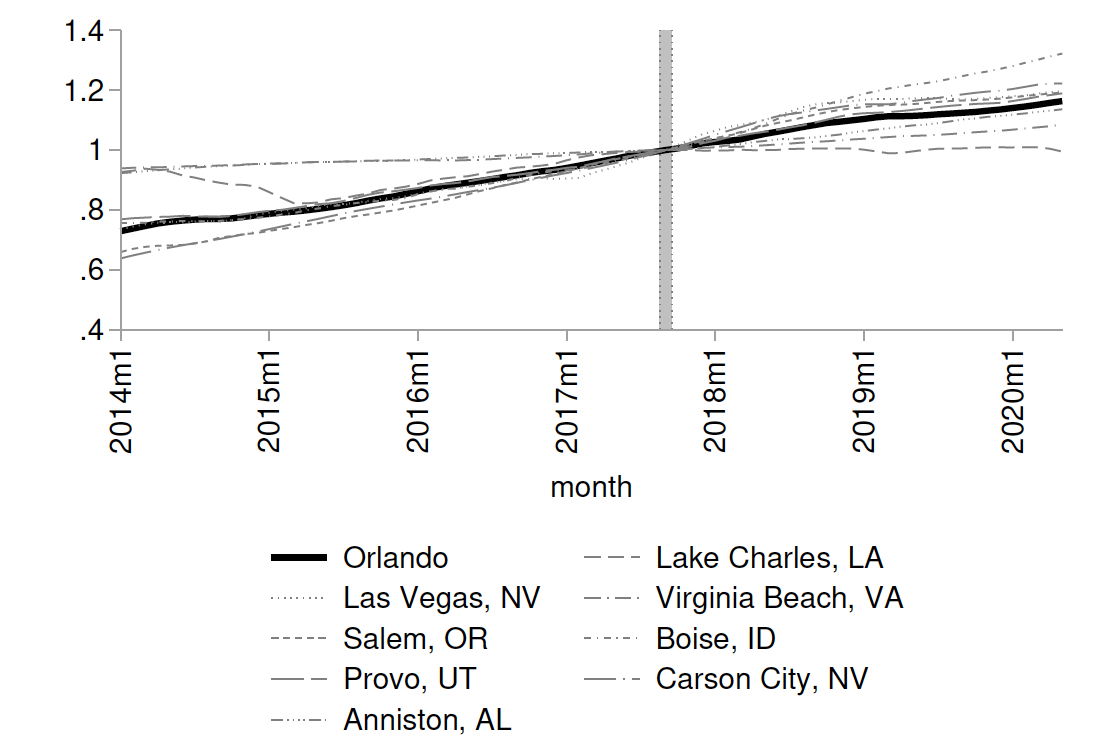
The lines plot (the natural logarithm of) the Zillow Home Value Index for Orlando and each of the positively weighted MSAs corresponding to the CZs for the construction sector employment synthetic control (normed to September 2017). The synthetic control weights by commuting zone for construction employment are listed in online Appendix Table A2.
Table 1. Difference in Means, Recent Puerto Rican Migrants vs Comparators
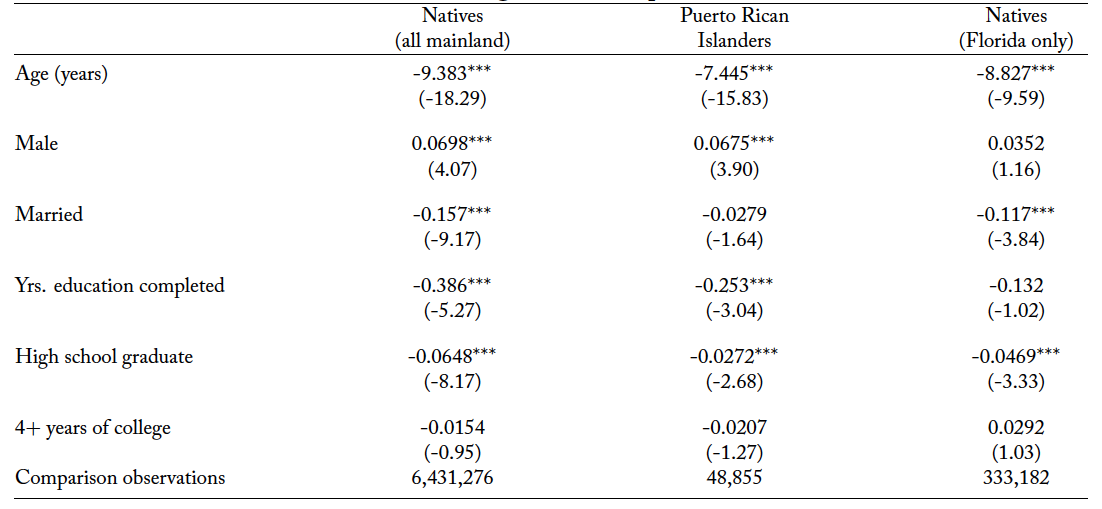
NOTE.—Analysis using data from the 2016 ACS five year sample. All results are for recipients that are in the labor force. t statistics in parentheses. ∗ Significance at the 10% level; ∗∗ significance at the 5% level; ∗∗∗ significance at the 1% level.
Table 2. Estimated Treatment Effects, All Workers
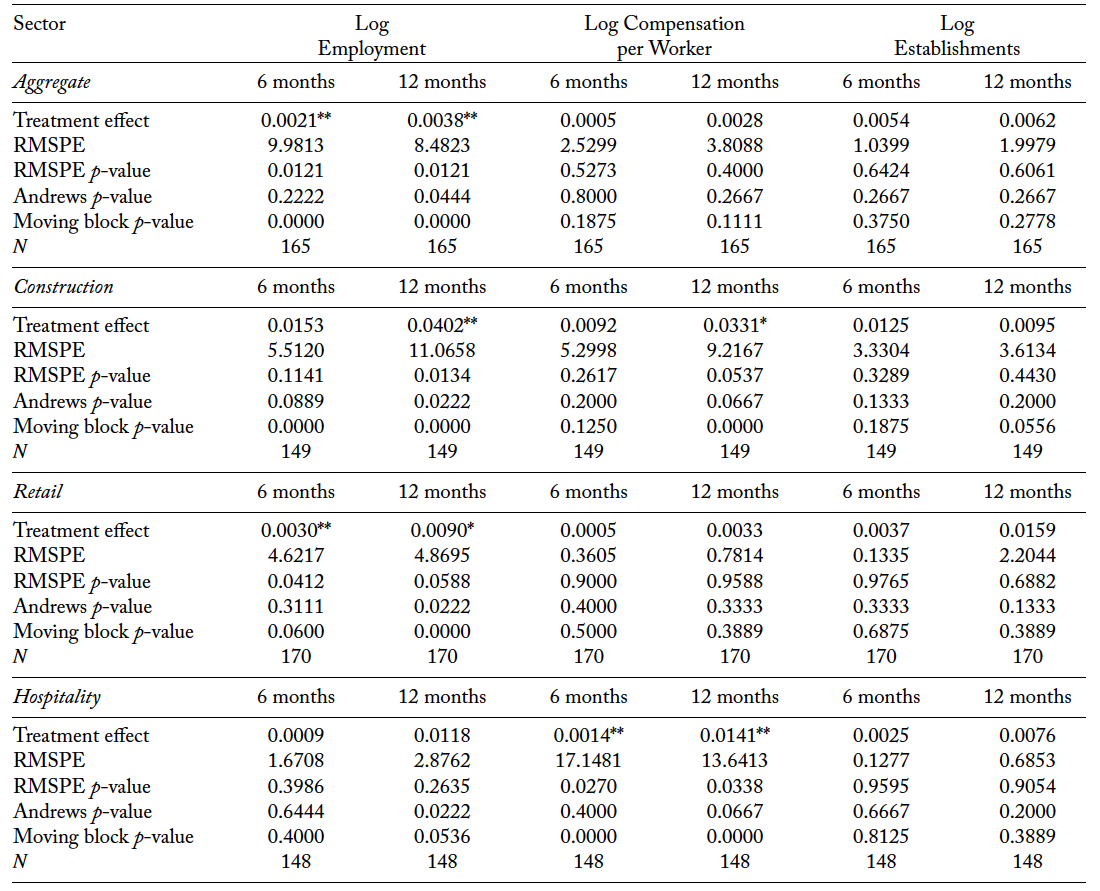
NOTE.—Synthetic control estimates of the impact of the immigration inflow on the residualized (after accounting for seasonal component and intercept) logarithms of the indicated outcomes in Orlando (6 and 12 months after Hurricane Maria hit Puerto Rico), using data from the QCEW, unrestricted donor pool. Significance based on RMSPE p-values: ∗ significance at the 10% level; ∗∗ significance at the 5% level; ∗∗∗ significance at the 1% level.
Table 3. Estimated Treatment Effects, Non-Hispanic and Less-Educated Workers
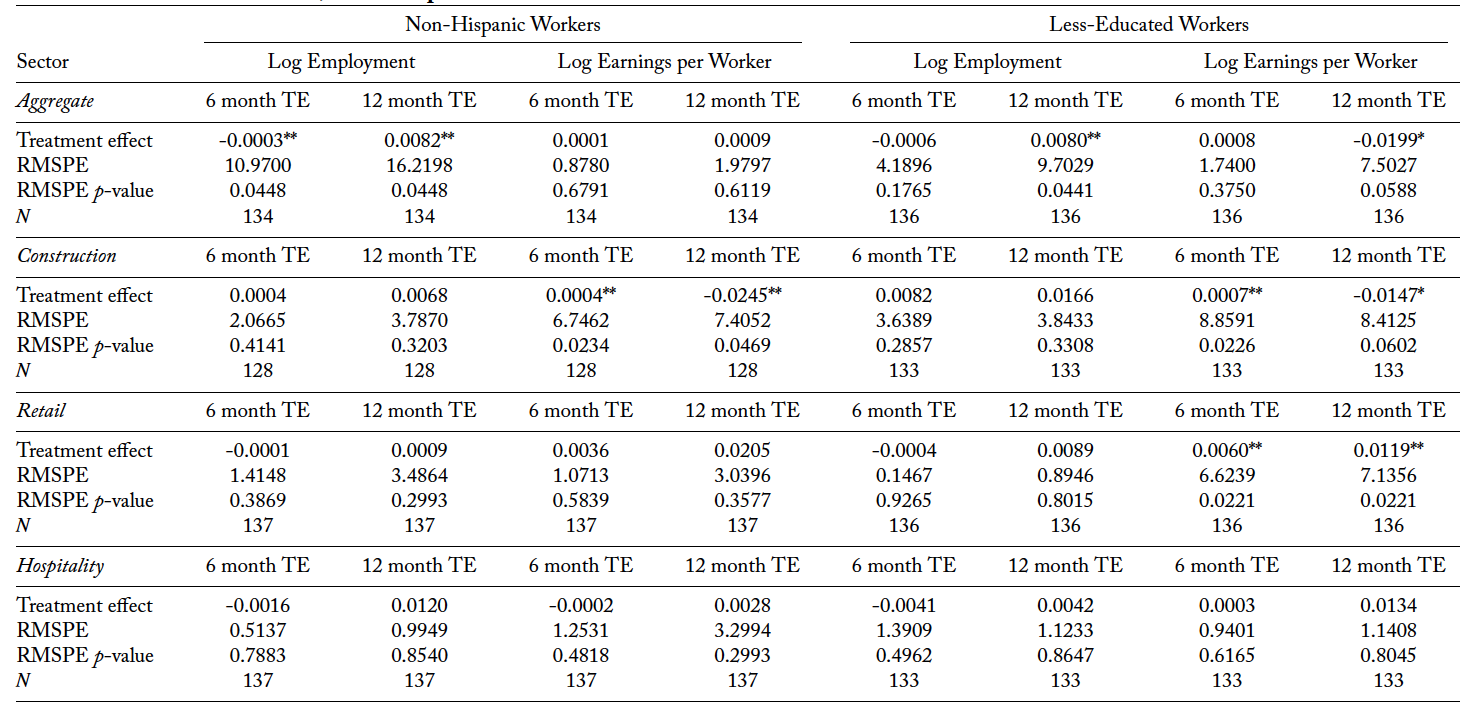
NOTE.—Synthetic control estimates of the impact of the immigration inflow on the residualized (after accounting for seasonal component and intercept) logarithms of the indicated outcomes in Orlando (6 and 12 months after Hurricane Maria hit Puerto Rico), using data from the QWI. Columns (1)–(4) show estimates for non-Hispanic workers. Columns (5)–(8) show estimates for less-educated workers. The donor pool is restricted to include only those commuting zones which are observed for four quarters after the Hurricane, allowing 12-month estimates of the treatment effects. Significance based on RMSPE p-values: ∗ significance at the 10% level; ∗∗ significance at the 5% level; ∗∗∗ significance at the 1% level.
Table 4. DD Estimated TEs of Hurricane Maria on Orlando
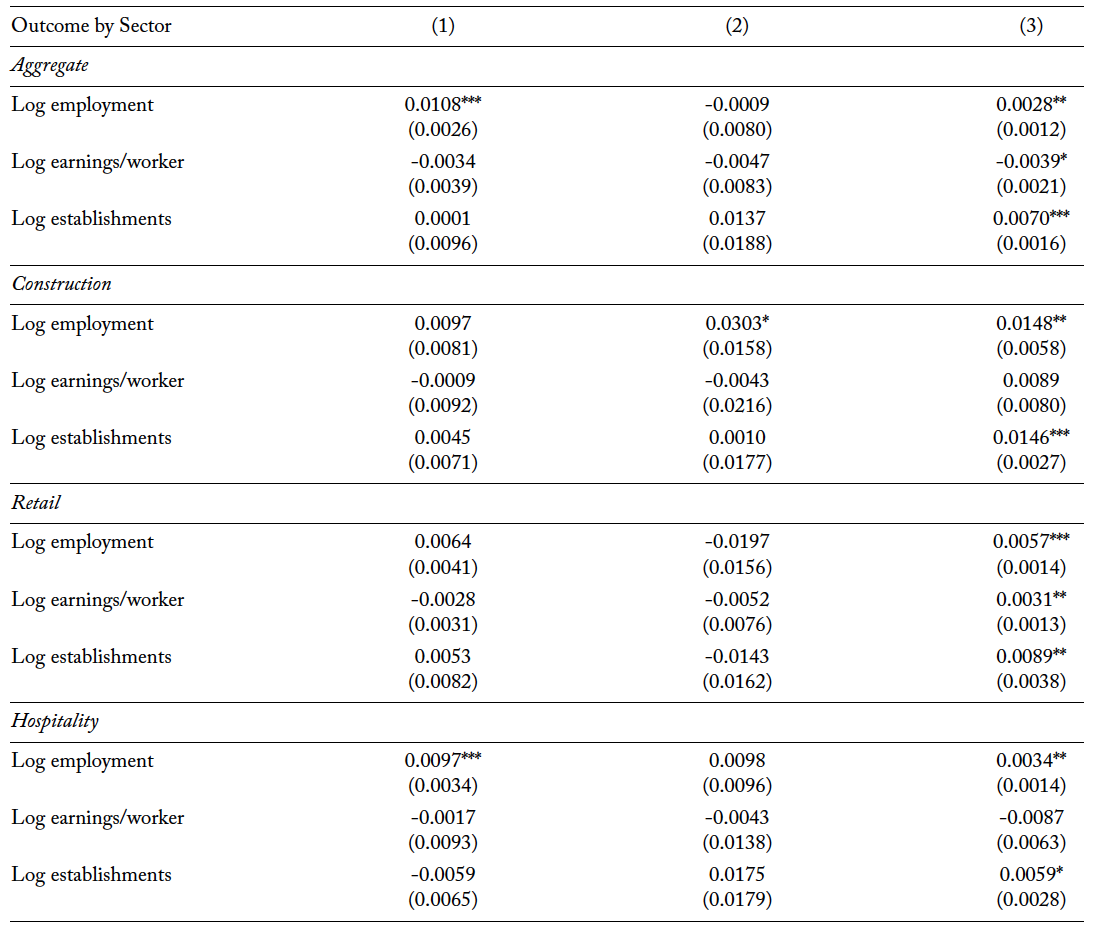
NOTE.—Difference-in-differences estimates of the impact of the immigration inflow on the residualized (after accounting for seasonal component and intercept) logarithms of the indicated outcomes in Orlando, in the post-treatment period, relative to the pre-treatment period. Estimated using the QCEW data. All positively-weighted CZs in the synthetic Orlando are individually included as controls in (1) and (2), and the composite synthetic Orlando for each outcome is the only control unit in (3). Authors own analysis using the QCEW. Robust standard errors in parentheses. ∗ Significance at the 10% level; ∗∗ significance at the 5% level; ∗∗∗ significance at the 1% level.
Table 5. Difference-in-Differences Pre-Trend Tests
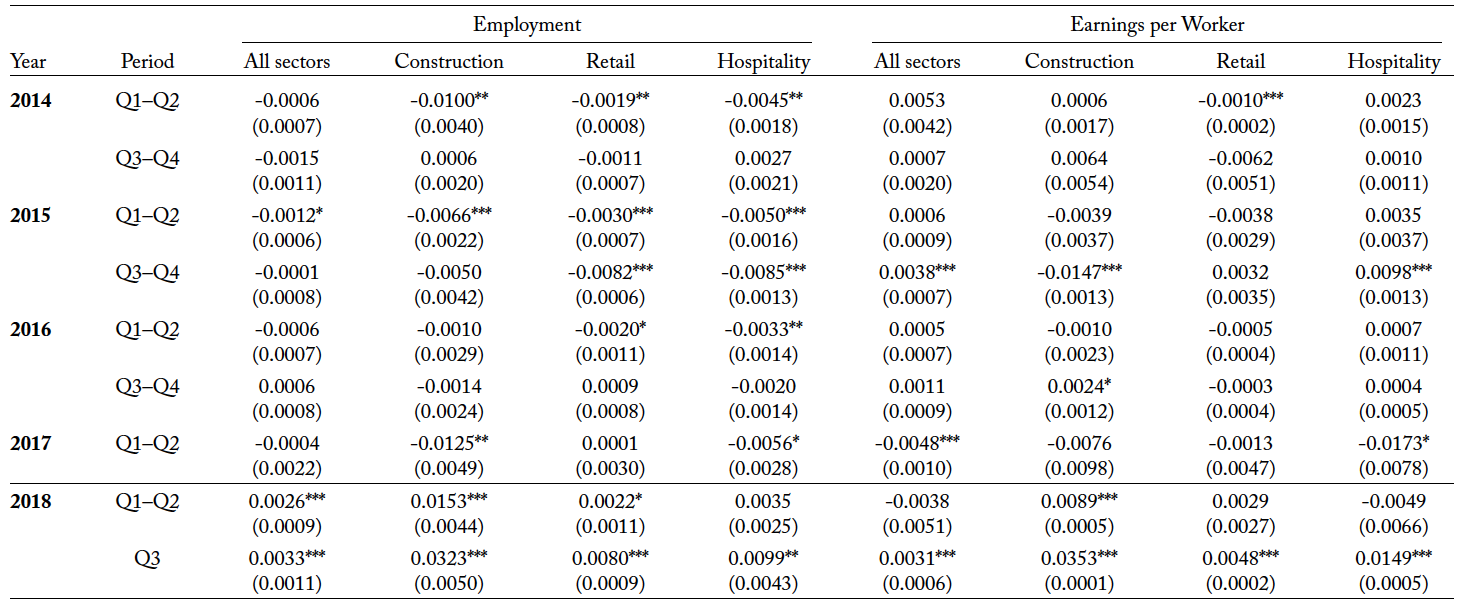
NOTE.—Difference-in-differences estimates of the impact of the immigration inflow on the residualized (after accounting for seasonal component and intercept) logarithms of the indicated outcomes in Orlando, on two-quarter periods, relative to the last half of 2017 (when the hurricanes hit and the migration from Puerto Rico to Orlando occurred). Columns (1)–(4) show estimates for the employment. Columns (5)–(8) show estimates for per-worker earnings. Estimated using the QCEW data with the synthetic Orlando for each outcome as the only control unit. Robust standard errors in parentheses. ∗ Significance at the 10% level; ∗∗ significance at the 5% level; ∗∗∗ significance at the 1% level.
References
Abadie, A. and J. L’Hour. 2019. A Penalized Synthetic Control Estimator for Disaggregated Data. Working Paper.
Abadie, Alberto. Forthcoming. Using Synthetic Controls: Feasibility, Data Requirements, and Methodological Aspects. Journal of Economic Literature.
Abadie, Alberto, Alexis Diamond, and Jens Hainmueller. 2010. Synthetic Control Methods for Comparative Case Studies: Estimating the Effect of California’s Tobacco Control Program. Journal of the American Statistical Association 105 (490):493–505. ———. 2011. SYNTH: Stata Module to Implement Synthetic Control Methods for Comparative Case Studies. Statistical Software Components S457334 . ———. 2015. Comparative Politics and the Synthetic Control Method. American Journal of Political Science 59 (2):495–510.
Abadie, Alberto and Javier Gardeazabal. 2003. The Economic Costs of Conflict: A Case Study of the Basque Country. American Economic Review 93 (1):113–132.
Alexander, Monica, Emilio Zagheni, and Kivan Polimis. 2019. The Impact of Hurricane Maria on Out-Migration from Puerto Rico: Evidence from Facebook Data. Working Paper, arXiv.
Andrews, Donald W.K. 2003. End-of-Sample Instability Tests. Econometrica 71 (6):1661–1694.
Autor, David H. and David Dorn. 2013. The Growth of Low-Skill Service Jobs and the Polarization of the US Labor Market. American Economic Review 103 (5):1553–97.
Autor, David H., David Dorn, and Gordon H. Hanson. 2013. The China Syndrome: Local Labor Market Effects of Import Competition in the United States. American Economic Review 103 (6):2121–2168.
Autor, David H., Lawrence F. Katz, and Melissa S. Kearney. 2008. Trends in US Wage Inequality: Revising the Revisionists. Review of Economics and Statistics 90 (2):300–323.
Beerli, Andreas, Jan Ruffner, Michael Siegenthaler, and Giovanni Peri. 2018. The Abolition of Immigration Restrictions and the Performance of Firms and Workers: Evidence from Switzerland. Working Paper, National Bureau of Economic Research.
Ben-Michael, Eli, Avi Feller, and Jesse Rothstein. 2019. Synthetic Controls and Weighted Event Studies with Staggered Adoption. Working Paper, arXiv:1912.03290.
Bodvarsson, Örn B., Hendrik F. Van den Berg, and Joshua J Lewer. 2008. Measuring Immigration’s Effects on Labor Demand: A Reexamination of the Mariel Boatlift. Labour Economics 15 (4):560–574.
Borjas, George J. 2003. The Labor Demand Curve Is Downward Sloping: Reexamining the Impact of Immigration on the Labor Market. Quarterly Journal of Economics 118 (4):1335–1374. ———. 2008. Labor Outflows and Labor Inflows in Puerto Rico. Journal of Human Capital 2 (1):32–68. ———. 2017. The Wage Impact of the Marielitos: A Reappraisal. ILR Review 70 (5):1077–1110.
Bureau of Labor Statistics. 2015. Hispanics and Latinos in Industries and Occupations. https://www.bls.gov/opub/ted/2015/hispanics-and-latinos-in-industries-and-occupations.htm.
Cao, Jianfei and Connor Dowd. 2019. Estimation and Inference for Synthetic Control Methods with Spillover Effects. Working Paper, arXiv:1902.07343.
Card, David. 1990. The Impact of the Mariel Boatlift on the Miami Labor Market. ILR Review 43 (2):245–257.
Cavallo, Eduardo, Sebastian Galiani, Ilan Noy, and Juan Pantano. 2013. Catastrophic Natural Disasters and Economic Growth. Review of Economics and Statistics 95 (5):1549–1561.
Centro. 2018. New Estimates: 135,000+ Post-Maria Puerto Ricans Relocated to Stateside. Tech. rep., Center for Puerto Rican Studies.
Ceritoglu, Evren, H. Burcu Gurcihan Yunculer, Huzeyfe Torun, and Semih Tumen. 2017. The Impact of Syrian Refugees on Natives’ Labor Market Outcomes in Turkey: Evidence from a Quasi-Experimental Design. IZA Journal of Labor Policy 6 (1):5.
Chernozhukov, Victor, Kaspar Wuthrich, and Yinchu Zhu. 2017. An Exact and Robust Conformal Inference Method for Counterfactual and Synthetic Controls. Working Paper, arXiv:1712.09089.
Clemens, Michael A. and Jennifer Hunt. 2019. The Labor Market Effects of Refugee Waves: Reconciling Conflicting Results. ILR Review 72 (4):818–857.
Cohen-Goldner, Sarit and M. Daniele Paserman. 2011. The Dynamic Impact of Immigration on Natives’ Labor Market Outcomes: Evidence from Israel. European Economic Review 55 (8):1027–1045.
De Silva, Dakshina G., Robert P. McComb, Young-Kyu Moh, Anita R. Schiller, and Andres J. Vargas. 2010. The Effect of Migration on Wages: Evidence from a Natural Experiment. American Economic Review 100 (2):321–26.
Doudchenko, Nikolay and Guido W. Imbens. 2016. Balancing, Regression, Difference-in-Differences and Synthetic Control Methods: A Synthesis. Working Paper, National Bureau of Economic Research.
Ferman, Bruno and Cristine Pinto. 2017. Placebo Tests for Synthetic Controls. Working Paper.
Firpo, Sergio and Vitor Possebom. 2018. Synthetic Control Method: Inference, Sensitivity Analysis and Confidence Sets. Journal of Causal Inference 6 (2).
Groen, Jeffrey A., Mark J. Kutzbach, and Anne E. Polivka. 2020. Storms and Jobs: The Effect of Hurricanes on Individuals’ Employment and Earnings over the Long Term. Journal of Labor Economics 38 (3):653–685.
Grogger, Jeffrey and Gordon H. Hanson. 2011. Income Maximization and the Selection and Sorting of International Migrants. Journal of Development Economics 95 (1):42–57.
Hahn, Jinyong and Ruoyao Shi. 2017. Synthetic Control and Inference. Econometrics 5 (4):52.
Hunt, Jennifer. 1992. The Impact of the 1962 Repatriates from Algeria on the French Labor Market. ILR Review 45 (3):556–572.
Kaul, Ashok, Stefan Klößner, Gregor Pfeifer, and Manuel Schieler. 2015. Synthetic Control Methods: Never Use All Pre-Intervention Outcomes Together with Covariates. Working Paper, MPRA:83790.
Ottaviano, Gianmarco I.P. and Giovanni Peri. 2012. Rethinking the Effect of Immigration on Wages. Journal of the European Economic Association 10 (1):152–197.
Peri, Giovanni and Vasil Yasenov. 2019. The Labor Market Effects of a Refugee Wave: Synthetic Control Method Meets the Mariel Boatlift. Journal of Human Resources 54 (2):267–309.
Rayer, Stefan. 2018. Estimating the Migration of Puerto Ricans to Florida Using Flight Passenger Data. Tech. rep., Bureau of Economics and Business Research.
Tumen, Semih. 2015. The Use of Natural Experiments in Migration Research. IZA World of Labor.
U.S. Census Bureau. 2017. EMPLOYMENT STATUS, 2017 American Community Survey 1-Year Estimates. https://data.census.gov/cedsci/deeplinks?url=https%3A%2F%2Ffactfinder.census.gov% 2Ffaces%2Ftableservices%2Fjsf%2Fpages%2Fproductview.xhtml%3Fpid%3DACS_17_1YR_S2301& prodType=table.
———. 2018. Estimates of the Components of Resident Population Change: April 1, 2010 to July 1, 2018. https://data.census.gov/cedsci/deeplinks?url=https%3A%2F%2Ffactfinder.census.gov%2Ffaces% 2Ftableservices%2Fjsf%2Fpages%2Fproductview.xhtml%3Fpid%3DPEP_2018_PEPTCOMP& prodType=table.
Whalen, Carmen and V. Vazquez-Hernandez. 2005. Puerto Rican Diaspora: Historical Perspectives. Temple University Press.