

1. Introduction
Few policy debates are as hotly contested by politicians as the immigration debate. Beginning in December of 2018, political disagreements in the United States about immigration led to a 35-day government shutdown—the longest in US history. Perhaps not surprisingly, the economics literature has also failed to come to a consensus regarding the economic impact of immigration. Focusing on the wages of native workers, early studies (Altonji and Card 1991; Butcher and Card 1991, LaLonde and Topel 1991; Schoeni 1997) typically find that immigration has little to no effect on wages. However, other studies (Borjas, Freeman, and Katz 1991; Borjas, Katz, and Freeman 1997; Jaeger 1996; Dustmann, Frattini, and Preston 2012; Ottaviano and Peri 2012) show that, when accounting for the endogeneity of geographic immigrant choice and the skill levels of workers, immigration is shown to have a negative effect on native wages.
While much of the existing work on immigration has focused on labor supply issues, less attention has been paid to the link between immigration and firm performance. Olney (2013) shows that firm expansion increases in response to immigration and, as expected, the expansion is driven by smaller, relatively mobile, and highly labor-intensive firms. The argument underlying Olney’s findings are based on the idea that while labor supply shocks should lead to depressed wages and subsequently lower labor costs, it is possible that firms might expand their production activities. In addition to the expansion of firms, Peri and Sparber (2009) argue that different specializations among both native workers and immigrants can lead to production efficiency gains and overall higher labor productivity.1In other related literature, Mitaritonna, Orefice, and Peri (2017) examine the effect of high-skilled immigration and show that firm factor productivity increases in response to this type of immigration, particularly for historically less productive firms and firms of smaller size. Hong and McLaren (2015 ) show that, in general equilibrium, any labor supply shock can be offset by newly created labor demand due to consumer demand by immigrants in local services.
Given this latter stream of literature, firms might benefit from lower labor costs, new expansion opportunities, or productivity gains. The objective of our tests is to examine the unbiased market perception of shocks to the level of immigration. In particular, we test whether the stock prices of firms most likely to employ immigrants, such as agriculture, construction, and manufacturing firms, are meaningfully impacted by two plausibly exogenous events: the signing of the 1990 Immigration Act and the 1999 Temporary Protected Status (TPS) order for immigrants from Nicaragua and Honduras due to the devastation of Hurricane Mitch. Our choice of these two events is based on the following ideas. First, the Immigration Act of 1990 overhauled and modernized much of the Immigration and Nationality Act of 1965. In particular, the Act was written to dramatically increase the number of immigrants allowed into the United States. While the signing of the act itself might not be entirely exogenous to US labor supply issues, a key component of the act established a procedure by which the US attorney general could order protected status to immigrants due to extenuating circumstances in the immigrants’ home country. Along these lines, the signing of the act also granted protected status for nearly 200,000 El Salvadorians because of the Salvadorian Civil War, which is likely to contain the exogeneity required for our tests. The use of our second event—the 1999 TPS order—is also motivated by plausible exogeneity, given that the order was executed in response to the devastation from Hurricane Mitch. Further, the order granted protected status for nearly 90,000 immigrants from Honduras and Nicaragua.22 On November 6, 1986, President Ronald Reagan signed the Immigration Reform and Control Act, which made it illegal to knowingly hire unauthorized immigrant workers. However, the act also legalized most unauthorized immigrants who had arrived in the United States prior to 1982. Our choice of using the 1990 Immigration Act again allows us to analyze the first time in which a temporary protective status order was implemented, particularly for a country from Latin America. The 1999 order was the second time an order allowed protective status for immigrants from a Latin American country. The number of TPS immigrants is available from the U.S. Citizenship and Immigration Services and is found at the https://www.cnn.com/2018/05/04/politics/immigration-tps-honduras/index.html.
Our objective, therefore, is to examine the stock price reaction of firms most affected— both due to labor supply issues and to possible firm expansion opportunities—by the change in these immigration policies. We choose to analyze three types of firms (based on SIC codes): agriculture firms, construction firms, and manufacturing firms. The choice of these firm types is based on various reports that suggest that TPS immigrants typically work in these industries.3According to a May 2017 report by the Center for Migration Research on the El Salvadorian and Honduran immigrants under TPS, Construction (23.0 percent) and Manufacturing (4.0 percent) were two industries among those with the highest concentration of TPS workers. In 2015, New American Economy highlighted the top 10 occupations with the highest share of immigrant workers. Seven of the 10 industries were directly associated with construction, manufacturing, or agriculture. See, New American Economy, “Labor-Intensive Industries,” accessed July 1, 2019, https://www.newamericaneconomy.org/issues/labor-intensive-industries/. Additionally, a recent report by both the Pew Research Center and the USDA suggests that these three types of firms employ the most immigrants.4See, for example, this media report that highlights that agriculture, construction, and production (manufacturing) are ranked among the top three types of firms employing unauthorized immigrants: Mary Jo Dudley, “These US Industries Can’t Work without Illegal Immigrants,” CBS News, January 10, 2019, https://www.cbsnews.com/news/illegal-immigrants-us-jobs-economyfarm-workers-taxes/.
To determine whether the performance of these firms was meaningfully affected by the implementation of these two immigration policies, we conduct a series of standard event-study tests used in the financial economics literature. As described in Fama et al. (1969), an examination of stock prices surrounding a particular event must account for market-wide conditions. Therefore, we estimate a daily market model, which is a regression of daily returns for each firm on market-wide index returns. Following the breadth of literature that documents heterogeneity in stock return premiums across the size of firms (Banz 1981; Fama and French 1992, 1993, 1996), we use the value-weighted index from the Center for Research on Security Prices (CRSP). The CRSP value-weighted index is calculated as the value-weighted average return for all stocks available on CRSP.5CRSP consists of all publicly traded securities that are listed on a major exchange (e.g., the New York Stock Exchange, NASDAQ, or the American Stock Exchange). After estimating the market model for each firm, we obtain daily residual returns, which measure the portion of the firm’s stock return that is orthogonal to market-wide returns. These residual returns, which are denoted as abnormal returns, are summed across various time windows (denoted as cumulative abnormal returns) surrounding both event days.
Results show that cumulative abnormal returns (CARs) are positive and significantly different from zero for a number of different time windows surrounding the Immigration Act of 1990. In economic terms, we find that the average CAR for the three-day window surrounding the act is 0.83 percent in excess of the market. When annualized, this result suggests the treated firms outperformed the market by nearly 70 percent. These estimates suggest that our results are not only statistically significant but are also economically meaningful. When we replicate our analysis surrounding the 1999 TPS order, we find that the average three-day CAR for treated firms is 2.13 percent, which, in annual terms, represents an outperformance of the market of more than 170 percent.
In the remaining portion of the analysis, we seek to determine which types of firms drive the outperformance that we observe in our initial set of tests. In particular, we replicate our analysis by each firm type. Surrounding the Immigration Act of 1990, we find that CARs for both construction firms and manufacturing firms are unusually high, while CARs for agriculture firms are statistically close to zero. When we examine the 1999 TPS order, we find that the unusually high CARs are mostly driven by manufacturing firms.
Recognizing the need to control for other factors, such as firm size, we conduct a series of multivariate tests in which we control for other stock characteristics. After including controls like market capitalization and the volatility of stock prices, we attempt to better isolate which, if any, industry type drives our results. When focusing on CARs surrounding the Immigration Act, we find some evidence that construction firms had larger CARs. In economic terms, our results suggest that, after including our control variables, construction firms have 11-day CARs that are 5.29 percent higher than agriculture firms. Similar results are found for manufacturing firms— although the point estimates are not statistically significant at the 0.10 level. We note that we do not find any distinguishable difference between firm types when three-day CARs are used as the dependent variable. Therefore, we only find weak evidence that construction firms are driving the outperformance that we observe in our initial set of tests surrounding the Immigration Act of 1990.
In our multivariate tests that model CARs surrounding the 1999 TPS order, we find some evidence that, after controlling for various stock characteristics, manufacturing firms have higher CARs. However, our multivariate tests again do not allow us to draw strong conclusions about which firm type drives our results.
Combined, the findings in this study contribute to our understanding about the link between immigration and the performance of firms in several meaningful ways. First, finding that the stock prices of agriculture, construction, and manufacturing firms respond favorably to policies that increase immigration seems to suggest that markets anticipate a measurable benefit associated with immigration. These benefits might include an increase in the labor supply and, thus, lower labor costs and greater firm profitability (Borjas, Freeman, and Katz 1991; Borjas, Katz, and Freeman 1997; Jaeger 1996; Dustmann, Frattini, and Preston 2012; Ottaviano and Peri 2012). Alternatively, the benefits might come from a greater possibility that firms will expand (Olney 2013) and increase in productivity (Peri and Sparbar 2009). Second, our results highlight some of the implications of immigration policy. While from an economic perspective the motive behind anti-immigration policies might be to protect the wages of native workers, the existing literature seems to suggest that both firm productivity and expansion can increase. Our findings suggest that the broader market perception is that immigration is good for firms.
The rest of this paper is formatted in the following way. Section 2 provides some background to the policies discussed in this study and provides a brief review of the related literature. Section 3 describes the data used throughout the analysis. Section 4 presents the empirical methods and results from our analysis. Section 5 offers some concluding remarks.
2. Background and Related Literature
On November 29, 1990, the Immigration Act was signed by George H. W. Bush.6See Leiden and Neal (1990) for a comprehensive overview of the Immigration Act of 1990. The new bill increased the number of visas granted to immigrants from 530,000 per year, to 700,000 per year from 1992 to 1994 and then 675,000 visas per year every year after 1994. The new bill effectively increased the number of visas issued by over 27 percent per year. The Immigration Act also describes in great detail different nuances of issuing visas, such as family-based immigration, employment-based immigration, “diversity” immigration, and so on. As part of the Immigration Act of 1990, Title III had a “Temporary Protected Status” (TPS) clause. The clause grants unauthorized immigrants legal residency in the United States for up to 18 months. The US attorney general must first designate “temporary protected status” to nations that are in the midst of civil conflict, natural disaster, or other extraordinary circumstances that make immigrants’ return unsafe (Leiden and Neal 1990). In order for immigrants to qualify for TPS, they must be continually physically present in the United States following the date of their home country’s TPS designation (Leiden and Neal 1990). These events are particularly interesting to this study because they provide a natural instance from which we can capture immediate market expectations regarding immigration policy. Furthermore, civil conflict and natural disasters in various countries are likely to be exogenous to labor supply issues or other firm performance measures in the United States. Since firms that may be at a higher disposition to hire low-skilled workers would benefit from an increase in the supply of immigrant labor, it would make sense that these policies would positively impact these types of firms.
A number of studies have examined various economic outcomes associated with immigration. As mentioned above, several studies have examined the effect of immigration on the wages of native workers and find conflicting results (Altonji and Card 1991; Butcher and Card 1991; LaLonde and Topel 1991; Schoeni 1997; Borjas, Freeman, and Katz 1991; Borjas, Katz, and Freeman 1997; Jaeger 1996; Dustmann, Frattini, and Preston 2012; Ottaviano and Peri 2012). For instance, Butcher and Card (1991) find that immigration does not reduce the wages of native workers, even when accounting for workers with wages in the lowest decile of the income distribution. Using a different empirical approach, Dustmann, Frattini, and Preston (2012) provide some contradictory evidence that immigration depresses native wages significant but only for those in the bottom quintile of the income distribution. In LaLonde and Topel (1991), results provide some evidence that wages are depressed in response to increases in immigration; however, the depression of wages occurs for the immigrants themselves as opposed to native workers. Ottaviano and Peri (2012) show that while there is a slight substitution effect between the wages of immigrants and the wages of native workers, the wages of previous immigrants are substantially (negatively) affected by the presence of new immigrant workers.
Additional studies have provided more general findings that show that immigration provides an important contribution to the economic activity. For instance, Borjas (1995) shows that the economic benefits associated with immigration range from $7 billion to $25 billion annually. Morley (2006), however, provides some evidence that per capita GDP causes long-run increases in immigration instead of the other way around. Hunt and Gauthier-Loiselle (2010) show that immigration leads to greater levels of innovation in a particular country. In particular, a one percentage point increase in immigration is associated with an increase in the number of patents (per capita) by more than 10 percent. Instead of examining immigration, Clemens (2011) reviews the literature and shows the constraints to emigration adversely effect economic activity. Several studies show that that the efficiency gains from merchandise trade—if emigration constraints are relaxed—would average about 1.7 percent (Goldin, Knudsen, and van der Mensbrugghe 1993; Dessus, Fukasaku, and Safadi 1999; Anderson et al. 2000; World Bank 2001; Anderson and Martin 2005; Hertel and Keeney 2006). Likewise, the efficiency gains associated with capital flows—if emigration constraints were relaxed—are reported to be between 0.1 percent to 1.7 percent of world GDP (Gourinchas and Jeanne 2006; Caselli and Feyrer 2007).7Hamilton and Whalley (1984), Moses and Letnes (2004), Iregui (2005), and Klein and Ventura (2009) also discuss the efficiency gains associated with labor mobility if emigration constraints were relaxed and show large gains from labor mobility. These results highlight some of the economic benefits associated with immigration.
As discussed in the previous section, more specific benefits (outside of wage effects) might come from immigration. In particular, Olney (2013) finds that firms are able to expand their production activities in response to shocks to immigration. When accounting for the possible endogeneity association with immigration and expansion, Olney’s instrumental variable analysis shows that a 10 percent increase in immigration results in a 2.5 percent increase in the number of new establishments, which is used as measure of firm expansion. Peri and Sparbar (2009) use specialized task data to show that, when unskilled immigration increases, specializations of both native workers and immigrants can lead to productivity gains. In a similar vein, Mitaritonna, Orefice, and Peri (2017) report that the immigration of high-skilled workers leads to large improvements in various productivity measures (physical capital, exports, and direct employment). These results are driven by smaller firms and by firms with lower levels of initial productivity. Taken together, these findings highlight that fact that immigration is not only associated with macro-level benefits but might also provide firm-level benefits. In the framework of our study, we hypothesize that, given the prior literature discussed in this section, stock prices will respond favorably to positive shocks in immigration, particularly for firms that are most disposed to hire immigrant labor.
3. Data Description
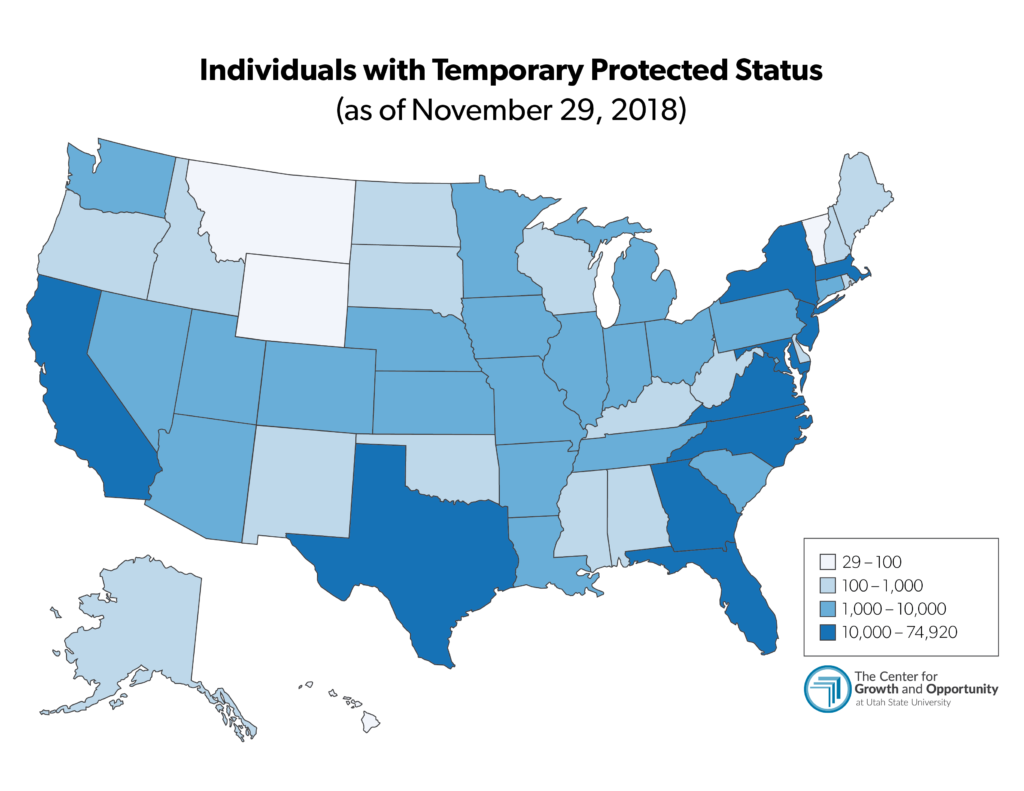
The data used throughout the analysis come from the Center for Research on Security Prices (CRSP). From CRSP, we obtain daily prices, trading volume, stock returns, exchange listing, and so on. We also gather standard industry classification (SIC) codes from CRSP. To determine the most low-skilled firms, we identify Agriculture firms (SIC codes between 0100 and 0999), Construction firms (SIC codes between 1500 and 1799), and Manufacturing firms (SIC codes between 2000 and 3999). As mentioned above, the choice of these firm types is based on various reports about the employment population of TPS immigrants. We have also mentioned the use of our two events: the Immigration Act of 1990 and the TPS order of 1999.8According to 2018 data from the Council on Foreign Relations (https://www.cfr.org/article/what-temporary-protected-status), there have been approximately 400,000 TPS holders, of which 93 percent are from El Salvador (262,526), Honduras (86,031), and Haiti (58,557). AmericanProgress.org reports (https://www.americanprogress.org/issues/immigration/news/2017/10/20/440400/tps-holders-are-integral-members-of-the-u-seconomy-and-society/) that of the current TPS holders, more than 50,000 immigrants live in California while about 47,000 and 45,000 live in Tennessee and Florida, respectively. As mentioned earlier, the USDA provides some statistics regarding the industries in which unauthorized immigrants work. According to CBS News reports, 53 percent of unauthorized immigrants work in agriculture, 15 percent work in construction, and 9 percent work in production (see note 4 above). Both pieces of legislation allowed protective status to a large number of immigrants from Latin American countries.9We note that our hypothesis that stock prices of firms in our sample will increase in response to these orders is based on the idea that the possible pool of workers will increase, which might lower labor costs or increase the likelihood of firm expansion. It is possible, however, that TPS orders might be detrimental to firms by giving bargaining power to immigrant workers who, because of the orders, are now allowed to work legally in the United States. We argue that this possibility is rather small given that the 1986 Immigration Reform and Control Act implemented penalties for hiring unauthorized immigrant workers. The firms that might fear these penalties are larger firms that employ low-skilled workers—specifically, those firms that are publicly traded and thus more heavily scrutinized by the US Securities and Exchange Commission. Table 1 reports a number of statistics that describe our sample. Panel A reports the results for Agriculture firms while panels B and C present the summary statistics for Construction firms and Manufacturing firms, respectively. The statistics on the variables presented in table 1 are measured on the event day. For instance, in columns [1] through [5], the variables are measured on November 29, 1990. Likewise, in columns [6] through [10], the variables are measured on January 5, 1999. MktCap is the market capitalization of a particular firm on the event day (measured in $ billions). Likewise, Price is the daily closing price. Volatility is calculated following Alizadeh, Brandt, and Diebold (2002) and is the difference between the natural log of the intraday high price and the natural log of the intraday low price. Turnover is the ratio of daily volume (on the event day) scaled by shares outstanding. NYSE is an indicator variable capturing whether a firm is listed on the New York Stock Exchange—zero otherwise.
Table 1 provides a few noteworthy results. First, we find that manufacturing firms are much larger than either Agriculture firms or Construction firms. For instance, in column [1], we find that the average Manufacturing firm has a market cap of $610 million while the average Agriculture (Construction) firm has a market cap of $224 million ($118 million). Similarly, in column [6], the average Manufacturing firm has a market cap of $2.05 billion while the average Agriculture (Construction) firm has a market cap of $259 million ($343 million). Table 1 also highlights a difference in share prices and volatility across the different firm types. These results are important given that, in our tests, we will not only identify whether these types of firms exhibit significant abnormal returns surrounding our two events, but we will also seek to determine which of the types of firms are driving the results. The variation in these stock-specific characteristics indicates the need to control for these variables in a multivariate framework when making these comparisons.
4. Empirical Results
In this section, we discuss our empirical methods as well as the results from our tests. We begin by first examining the stock price response of the firms in our sample surrounding the Immigration Act of 1990 and then surrounding the 1999 TPS order. Next, we replicate this analysis by firm type. Specifically, we attempt to determine which type of firm (Agriculture, Construction, or Manufacturing) drives our results. Lastly, given the variation in firm characteristics across samples as highlighted in table 1, we conduct a series of multivariate tests to compare the stock price response to the changes in these immigration policies by firm type.
4.1. Cumulative Abnormal Returns – All Firm Types
We begin by estimating cumulative abnormal returns (CARs) in the standard way, as discussed in Fama et al. (1969), which allows us to isolate the event response while controlling for broader market conditions. In particular, we estimate the following equation for each stock in our sample:
(1) 
This daily market model is a linear regression of daily returns  for each firm on market-wide returns
  . To avoid potential bias in the parameter estimates for
  and
and  , we estimate equation (1) during an estimation period, which is at least 46 days (or about two months of trading days) prior to the event. We also require a maximum of 255 trading days (or about a full year of trading days) during the estimation period. Once we have obtained the estimated parameters for and during the pre-event period, we are able to estimate abnormal returns in the following way:
(2) 
where  or
or  represents the abnormal return on day
  , and and are the estimated parameters obtained during the estimation period. is a random variable that, by construction, has an expected value of zero and is orthogonal to the independent variable
  . Stated differently, captures the firm specific stock return that accounts for market-wide conditions. We also reiterate that we use the CRSP value-weighted index return as the market return. This index consists of the weighted average return for the universe of CRSP securities where the weight is based on the firm’s market capitalization. Using the value-weighted index return allows us to account for potential bias due to the finding that small-cap firms generally outperform large-cap firms (as discussed in Banz 1981; Fama and French 1992, 1993, 1996).
Table 2 reports the results from estimating equation (2) and summing abnormal returns for various windows surrounding the Immigration Act of 1990. For example, CAR(-10,10) represents the cumulative abnormal returns for the 21-day window surrounding our event date. The table reports the means and medians of the CARs for the different time windows. We also report t-statistics (in parentheses) that test whether mean CARs are reliably different from zero. The number of observations is also reported at the bottom of each column. Column [1] shows that the mean CAR(-10,10) is 3.12 percent and is statistically significant (t-statistic = 6.93). In economic terms, the CAR suggests that the average firm in our sample experienced returns that exceed the market return by 3.12 percent during the 21-day event window.10We note that we use a number of event windows as means for robustness. However, the use of pre-event windows also allows us to account for the possibility that information about the signing of the Immigration Act and the implementation of the 1999 TPS order became available to the market in the days and weeks prior to the actual event day. In annual terms, this CAR represents an outperformance of the market by nearly 37 percent. Almost uniformly, the CARs are positive and significant in each column. The only exception is in column [3], when the mean CAR(-3,3) is positive (0.12 percent) but not reliably significant. In column [5], the mean CAR(-1,1) is 0.83 percent, which, when annualized, represents nearly 70 percent in the outperformance of the market. The results in table 2 seem to indicate that our sample of firms responded positively (relative to the market) during the period immediately surrounding the Immigration Act of 1990.11In unreported tests, we replicate our analysis for several other event days related to the Immigration Act of 1990. For instance, we conduct the test around the date the act was introduced by Senator Ted Kennedy (February 7, 1989), the day the act passed the Senate (July 13, 1989), and the day the act passed the House of Representatives (October 3, 1990). In each case, we do not find that mean CARs (while positive) surrounding these alternative event days are uniformly significant.
Next, we replicate our analysis for the TPS order in 1999, which provided refuge for nearly 90,000 immigrants from Honduras and Nicaragua due to the devastation of Hurricane Mitch.12It is possible that the effects of Hurricane Mitch—while affecting the level of immigrants due to the 1999 TPS order, which can affect labor costs to firms—might also adversely affect demand, due to the storm’s devastation to both Honduras and Nicaragua. However, the amount of US imports from Honduras is rather small. For instance, most recent data suggest that Honduras is only the 49th largest exporter to the United States. Likewise, recent data suggest that Nicaragua is only the 58th largest exporter to the United States (https://tradingeconomics.com/united-states/imports-by-country). Therefore, demand effects due to the hurricane are not likely to confound our event study tests using US firms. The use of this second event is not only for robustness, but the event is also likely to be considered more exogenous than the 1990 Immigration Act given that the order occurred due to a natural disaster. Unlike the Immigration Act of 1990, which went through an arduous legislative process, the TPS order of 1999 occurred more suddenly. Table 3 reports the results from the analysis. The table is formatted exactly like the previous table with CARs from the different time windows reported in each of the six columns. Similar to the previous table, we find that mean CARs are positive and highly significant. For instance, column [3] shows that the seven-day CAR for the average firm in our analysis is 7.6 percent. Again, our methodology accounts for market-wide conditions, so this seven-day return is considered to be in excess of the market return. In annual terms, the mean CAR(-3,3) suggests that our sample of labor-intensive firms outperformed the market by more than 250 percent, on average. These findings suggest that our results are not only statistically significant but also economically meaningful.
4.2. Cumulative Abnormal Returns – By Firm Type
In this section, we replicate portions of tables 2 and 3 but estimate equations (1) and (2) and report results specifically for the three types of firms: Agriculture firms, Construction firms, and Manufacturing firms. Under each firm type, we report the results for CARs from day -5 to 5 and from day -1 to 1. At the bottom of each column, the number of firms is reported. Table 4 presents the analysis surrounding the Immigration Act of 1990. It is important to note that, during this particular event, we only have 19 Agriculture firms and 52 Construction firms. The last two columns of t able 4 show that the majority of firms in our sample are considered Manufacturing firms. The results from the table suggest that our initial findings in table 2 are not driven by Agriculture firms. For instance, columns [1] and [2] suggest that the mean CAR(-5,5) and the mean CAR(-1,1) are 0.33 percent and 0.26 percent, respectively. These mean CARs are not significantly different from zero. However, in columns [3] and [4], we find that mean CARs are indeed positive and statistically significant. For instance, the mean CAR(-5,5) is 5.9 percent while the mean CAR(-1,1) is 1.5 percent. Both of these means are statistically significant at (at least) the 0.10 level (t-statistics = 2.25 and 1.88). In economic terms, these mean CARs, when annualized, represent an outperformance of the market by about 130 percent and 125 percent, respectively. In the final two columns, we report the results for Manufacturing firms. We again find that the average Manufacturing firm in our sample experiences abnormal returns surrounding the passage of the Immigration Act of 1990. Columns [5] and [6] report mean CARs of 1.9 percent and 0.8 percent . Both of these means are statistically significant and economically meaningful. For instance, when annualizing these abnormal returns, the mean CARs indicate an annual outperformance of the market by about 40 percent and 65 percent, respectively. These findings suggest that, if anything, our findings in table 2 are driven by Construction firms and Manufacturing firms.
Table 5 presents the results surrounding the 1999 TPS order. Here, we replicate the tests in the previous table but focus on the TPS order instead of the Immigration Act of 1990. The format of table 5 is similar to table 4; however, the results vary slightly. In particular, we do not find statistically significant CARs in columns [3] and [4]. Like in the previous table, we do find positive and significant CARs in the last two columns. These results show that, for manufacturing firms, stock prices respond favorably to the TPS order. Combined, the results in tables 4 and 5 seem to indicate that the abnormal returns, which are documented in tables 2 and 3, are driven by manufacturing firms and, to a lesser extent, construction firms.
4.3. Cumulative Abnormal Returns – By Firm Type: Multivariate Tests
In this section, we continue our analysis by attempting to identify the types of firms that drive the positive and significant CARs that we documented in tables 2 and 3. In particular, we estimate the following equation using cross-sectional data and report the results in table 6:
(3) 
.
The dependent variable is the estimated CAR during the event window (-k,k) surrounding the signing of the 1990 Immigration Act, where k = 5 or 1. Columns [1] and [2] report the results when the dependent variable is CAR(-5,5) while columns [3] and [4] show the results when the dependent variable is CAR(- 1,1). The independent variables of interest include the following: Construction is an indicator variable equal to one if the firm is considered a Construction firm (according to the SIC codes)—zero otherwise— and Manufacture is another indicator variable capturing Manufacturing firms (according to SIC codes)— zero otherwise. The omitted indicator variable is Agriculture, which is a dummy variable capturing agricultural firms. The control variables include the following: Ln(MktCap) is the natural log of the market capitalization on the event day. Price is the closing price on the event day. Turnover is the ratio of daily volume (on the event day) scaled by shares outstanding. Volatility is calculated following Alizadeh, Brandt, and Diebold (2002) and is the difference between the natural log of the intraday high price and the natural log of the intraday low price. NYSE is an indicator variable capturing whether a firm is listed on the New York Stock Exchange—zero otherwise.
Results in column [1] show that the coefficient on Construction is 0.0549, which suggests that, relative to Agriculture firms (which is the omitted category), 11-day CARs are about 5.5 percent greater. We note that the t-statistic, which is obtained from White (1980) robust standard errors, is 1.91 indicating that the coefficient is both economically and statistically significant. These results hold in column [2], when controlling for other firm or stock characteristics. That is, the coefficient on Construction is 0.0529 (tstatistic = 1.84). We find that while the coefficient on Manufacture is positive, it is not reliably different from zero.
In columns [3] and [4], we do not find statistically significant coefficients on either Construction or Manufacture. These results indicate that while we find some evidence for differences between construction firms and agriculture firms when examining 11-day CARs, we do not find meaningful differences when examining 3-day CARs. Therefore, t able 6 only provides weak evidence of differences in stock prices responses by firm type during the period immediately surrounding the signing of the Immigration Act of 1990.
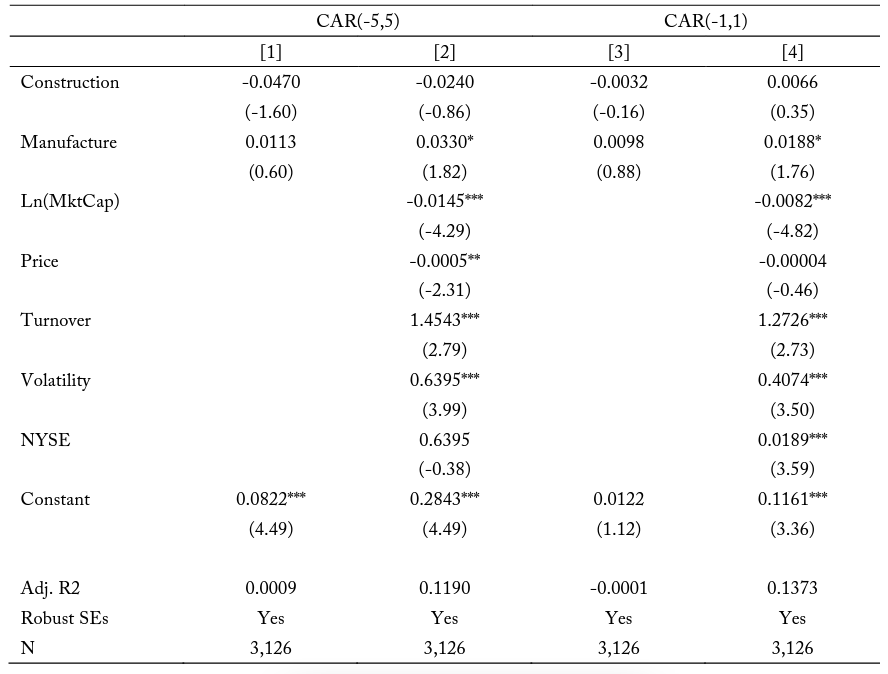
In our final set of tests, we replicate the analysis in t able 6 but examine CARs surrounding the 1999 TPS order instead of the Immigration Act signing. Said differently, we estimate equation (3) using CARs surrounding the TPS order and evaluate control variables on this second event day. The results are reported in table 7. The format of table 7 is identical to table 6. That is, we report the results using CAR(-5,5) as the dependent variable in columns [1] and [2] and the results using CAR(-1,1) as the dependent variable in columns [3] and [4]. Focusing our attention on the variables of interest, we do not find that either Construction or Manufacture produce reliable coefficients in column [1]. However, when including the control variables in column [2], we find that the coefficient on Manufacture is positive and marginally significant (estimate = 0.0330, t-statistic = 1.82). These results seem to provide some evidence that, relative to agriculture firms, manufacturing firms experienced higher abnormal returns for the 11- day period surrounding the TPS order. Similar results are found in columns [3] and [4]. The coefficient on Manufacture is not reliably different from zero in column [3]. However, when including the control variables, the coefficient on Manufacture is 0.0188 and statistically significant at the 0.10 level (t-statistic = 1.76). Combined, our multivariate analysis seems to indicate that, to some degree, construction firms and manufacturing firms seem to outperform agricultural firms during the periods immediately surrounding the signing of the Immigration Act and the imple mentation of the TPS order. However, our findings are weak, at best.
4.4. Robustness
In this section, we discuss a number of unreported tests that add to the robustness of our findings. The conclusions that we draw from our initial set of results are that changes in immigration policies will benefit firms that are most disposed to hire low-skilled labor relative to the rest of the market. To ensure our findings are not simply an artifact of small samples of particular industries, we first replicate table 2; but instead of analyzing firms that employ low-skilled workers, we examine firms that employ highskilled workers. We define high-skilled firms as those with an SIC code of 5400, which captures professional, scientific, and technical firms. As expected, we do not find any significant stock price reaction to the events that changed the level of immigration.
In our second set of robustness tests, we attempt to examine how the same types of firms used in our main analysis respond to changes in laws that might restrict the flow of immigration. Here, we examine the stock price reaction for agriculture, construction, and manufacturing firms surrounding the 2002 Enhanced Boarder Security Act. To the extent that this act inhibited the flow of immigrants, we ought to see a negative stock price response to these types of firms. Indeed, our unreported tests find negative CARs for the 21-day period, the 11-day period, the 7-day period, and the 5-day period surrounding the signing of the Enhanced Boarder Security Act. In economic terms, we find that CAR(-2,2) is -0.73 percent, which represents a significant underperformance— relative to the entire market—of nearly 37 percent when annualized. When we conduct these tests for each firm-type specifically, it seems that our results are again driven by construction and manufacturing firms.
In addition to this second set of tests, we also replicate table 2 surrounding another piece of immigration legislation. As mentioned above, President Ronald Reagan signed the Immigration Reform and Control Act of 1986 on November 6, 1986. This act made it illegal for firms to hire unauthorized immigrant workers. However, the act also legalized most of the unauthorized immigrant workers that had arrived in the United States prior to 1982. According to some reports, approximately 3 million unauthorized immigrants applied for legal status under the act, and about 2.7 million were granted amnesty.1313https://www.washingtonpost.com/news/wonk/wp/2014/11/26/what-happened-to-the-millions-of-immigrants-granted-legalstatus-under-ronald-reagan/?noredirect=on&utm_term=.4908c382aed9 In other unreported tests, we conduct our event study surrounding the signing of this 1986 act. Again, we find positive and significant CARs for our sample of firms from the agriculture, construction, and manufacturing industries. In economic terms, the average three-day CAR (CAR(-1,1)) is 0.42 percent (tstatistic = 3.04), which equates to an outperformance of the market by about 35 percent when annualized.
In our third set of robustness tests, we replicate table 2; but instead of using either of our event dates, we use five placebo—or randomly selected—event dates. If our results are simply a function of outperformance by firms in our sample over a long period of time, then we might observe positive and significant CARs in our placebo tests. Instead, we do not find evidence that CARs are reliably different from zero, on average. For instance, when taking the average CAR across the five placebo dates, we do not find any evidence that firms in our sample outperformed the entire market. Instead, the average CARs are statistically close to zero. For instance, the average 21-day CAR (CAR(-10,10)) across the five placebo dates is -0.0008 (with an average t-statistic of -0.01).
Lastly, we examine the long-run effects of these immigration policies on the stock price performance of the firms in our sample. In particular, we replicate our methodology; but instead of examining daily returns, we examine monthly stock returns for various long-run time windows. We find that after the 1999 TPS event, monthly stock returns of firms in our sample outperformed the entire market for at least six months. The average seven-month CAR (CAR(-1,6)) is more than 13 percent while the average 13- month CAR (CAR(-1,12)) is more than 31 percent. The economic significance of these long-run tests trails off over time, but the results from these robustness tests seem to highlight the possibility of greater long-run performance in firms with low-skilled workers during the post-event period.
Conclusion
While immigration has been well studied in the economics literature, few, if any studies, have examined how immigration might affect financial market outcomes. This study attempts to provide the first set of tests that link immigration to financial markets. In particular, we develop and test the hypothesis that, because of the macro-level and the micro-level benefits associated with immigration, the stock prices of firms—particularly firms with a disposition to hire low-skilled workers—will respond favorably to shocks to immigration. Using the Immigration Act of 1990 and the TPS order of 1999, we examine the stock prices of agricultural, construction, and manufacturing firms around these two events.
Results show positive and significant CARs for various time windows surrounding both the signing of the 1990 Immigration Act and the implementation of the 1999 TPS order. When conducting univariate tests, we find some evidence that both construction firms and manufacturing firms are driving our results. However, when controlling for various firm and stock characteristics, we provide only weak evidence of differences between firm types. Our results suggest that immigration, which has been shown to influence wages, employment, productivity, and, ultimately, economic output, might also have important financial market implications. Given the results in Olney (2013) and Peri and Sparber (2011) that suggest that immigration leads to greater firm expansion and higher firm-level productivity, our findings indicate that the unbiased perception of the market also recognizes the benefits associated with immigration as the stock prices of firms most likely affected by immigration adjust accordingly.
Tables
Table 1. Summary Statistics
The table reports statistics that describe the sample used throughout the analysis. Columns [1] through [5] show the summary statistics for the 1990 signing of the Immigration Act (November 29, 1990) while the latter columns show the statistics for the implementation of the 1999 Temporary Protective Status order (January 5, 1999). MktCap is the market capitalization of a particular firm on the event day. Likewise, Price is the daily closing price. Volatility is calculated following Alizadeh, Brandt, and Diebold (2002) and is the difference between the natural log of the intraday high price and the natural log of the intraday low price. Turnover is the ratio of daily volume (on the event day) scaled by shares outstanding. NYSE is an indicator variable capturing whether a firm is listed on the New York Stock Exchange—zero otherwise. Panel A provides the results for Agricultural firms. Panel B shows the results for Construction firms. Panel C presents the summary statistics for Manufacturing firms.
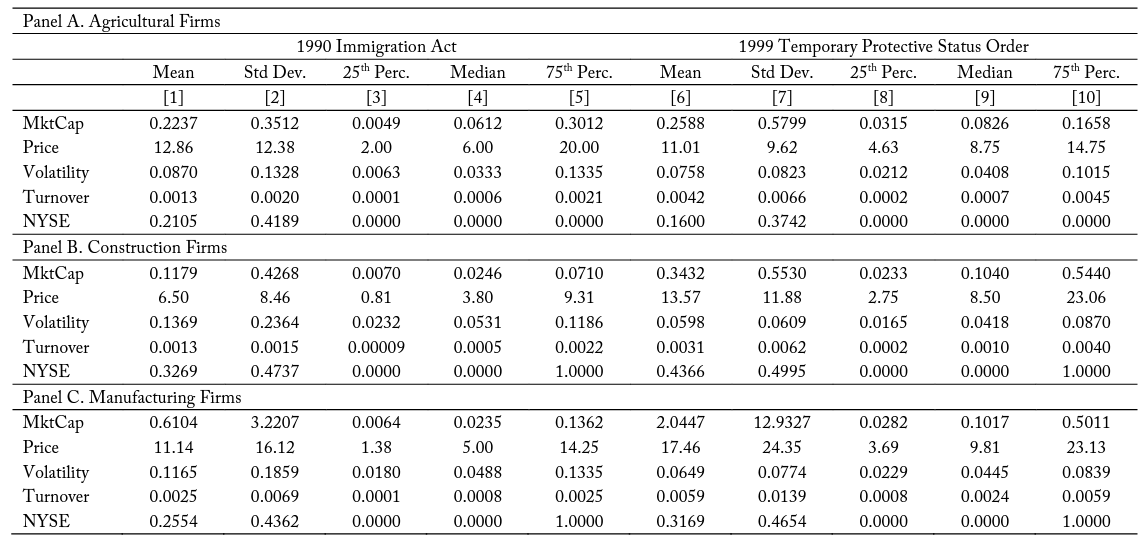 Table 2. Standard Event Study for All Firms Surrounding the 1990 Immigration Act
The table reports the results from a standard event study surrounding the signing of the 1990 Immigration Act. Cumulative abnormal returns (CARs) are estimated as residuals from a daily market model, where the independent variable is the CRSP value-weighted market index. The table reports both mean and median CARs as well as corresponding t-statistics that test the difference between mean CARs and zero. Event windows are provided in each column. For instance, CAR(-10,10) is the 21-day CAR surrounding the signing of the Immigration Act. Similarly, CAR(-5,5) is the 11-day CAR around the act. The bottom row of the table also reports the number of firms used in the analysis. Symbols *, **, and *** denote statistical significance at the 0.10, 0.05, and 0.01 levels, respectively.
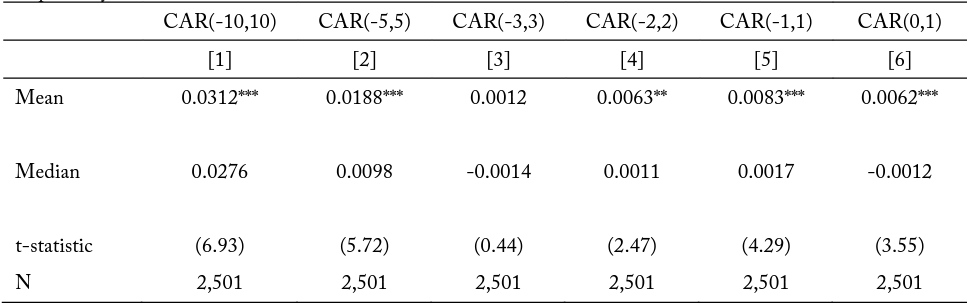
Table 3. Standard Event Study for All Firms Surrounding the 1999 Temporary Protective Status Order
The table reports the results from a standard event study surrounding the signing of the 1999 Temporary Protective Status order. Cumulative abnormal returns (CARs) are estimated as residuals from a daily market model, where the independent variable is the CRSP value-weighted market index. The table reports both mean and median CARs as well as corresponding t-statistics that test the difference between mean CARs and zero. Event windows are provided in each column. For instance, CAR(-10,10) is the 21-day CAR surrounding the signing of the Immigration Act. Similarly, CAR(-5,5) is the 11-day CAR around the act. The bottom row of the table also reports the number of firms used in the analysis. Symbols *, **, and *** denote statistical significance at the 0.10, 0.05, and 0.01 levels, respectively.
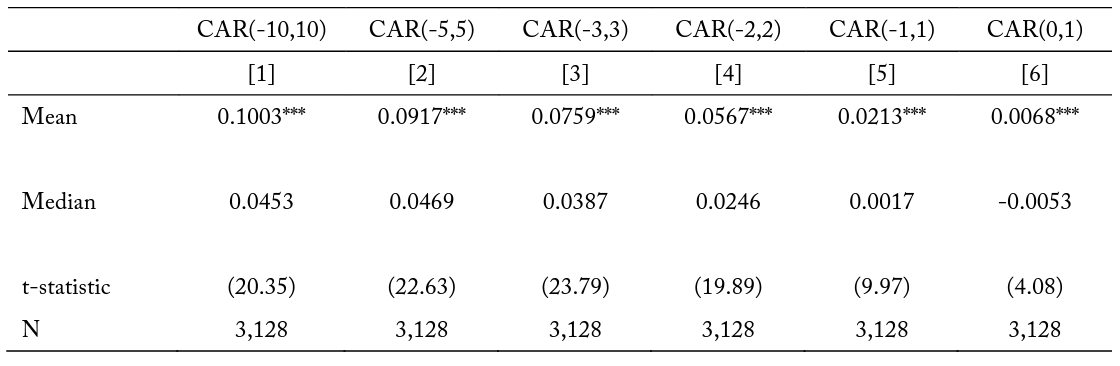
Table 4. Standard Event Study by Firm Type surrounding the 1990 Immigration Act
The table reports the results from a standard event study surrounding the signing of the 1990 Immigration Act, which occurred on November 29, 1990, by firm type. Columns [1] and [2] show the results for Agricultural firms. Columns [3] and [4] present the results for Construction firms. Columns [5] and [6] show the results for Manufacturing firms. Cumulative abnormal returns (CARs) are estimated as residuals from a daily market model, where the independent variable is the CRSP value-weighted market index. The table reports both mean and median CARs as well as corresponding t-statistics that test the difference between mean CARs and zero. Event windows are provided in each column. For instance, CAR(-10,10) is the 21-day CAR surrounding the signing of the Immigration Act. Similarly, CAR(-5,5) is the 11-day CAR around the act. The bottom row of the table also reports the number of firms used in the analysis. Symbols *, **, and *** denote statistical significance at the 0.10, 0.05, and 0.01 levels, respectively.
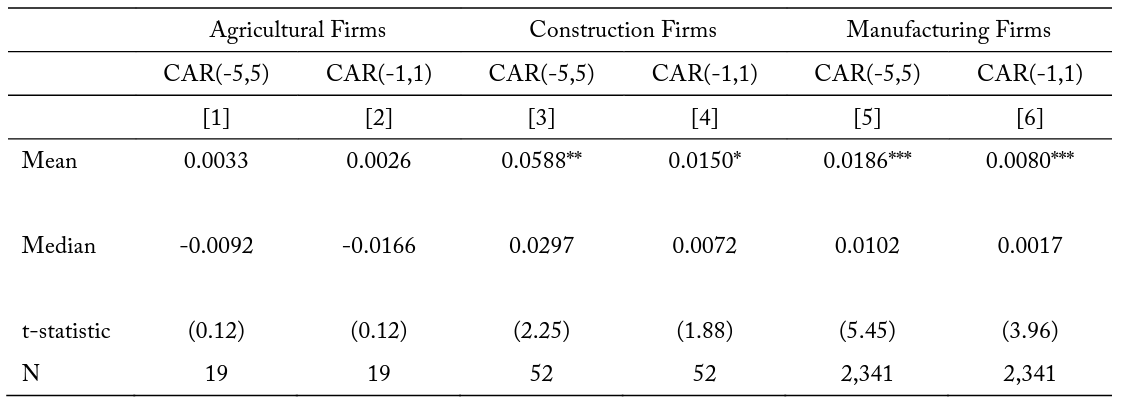
Table 5. Standard Event Study by Firm Type surrounding the 1999 Temporary Protective Status Order
The table reports the results from a standard event study surrounding the signing of the 1999 Temporary Protective Status order, which occurred on January 5, 1999, by firm type. Columns [1] and [2] show the results for Agricultural firms. Columns [3] and [4] present the results for Construction firms. Columns [5] and [6] show the results for Manufacturing firms. Cumulative abnormal returns (CARs) are estimated as residuals from a daily market model, where the independent variable is the CRSP value-weighted market index. The table reports both mean and median CARs as well as corresponding t-statistics that test the difference between mean CARs and zero. Event windows are provided in each column. For instance, CAR(-10,10) is the 21-day CAR surrounding the signing of the Immigration Act. Similarly, CAR(-5,5) is the 11-day CAR around the act. The bottom row of the table also reports the number of firms used in the analysis. Symbols *, **, and *** denote statistical significance at the 0.10, 0.05, and 0.01 levels, respectively.
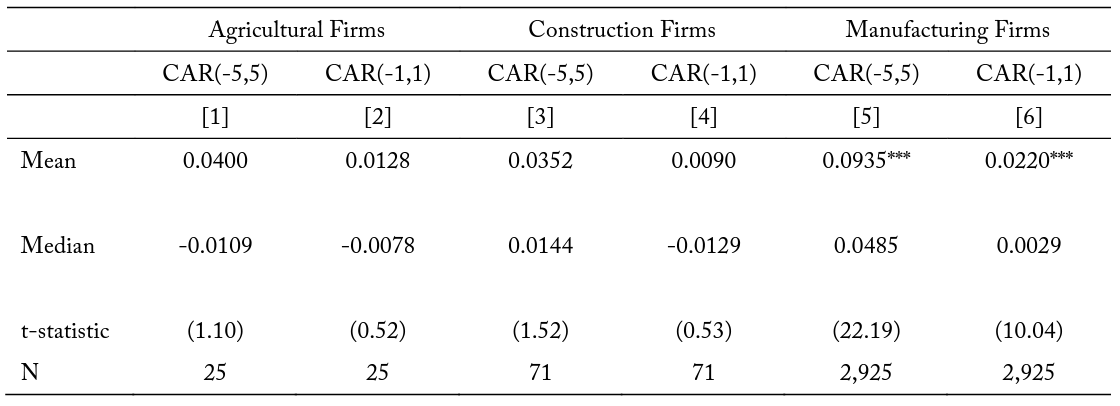
Table 6. Cross-Sectional Regressions: CARs and the 1990 Immigration Act
The table reports the results from estimating the following cross-sectional equation using Ordinary Least Squares:
![\[\begin{aligned} & \left.{\text { CAR }(-k, k)_i=b_1 \text { Construction }_i+b_2 \text { Manufacture }_i+b_3 \operatorname{Ln}(\text { Mkt Cappi }}_i\right)+b_4 \text { Price }_i+b_5 \text { Turnover }_i+b_6 \text { Volatility }_i+b_7 \text { NYSE }_i+ \\ & \alpha+\varepsilon \\ & \end{aligned}\]](https://www.thecgo.org/wp-content/ql-cache/quicklatex.com-d2b4dde824a0806177df9a1cb5999093_l3.svg "Rendered by QuickLaTeX.com")
The dependent variable is the estimate cumulative abnormal return during the event window (-k,k) surrounding the signing of the 1990 Immigration Act, where k = 5 or 1. Columns [1] and [2] report the results when the dependent variable is CAR(-5,5) while columns [3] and [4] show the results when the dependent variable is (CAR(-1,1). The independent variables of interest include the following: Construction is an indicator variable equal to one if the firm is considered a Construction firm (according to the SIC codes), and zero otherwise; Manufacture is an indicator variable capturing Manufacturing firms (according to SIC codes), and zero otherwise. The omitted indicator variable is Agriculture, which is a dummy variable capturing agricultural firms. The control variables include the following: Ln(MktCap) is the natural log of the market capitalization on the event day; Price is the closing price on f the event day; Turnover is the ratio of daily volume (on the event day) scaled by shares outstanding; Volatility is calculated following Alizadeh, Brandt, and Diebold (2002) and is the difference between the natural log of the intraday high price and the natural log of the intraday low price; and NYSE is an indicator variable capturing whether a firm is listed on the New York Stock Exchange, and zero otherwise. T-statistics, obtained from White (1980) robust standard errors, are reported in parentheses. Symbols *, **, and *** denote statistical significance at the 0.10, 0.05, and 0.01 levels, respectively.
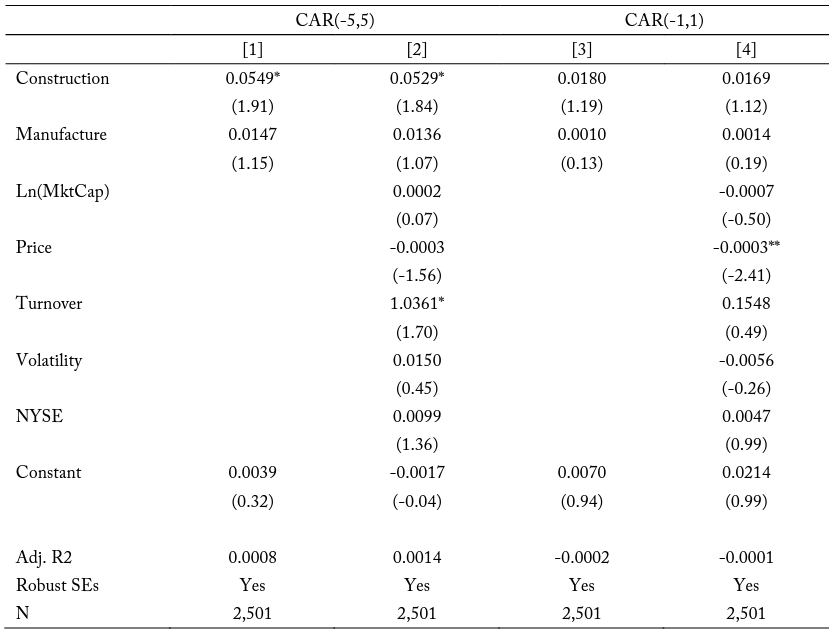
Table 7. Cross-Sectional Regressions: CARs and the 1999 Temporary Protective Status Order
The table reports the results from estimating the following cross-sectional equation using Ordinary Least Squares:
![\[\begin{aligned} & \alpha+\varepsilon \\ & \end{aligned}\]](https://www.thecgo.org/wp-content/ql-cache/quicklatex.com-c759e68261086b0bc5b9e9f47f93ea89_l3.svg "Rendered by QuickLaTeX.com")
The dependent variable is the estimate cumulative abnormal return during the event window (-k,k) surrounding the signing of the 1999 Temporary Protective Status order, where k = 5 or 1. Columns [1] and [2] report the results when the dependent variable is CAR(-5,5) while columns [3] and [4] show the results when the dependent variable is (CAR(-1,1). The independent variables of interest include the following: Construction is an indicator variable equal to one if the firm is considered a Construction firm (according to the SIC codes), and zero otherwise; Manufacture is an indicator variable capturing Manufacturing firms (according to SIC codes), and zero otherwise. The omitted indicator variable is Agriculture, which is a dummy variable capturing agricultural firms. The control variables include the following: Ln(MktCap) is the natural log of the market capitalization on the event day; Price is the closing price on f the event day; Turnover is the ratio of daily volume (on the event day) scaled by shares outstanding; Volatility is calculated following Alizadeh, Brandt, and Diebold (2002) and is the difference between the natural log of the intraday high price and the natural log of the intraday low price; and NYSE is an indicator variable capturing whether a firm is listed on the New York Stock Exchange, and zero otherwise. T-statistics, obtained from White (1980) robust standard errors, are reported in parentheses. Symbols *, **, and *** denote statistical significance at the 0.10, 0.05, and 0.01 levels, respectively.
References
Alizadeh, Sassan, Michael W. Brandt, and Francis X. Diebold. 2002. “Range-based Estimation of Stochastic Volatility Models.” Journal of Finance 57 (3): 1047–91.
Altonji, Joseph G., and David Card. 1991. “The Effects of Immigration on the Labor Market Outcomes of Less-Skilled Natives.” In Immigration, Trade, and the Labor Market. Chicago: University of Chicago Press.
Anderson, Kym, Joe Francois, Thomas Hertel, Bernard Hoekman, and Will Martin. 2000. “Potential Gains from Trade Reform in the New Millennium.” Paper presented at the Third Annual Conference on Global Economic Analysis, held at Monash University.
Anderson, Kym, and Will Martin. 2005. “Agricultural Trade Reform and the Doha Development Agenda.” World Economy 28 (9): 1301–27.
Banz, Rolf W. 1981. “The Relationship between Return and Market Value of Common Stocks.” Journal of Financial Economics 9 (1): 3–18.
Borjas, George J. 1995. “The Economic Benefits from Immigration.” Journal of Economic Perspectives 9 (2): 3–22.
Borjas, George J., Richard B. Freeman, and Lawrence F. Katz. 1991. “On the Labor Market Effects of Immigration and Trade.” NBER Working Paper No. 3761. National Bureau of Economic Research, Cambridge, MA.
Borjas, George J., Lawrence F. Katz, and Richard B. Freeman. 1997. “How Much Do Immigration and Trade Affect Labor Market Outcomes?.”
Brookings Papers on Economic Activity 1997 (1): 1–90. Butcher, Kristin F., and David Card. 1991. “Immigration and Wages: Evidence from the 1980s.” American Economic Review 81 (2): 292–6.
Caselli, Francesco, and James Feyrer. 2007. “The Marginal Product of Capital.” Quarterly Journal of Economics 122 (2): 535– 68.
Clemens, Michael A. 2011. “ Economics and Emigration: Trillion-dollar Bills on the Sidewalk?.” Journal of Economic Perspectives 25 (3): 83–106.
Dessus, Sebastien, Kilchiro Fukasaku, and Raid Safadi. 1999. “Multilateral Tariff Liberalisation and Developing Countries.” OECD Development Centre Policy Brief 18. Organisation for Economic Cooperation and Development, Paris, France.
Dustmann, Christian, Tommaso Frattini, and Ian P. Preston. 2012. “The Effect of Immigration along the Distribution of Wages.” Review of Economic Studies 80 (1): 145–73.
Fama, Eugene F., Lawrence Fisher, Michael C. Jenson, and Richard Roll. 1969. “The A djustment of Stock Prices to New Information.” International Economic Review 10 (1): 1–21.
Fama, Eugene F., and Kenneth R. French. 1992. “The Cross-Section of Expected Stock Returns.” Journal of Finance 47 (2): 427–65. ———. 1993. “Common Risk Factors in the Returns on Stocks and Bonds.” Journal of Financial Economics 33 (1): 3–56. ———. 1996. “Multifactor Explanations of Asset Pricing Anomalies.” Journal of Finance 51 (1): 55–84.
Gourinchas, Pierre-Olivier, and Olivier Jeanne. 2006. “The Elusive Gains from International Financial Integration.” Review of Economic Studies 73 (3): 715–41.
Goldin, Ian, Odin Knudsen, and Dominique van der Mensbrugghe. 1993. Trade Liberalization: Global Economic Implications. Paris: OECD.
Hamilton, Bob, and John Whalley. 1984. “Efficiency and Distributional Imp lications of Global Restrictions on Labour Mobility.” Journal of Development Economics 14 (1): 61–74.
Hertel, Thomas, and Roman Keeney. 2006. “What Is at Stake: The Relative Importance of Import Barriers, Export Subsidies, and Domestic Support.” In Agricultural Trade Reform and the Doha Development Agenda, edited by Kym Anderson and William Martin, 37–62. Washington, DC: World Bank.
Hong, Gihoon, and John McLaren. 2015. “Are Immigrants a Shot in the Arm for the Local Economy?.” NBER Working Paper No. 21123. National Bureau of Economic Research, Cambridge, MA.
Hunt, Jennifer, and Marjolaine Gauthier-Loiselle. 2010. “How Much Does Immigration Boost Innovation?.” American Economic Journal: Macroeconomics 2 (2): 31–56.
Iregui, Ana Maria. 2005. “Efficiency Gains from the Elimination of Global Restrictions on Labour Mobility.” In Poverty, International Migration and Asylum, edited by George J. Borjas and Jeff Crisp, 211–38. New York: Palgrave Macmillan.
Jaeger, David. 1996. “Skill Differences and the Effect of Immigrants on the Wages of Natives.” US Bureau of Labor Statistics Working Paper No. 273 .
Klein, Paul, and Gustavo Ventura. 2009. “Productivity Differences and the Dynamic Effects of Labor Movements.” Journal of Monetary Economics 56 (8): 551–75.
LaLonde, Robert J., and Robert H. Topel. 1991. “Labor Market Adjustments to Increased Immigration.” In Immigration, Trade, and the Labor Market, 167–99. Chicago: University of Chicago Press .
Leiden, Warren R., and David L. Neal. 1990. “Highlights of the US Immigration Act of 1990.” Fordham International Law Journal 14 (1): 328.
Mitaritonna, Cristina, Gianluca Orefice, and Giovanni Peri. 2017. “Immigrants and Firms’ Outcomes: Evidence from France.” European Economic Review 96:62–82.
Morley, Bruce. 2006. “Causality between Economic Growth and Immigration: An ARDL B ounds Testing Approach.” Economics Letters 90 (1): 72–6.
Moses, Jonathon, W., and Bjorn Letnes. 2004. “The Economic Costs to International Labor Restrictions: Revisiting the Empirical Discussion.” World Development 32 (10): 1609– 26.
Olney, William W. 2013. “Immigration and Firm Expansion.” Journal of Regional Science 53 (1): 142–57.
Ottaviano, Gianmarco, I. and Giovanni Peri. 2012. “Rethinking the Effect of Immigration on Wages.” Journal of the European Economic Association 10 (1): 152– 97.
Peri, Giovanni, and Chad Sparber. 2009. “Task Specialization, Immigration, and Wages.” American Economic Journal: Applied Economics 1 (3), 135-169.
Peri, Giovanni, and Chad Sparber. 2011. “Assessing Inherent Model Bias: An Application to Native Displacement in Response to Immigration.” Journal of Urban Economics 69 (1): 82–91.
Schoeni, Robert F. 1997. “Private Interhousehold Transfers of Money and Time: New Empirical Evidence.” Review of Income and Wealth 43 (4): 423–48.
World Bank. 2001. Global Economic Prospects and the Developing Countries. Washington, DC: World Bank.