


1. Introduction
The broad interaction between government and firms has been studied by economists for nearly 50 years (Stigler 1971; Peltzman 1976; Becker 1976). In theory, profit-maximizing firms might be captured by regulators or policymakers, which could harm the overall profitability of the firm, thus resulting in an important loss of welfare. On the other hand, firms that regularly interact with government might be able to achieve more favorable regulation, which might be value producing. Whether these politically active firms have higher valuations is an empirical, researchable question. Tests in Coates (2012) and Skaife, Veenman, and Werner (2013) provide evidence that firm-level political activity is associated with lower stock prices and a reduction in firm value. Additionally, Akcigit, Baslandze, and Lotti (2018) show that politically connected firms experience lower productivity than non-connected firms. In contrast, other studies—such as Hill, Kelly, Lockhart, and Van Ness (2013); Borisov, Goldman, and Gupta (2015); and Hutchens, Rego, and Sheneman (2016)—show that political activity can increase firm value. The consensus, therefore, in both the theoretical and empirical literature is mixed. Perhaps one of the difficulties in disentangling the impact of a firm’s political activity on firm value is the endogenous nature of this relation. Are more valuable firms simply more likely to engage in political activity, or does the activity affect firm value? To properly test whether firm value is influenced by the level of a firm’s political activity, we must account for this potential endogeneity.
In this paper, we use the Honest Leadership and Open Government (HLOG) Act that was signed into law on September 14, 2007, as a negative shock to the potential benefits associated with corporate lobbying, which is used as our measure of firms’ engagement in political activity. On January 4, 2006, lobbyist Jack Abramoff pled guilty to three counts of fraud, tax evasion, and bribery. This guilty plea was highly publicized and placed important scrutiny on the interaction between lobbyists and government officials. The case also coincided with an attempt by members of Congress to curb the potential corruptive effects of lobbying on regulation. For instance, in December 2005, Senator John McCain introduced the Lobbying Transparency and Accountability Act. However, the bill died in Congress on March 2, 2006. Ten months later, the HLOG Act was introduced. Given the fate of earlier bills, the signing of the HLOG Act seems to provide an unanticipated but exogenous change in law where the value associated with political connections can be properly measured. The HLOG Act includes provisions to prohibit government officials from becoming lobbyists and influencing the hiring decisions of private firms, while also prohibiting specific actions of lobbyists toward members of Congress. The HLOG Act also increased the penalties associated with lobbying related violations. Given the increased restrictions and scrutiny on lobbying imposed by the HLOG Act, we view the passing of the act as a negative shock to lobbying activities. Thus, a negative stock price response by firms that lobby would be indicative of a positive relation between lobbying expenditures and firm value. Likewise, a positive stock price response to the passage of the act would indicate a negative relation between lobbying and firm value.
In response to the act, we find negative cumulative abnormal returns (CARs) that range from -0.7 percent over a 3-day window to -1.4 percent over a 21-day window. These highly significant, negative returns are indicative of a positive relation between lobbying expenditures and firm value. We note that our results are robust to calculating abnormal returns using a variety of traditional methods as well as a number of different event windows. Additionally, we perform several falsification tests. We select a number of random event days and replicate our analysis. These tests do not reveal a consistent pattern in returns surrounding these placebo-like events, suggesting that the signing of the HLOG Act is an important determinant of stock prices of firms that engage in lobbying activity.
We note, however, that when attempting to determine whether the stock prices of firms that had lobbied were affected by the HLOG Act, our multivariate tests show that, after controlling for various stock characteristics, the stock price movements of firms that had lobbied are not significantly different from the stock price movements of firms that had not lobbied. These results call into question the robustness of our univariate tests and warrant additional analysis. In additional tests, we attempt to isolate the crosssectional relationship between event returns and the amount of lobbying activities. In our cross-sectional, multivariate analysis, we find that of the firms that lobby, those that lobby the most—or firms that had the highest dollar amount of lobbying expenditures scaled by total assets of the firm—had the most negative stock price reaction during the period surrounding the passage of the HLOG Act. Stated differently, the more a firm lobbied, the more its stock price decreased during the period surrounding the enactment of the HLOG Act. These results are robust to controls for other firm-specific characteristics, to various cross-sectional samples. For instance, in a number of robustness tests, we include not only the firms that had lobbied previously, but also a sample of control stocks from firms with zero lobbying expenditures. Again, we find that the ratio of lobbying expenditures to total assets significantly explains the negative abnormal returns during the period immediately surrounding the passage of the HLOG Act. Our findings seem to suggest that financial markets perceive that political engagement can indeed influence firm value and that legislative attempts to reduce rent-seeking by firms can adversely affect share prices.
The rest of this paper follows. Section 2 briefly discusses the related literature. Section 3 presents background on lobbying legislation, beginning with the 1995 Lobbying Disclosure Act and ending with the HLOG Act. Section 4 describes the data used throughout the analysis. Section 5 presents the results from our empirical tests. Section 6 offers some concluding remarks.
2. Literature Review
A variety of research has examined different types of political activity—either through campaign contributions or lobbying by corporations and corporate political action committees. However, findings seem to be mixed—empirical research finds both positive and negative relationships, or in some instances no relation between political activity and firm value. In early work, Roberts (1990) examines stock returns surrounding the death of a US senator and shows empirical evidence that the firms most closely connected to that senator have the most negative price response to the senator’s untimely death. Snyder (1992) posits that political contributions are inherently long-term and documents the characteristics of both the individuals giving and the firms receiving those contributions. Grier, Munger, and Roberts (1994) examine political contributions by corporate political action committees from 1978 to 1986 and find that industries with greater potential of government assistance contribute systematically more. Stratmann (1998) considers whether the objective of political action committees (PACs) is to influence congressional votes or whether it is solely to elect a preferred candidate. He finds that PACs look to influence both elections and votes and finds that the timing of the contributions is used as a mechanism to prevent reneging.
Much of the early research focused on PACs because of data availability issues. However, more recent research has used a broader array of political activity that includes PACs, lobbying, and individual donations. Since this paper examines the relation between lobbying and stock returns, we will highlight evidence on both sides of the debate. Several studies have found a negative relation between corporate political spending and firm performance. Coates (2012) finds that corporate lobbying and PAC activity increased both in frequency and absolute amount after the Citizens United ruling. However, results show that politically active firms do not appear to serve shareholder interests. Aggarwal, Meschke, and Wang (2012) find that firms that donate to political candidates have operating characteristics consistent with free cash flow problems. They also find that donations are negatively related to stock returns and that larger donations are associated with poorer corporate governance. Skaife, Veenman, and Werner (2013) examine the relation between corporate lobbying and CEO compensation. They find that CEOs of firms that lobby earn significantly more than CEOs from non-lobbying firms, which subsequently results in lower firm valuations.
In contrast, other studies have found a positive association between political activity and firm performance. Kim (2008) attempts to disentangle lobbying expenditures from campaign contributions and finds evidence that lobbying is positively related to equity returns. Li, Meng, Wang, and Zhou (2008) find a positive relation between political connections and firm performance for private firms in China. Hill, Kelly, Lockhart, and Van Ness (2013) find that the firms that lobby the most are those with greater potential payoffs to lobbying. They also find that shareholders value those lobbying activities, particularly if the firm does not have a political action committee. Chen, Parsley, and Yang (2015) examine lobbying expenditures and find that lobbying is positively related to accounting and market performance. They construct a portfolio of lobbying firms and find that portfolios of firms that do the most lobbying consistently outperform different benchmarks. In a study most closely related to ours, Borisov, Goldman, and Gupta (2015) use the Jack Abramoff guilty plea to test whether lobbying expenditures are value enhancing. Their findings show that firms that spent more than $100,000 on lobbying experienced an average decrease of $1.2 million in value after Abramoff’s guilty plea. While informative, our study differs from theirs by attempting to determine whether changes in laws related to lobbying influence stock prices.1Admittedly, in a very early version, Borisov, Goldman, and Gupta (2016) footnote unreported results suggesting that stock prices for firms that lobby were not necessarily affected by the introduction of the Lobbying Transparency and Accountability Act of 2006 or the 2007 HLOG Act. These unreported tests are not discussed in the published version of the article. In this study, we attempt to provide a more comprehensive study of the effect of lobbying regulation not only on the stock prices of firms that lobby, but also on stock prices of firms that lobby the most.
Barrick and Alexander (2014) conduct interviews with lobbyists and congressional staff and describe the process by which firms seek tax relief through lobbying. Cooper, Gulen, and Ovtchinnikov (2010) find that political contributions are positively and significantly related to the cross-section of future stock returns. They find that the effect is strongest for firms that support in the state that the firm is based, Democrats, candidates for the US House of Representatives, or a larger number of candidates altogether.
In separate but related literature, several papers have examined the implications of lobbying and political contributions on taxes. Richter, Samphantharak, and Timmons (2009) find that firms that spend more on lobbying pay lower effective tax rates. Meade and Li (2015) find a negative and significant relation between future effective tax rates and strategic tax lobbying. Brown, Drake, and Wellman (2015) examine how firms cultivate political relationships and find that firms that pursue a more relational approach to corporate political activity have lower future effective tax rates and less volatile future cash effective tax rates.
Other studies have looked more closely at the impact of specific political events on both corporate policy and firm valuations. Milyo, Primo, and Groseclose (2000) find that only 10 percent of political contributions come from political action committees and that the majority of contributions come from corporations. Fisman (2001) estimates the value of political connections by examining the political landscape in Indonesia and shows a significant change in stock prices surrounding political news. Faccio (2006) finds the overlap between political agents and controlling shareholders or top officers more pronounced in countries with higher levels of corruption and barriers to foreign investment. The announcement of new political connections also significantly increases value. Goldman, Rocholl, and So (2008) find a positive abnormal stock return following the announcement of the nomination of a politically connected individual to the board. Faccio, Masulis, and McConnell (2006) find that politically connected firms are significantly more likely to be bailed out than non-connected firms. The probability of bailout increases when the International Monetary Fund or the World Bank provides financial assistance to the firm’s home government. Igan, Mishra, and Tressel (2012) find that lenders that lobbied issued riskier loans as measured by higher loan-to-income ratios and were more likely to securitize their loans. In another stream of literature, Do, Nguyen, Lee, and Nguyen (2012) examine the impact of social networks based on political connections on firm value. On average, firms connected to elected governors increase in value by 1.36 percent surrounding the election. Acemoglu et al. (2010) find a positive stock market reaction from firms connected to Timothy Geithner when he was announced as a nominee for Treasury Secretary in November 2008, during the financial crisis. More generally, Cohen, Diether, and Malloy (2013) find that legislation has an impact on stock prices.
Several studies have focused on the 2000 presidential election. Knight (2006) uses predictions from the Iowa Electronic Markets to test the stock market reaction to events surrounding the 2000 presidential election. He finds a 9 percent difference between Bush-favored firms and Gore-favored firms. In a similar manner, Shon (2010) examines the relation between campaign contributions and stock returns during the Florida recount of the 2000 presidential election. Results in this study show a significant relation between pre-election contributions and stock returns, conditioned on which campaign received the money—a positive relation for contributions to the Bush campaign and a negative relation for contributions to the Gore campaign.
One of the main concerns with earlier research is the inherent endogeneity. It is difficult to disentangle whether corporate political spending increases firm value or whether firms with higher valuations are more likely to spend money on political strategies. Often, observing an exogenous shock to political activity can be used as an event that can help with identification problems. This paper follows these ideas by using the HLOG Act as a natural experiment in order to isolate the impact of lobbying on firm value.
3. Background of the HLOG Act
In July 1995, Senator Carl Levin introduced the Lobbying Disclosure Act (LDA), which was later passed and signed into law by President Bill Clinton on December 19, 1995. As part of the LDA, the legislation defines the terms “client” and “lobbyist” and requires federal lobbyists to register with Congress under certain circumstances. Ten years later, on January 3, 2006, Jack Abramoff—a top lobbyist for several wellknown lobbying firms—pled guilty to three felony counts, which included mail fraud, bribery of public officials, and tax evasion. This guilty plea highlighted the potential corruption between the lobbying industry and government in spite of the LDA, which was enacted a decade earlier. In fact, the Abramoff trial coincided with the introduction of a new regulation titled the Lobbying Transparency and Accountability Act of 2006, which attempted to provide greater transparency of the relationship between lobbyists and lawmakers. As mentioned above, three months after the introduction, the bill died in Congress on March 2, 2006.
In an attempt to continue to combat the potential corruption associated with lobbying regulation, Senator Harry Reid, with bipartisan sponsorship, introduced the Honest Leadership and Open Government (HLOG) Act in January 2007. The bill passed the Senate two weeks later and the House about six months later. President George W. Bush signed the HLOG Act into law on September 14, 2007. The HLOG Act included sweeping provisions listed below:
- The HLOG Act prohibits certain government officials from providing lobbying services immediately after leaving office; it increased the “cooling off” period before former government officials could act as lobbyists.
- The HLOG Act restricts government officials from influencing hiring decisions of private firms.
- The HLOG Act prohibits lobbyists from providing gifts to members of Congress, in accordance with House or Senate rules.
- The HLOG Act increases a number of lobbying disclosure requirements. For instance, the act requires lobbying disclosure forms to be filed quarterly instead of semiannually. Also, lobbying disclosure forms are expected to be publicly accessible on a searchable, electronic database.
- The HLOG Act allows the Government Accountability Office to provide an annual audit of compliance to the law.
- The HLOG Act requires disclosure of earmarks in spending bills.
- The HLOG Act requires disclosure to the Federal Election Commission (FEC) when lobbyists contribute more than $15,000 to a particular political campaign.
- The HLOG Act increased the penalties for a number of oversights, such as failing to comply with tenets of the LDA and failing or falsifying financial disclosure requirements.
The HLOG Act seemed to provide the broadest attempt to limit potential corruption in the lobbying industry. Aside from the prohibitions listed above, the HLOG Act also amended both House and Senate ethics rules.2Details of the bill can be found at the following websites: https://www.congress.gov/bill/110th-congress/senate-bill/1 and https://www.congress.gov/bill/110th-congress/house-bill/2316. Many of the amendments focused on the disclosure of congressional travel expenditures or other financial matters.
4. Data Description
The data used in this analysis come from several sources. From the Center for Research on Securities Prices (CRSP), we obtained daily closing prices, closing bid and ask prices, intraday high and intraday low prices, trading volumes, market capitalization, and returns. We also obtained data from the Center for Responsive Politics (CRP) on firms that lobby. The CRP reports the amount of lobbying expenditures by firm for each year, beginning in 1998. The lobbying expenditures are rounding to the nearest $20,000. Lastly, we obtained firm assets from the Compustat data set. After obtaining the lobbying data, we carefully matched each firm based on the company name identifiers in the different data sets. According to the CRP lobbying data that extends from 2003 to 2007, we were able to match approximately 4823Initially, there are approximately 750 firms that have positive lobbying expenditures in any of the years from 2003 to 2007. We lose approximately 200 firms when merging the CRP data to the CRSP data. Lastly, when merging the combined CRP/CRSP data to Compustat, we lose an additional 70 firms or so, leaving us with 482 firms in our treatment sample. firms among all of the data sets. sets.4We note that, in a number of unreported tests, we replicate our analysis using two different treatment samples. First, we replicate our analysis using only firms that have positive lobbying expenditures in 2007. Second, we conduct our analysis for firms that have positive lobbying expenditures from 2005 to 2007. In both cases, the conclusions that we are able to draw using these alternative treatment samples are similar to those drawn in this study.
Table 1 reports statistics that summarize our sample of lobbying firms. We report the summary statistics for different variables used throughout the analysis. LobAmt is the amount of annual lobbying obtained from the CRP. Lob/Assets is the percent of total assets made up from lobbying expenditures. Price is the closing share price of a treated stock on the day the HLOG Act was passed. Similarly, Size is the daily market capitalization on the event day. Turnover is the ratio of daily volume, scaled by shares outstanding on the passage day. We calculate Volatility following Alizadeh, Brandt, and Diebold (2002) and as the natural log of the intraday high price minus the natural log of the intraday low price. Spread is the bid-ask spread—the difference between the closing ask price and the closing bid price, scaled by the spread midpoint. Both Volatility and Spread are calculated as of the event day—the day the HLOG Act was passed.
Table 1 shows that the average stock in the treated sample has lobbying expenditures of nearly $2.8 million, which makes up 0.14 percent of total assets. We also find that the average stock has a share price of $35.70 and market capitalization of more than $12 billion. The average values for Turnover, Volatility, and Spread are 7.55, 0.0282, and 0.29 percent, respectively. Table 2 also provides some summary statistics. In this table, we report correlation coefficients across the variables used throughout the analysis. Here, we find that LobAmt is positively correlated with Price and Size and negatively correlated with Volatility and Spread. These results are not that surprising as larger, more liquid firms are generally those firms that lobby. What is surprising, however, is the magnitude of the correlation between LobbyAmt and Size (correlation = 0.6470, p-value = <0.0001). These results seem to suggest the need to carefully control for the size of firms when attempting to isolate the effect of lobbying on the prices for treated stocks.
5. Empirical Tests
We begin our analysis by examining cumulative abnormal returns (CARs) for firms that had lobbying expenditures between 2003 and 2007. We examine CARs around the passage of the Honest Leadership and Open Government (HLOG) Act, which occurred on September 14, 2007. Table 3 reports CARs for various time windows surrounding passage of HLOG. Abnormal returns are calculated three different ways. First, the residuals from a daily market model regression (MM) are used as abnormal returns. Second, we take the difference between returns for treated stocks and market returns (MAR) as abnormal returns. Third, we use the residuals of a daily market model but with the Scholes and Williams (1977) beta adjustment (SW) as a measure of abnormal returns. Panel A reports the results using various time windows that surround the passage of the law. Panel B presents the results for additional time windows during the pre- and post-event periods. While the results are reported for a treatment sample of firms that have positive lobbying expenditures in any of the five years from 2003 to 2007, we replicate these tests and those that follow using two other treatment samples. First, we use only firms that lobbied during 2007. Second, we use firms that had positive lobbying expenditures in any of the years from 2005 to 2007. The results from these unreported tests are qualitatively similar to those reported in this paper. We are therefore able to conclude that our findings are robust to differently constructed treatment samples.
Column 1 of table 3 reports results for the window (-10,10), which is the 21-day CAR surrounding the event day—10 days before to 10 days after. Thus, the first row of column 1 is the 21-day abnormal return, where the CAR is calculated using a residual from a market model. The CAR (-10,10) for the MM is – 0.0129, which is both statistically and economically significant. The corresponding t-statistic is reported in parentheses below each CAR. For the MM CAR (-10,10), the t-statistic is -2.68, which is significant at the 0.01 level. In economic terms, the magnitude of these event study returns is quite large. A -1.32 percent return over a 21-day window equates to more than 15 percent when annualized. In column 2 of panel A, we report results for the window CAR (-5,5). Each of the CARs are significant at (at least) the 0.05 level with returns ranging from -0.74 percent to -1.20 percent. Returns for CAR (-4,4), CAR (-3,3), and CAR (-2,2) are reported in columns 3 through 5 and have similar results to columns 1 and 2. The only exception is in column 4 when the CAR (-3,3) using market-adjusted returns is not significant at the 0.10 level. Scholes-Williams (SW) corrected CARs are generally the largest with MAR returns generally the smallest. Column 6 reports results for the three-day window surrounding the event, CAR (-1,1). The MM CAR (-1,1) is -0.0069 with a t-statistic of -4.57. The MAR CAR (-1,1) is -0.0067 with a t-statistic of -4.45, and the SW CAR (-1,1) is -0.0069 with a t-statistic of -4.56. All three of these are significant at the 0.01 level. For some perspective, a three-day return of -0.69 percent is more than -55 percent when annualized. We are thus able to conclude that each of the CARs for the three-day period surrounding the event is statistically and economically significant.
While examining the CARs surrounding different event windows is informative, it might also be interesting to focus on the specific timeline of those returns and see when the market responded. Panel B of table 3 reports CARs for pre- and post-event windows. Columns 1, 2, and 3 report results for preevent windows, which include CAR (-10,-1), CAR (-5,-1), and CAR (-3,-1), respectively. Columns 4, 5, and 6 report results for the post-event windows, which include (0,3), (0,5) and (0,10), respectively. A clear pattern emerges in panel B. It appears that the market anticipated the passage of the HLOG Act as prices moved in the days preceding the event. While the majority of the CARs (both pre and post) are negative, most of the post-event CARs are not significantly different from zero. In contrast, all of the pre-event CARs are statistically different from zero (at the 0.10 level), with eight of the nine CARs being significant at the 0.05 level. For comparison to the results in table 3, the three-day CARs reported in column 3 of panel B—specifically when using MM and SW CARs—tend to be larger than the three-day CARs reported in the previous panel. Once again, these findings imply that the market anticipated the passage of the HLOG Act and was quick to impound that information into prices.
While our results appear quite robust, it is important to rule out alternative explanations. One possible explanation is that lobbying firms tend to be in the same industry and move together more generally, so our findings are merely picking up that inherent correlation. To rule out this possibility, we constructed a falsification test that randomly selects event days and then performs the previously reported tests. Table 4 reports results for 10 random event days (during the years 2006 through 2008) for the windows used in panel A of table 3. Column 1 reports results for the CAR (-10,10) window and column 6 reports results for the (-1,1) window, with incremental windows reported in columns 2 through 5. Of the 60 CARs reported in table 4, only one is negative and significant at the 0.10 level. At the bottom of the table, we take the equally weighted average of CARs across the 10 randomly selected dates with correspondingly average t-statistics. We note that doing so allows us to observe that CARs for treated stocks are very close to zero. For instance, the largest t-statistic is only 0.40 (see column 3). The results from these falsification tests support the idea that, for treated firms, the negative stock price response to the HLOG Act was not part of a broader, negative stock price trend during the years surrounding the act. In general, our findings seem to suggest that financial markets attribute higher value to firms that lobby than to firms that do not.5As means of robustness, we replicate the analysis in table 3, but we use three other event days, including the introduction date of the bill (January 4, 2007), the date of the passage of the bill through the US Senate (January 18, 2007), and the date of the passage of the bill through the US House of Representatives (July 31, 2007). We do not find any significant CARs for those stocks in our sample around the introduction date and the Senate passage date. In fact, CARs are very close to zero. When we examine CARs surrounding the House passage date, we find some larger, negative CARs. For instance, the CAR (-5,5) surrounding the House passage date is -0.0098. We note, however, that the CAR is not quite significant at the 0.10 level (t-statistic = -1.42). Market participants might still be skeptical of the signing of the bill given that the 2006 Lobbying Transparency and Accountability Act did not make it through both chambers of the US Congress.
Next, we attempt to determine whether the negative stock price reaction surrounding the HLOG Act was part of broader cross-sectional movement in stock prices. In particular, we attempt to control for a number of stock characteristics in a multivariate setting while attempting to determine whether firms that had lobbied had greater negative stock price responses surrounding the HLOG Act vis-à-vis firms that had not lobbied. To do so, we estimate the following equation using various treated and control firms:

The dependent variable is the CAR from day –5 to day k, where k is either +5, or –1. These dependent variables—and those that follow—are measured using residuals from the market model (MM), although similar results are found when we calculate abnormal returns using MAR and SW methods. The independent variable of interest is the indicator variable Lobby, which is equal to unity if firm i is in the treated sample—zero otherwise. The other control variables consist of the following: Ln(Price) is the natural log of the share price on the event day; Ln(Size) is the natural log of market capitalization on the event day; Turnover is the ratio of daily volume scaled by shares outstanding; Volatility is the natural log of the intraday high price minus the natural log of the intraday low price; and Spread is the bid-ask spread— the difference between the closing ask price and the closing bid price, scaled by the spread midpoint. To the extent that the negative price reaction observed in table 3 is isolated to stocks in our treatment sample, the coefficient on the indicator Lobby is expected to be negative and significant.
Before discussing the results, which are located in table 5, we note that we include two control samples. First, we match each of the 482 treated stocks to stocks of firms that had not lobbied, based on market capitalization. Therefore, equation (1) is estimated for a sample of 964 total firms. Second, we include in the control group the universe of CRSP firms (given the availability of data) that had not lobbied during the years 2003 to 2007.6For reasons discussed later in the paper, we require the firms in the second control group to also have available data from Compustat.
Table 5 reports the results from the analysis. We note that columns 1 and 2 present the findings for the treated and matched control firms, while columns 3 and 4 show the results for the treated firms and the universe of non-treated firms. We note that, in general, Ln(Price) produces a positive and significant coefficient (in columns 2 through 4). Similarly, the coefficient on Ln(Size) is also positive and significant in columns 1 and 2. These are the only significant coefficients (at the 0.05 level) on any of the control variables. After controlling for these and other control variables, however, we do not find that the indicator variable Lobby produces a negative and significant coefficient in any of the four columns. While our falsification tests rule out a broader negative stock price trend for treated stocks, these results suggest that we cannot rule out the idea that, once controlling for various stock characteristics, there is a broader cross-sectional trend in negative stock prices surrounding the event day.
Next, we replicate this type of analysis; but instead of including a single indicator variable that captured firms that lobby, we include five distinct indicator variables that capture whether a firm lobbied in each of the five years from 2003 to 2007. In particular, we estimate the following equation:

The dependent variables and the control variables are similar to those in the previous equation. However, we include Lobby2003, which is equal to unity if firm i had positive lobbying expenditures in 2003—zero otherwise. Similarly, Lobby2004 is equal to one if firm i lobbied in 2004—zero otherwise. As other independent variables of interest, we include Lobby2005, Lobby2006, and Lobby2007 as well.
Table 6 reports the results from estimating equation (2). The format of the table is similar to the previous table, with columns 1 and 2 showing the results for the treated and matched control stocks, while columns 3 and 4 present the results for the treated stocks and the stocks of firms that did not have any positive lobbying expenditures in any of the five years from 2003 to 2007. For brevity, we suppress the table by not reporting the coefficients on the control variables, but we note that we include each of the control variables in the estimation of equation (2). Therefore, only the coefficients on the five indicator variables are reported. A few results are noteworthy. First, we do not find any of the coefficients to be significant at the 0.05 level. We do note, however, that Lobby2006 produces negative coefficients that are greater than -1 percent (in absolute value). The coefficients are not reliably different from zero, but the results seem to provide some weak inference that lobbying expenditures during the year prior to the HLOG Act’s passage might be important in the analysis that follows.
The previous tests indicate that, after holding constant a number of stock characteristics, the stock price movements of firms that had lobbied were not reliably different from the price movements of firms that had not lobbied. In our final set of tests, we continue our analysis by attempting to determine whether the lobbying amount influences the stock price reaction during the period surrounding the passage of the HLOG Act. In particular, we estimate the following equation using various cross-sectional samples:

The dependent variables and the control variables are similar to those in previous equations. Here, in equation (3), the independent variable of interest is the ratio of lobbying expenditures to total assets for each firm (LobAmt/Assets). Of course, firms that had not lobbied from 2003 to 2007 have a ratio equal to zero. We estimate the equation for three different samples. First, we only include those 482 firms that have lobbied. That is, we test whether the magnitude of lobbying expenditures for treated stocks influences the stock price reaction during the period surrounding the passage of the HLOG Act. Second, we estimate equation (3) for a sample that includes the 482 treated firms and a sample of 482 matched firms—those that had not lobbied that are matched with treated firms based on the market capitalization. Third, we estimate equation (3) for a sample that includes the treated stocks and the universe of firms that had not lobbied. We note that we require all firms in each of the samples to have available data from the CRP, CRSP, and Compustat.7Initially, we begin our sample with about 750 treated firms that have positive lobbying expenditures from the CRP. When merging the data with CRSP, we lose nearly 200 observations. This is likely due to the fact that many of the firms that had lobbied are not listed on a major stock exchange—a requirement for data availability on CRSP. We then lose an additional 70 firms or so when merging with Compustat. Table 7 reports the results from estimating equation (3).
Columns 1 and 2 report the results when using the first sample 482 treated stocks. Columns 3 and 4 show the results when we use the second sample of treated and matched stocks (n=964). Columns 5 and 6 present the results when using the third sample of stocks, which include the treated stocks and the universe of stocks from firms that had not lobbied (n=6,844). In odd-numbered columns, we report the results when the dependent variable is CAR (-5,5). In even-numbered columns, we present the results when the dependent variable is CAR (-5,-1). As seen in the table, control variables produce coefficients that are similar to the corresponding coefficients in previous tables. Focusing on the independent variable of interest, we find in column 1 that LobAmt/Assets produces a negative and significant coefficient (coefficient = -0.0194, t-statistic = -3.91). These results suggest that, for treated stocks, a 1 percent increase in the ratio of lobbying expenditures to assets is associated with a -1.94 percent CAR during the 11-day period surrounding the HLOG Act’s passage. In economic terms, this coefficient is slightly more than 44 percent when annualized. We find qualitatively similar results in column 2 when the coefficient is -0.0103. This coefficient is both statistically significant (t-statistic = -2.54) and economically meaningful as the coefficient represents nearly 52 percent when annualized. These results suggest that, for firms that had lobbied, the amount of lobbying expenditures matters when determining the stock price reaction surrounding the passage of the HLOG Act.
Columns 3 and 4 provide similar results, as the coefficients on LobAmt/Assets are very similar to those in the previous two columns. We note that for the matched stocks, LobAmt/Assets is simply equal to zero. Likewise, columns 5 and 6 provide similar evidence, as the coefficients on LobAmt/Assets are -0.0148 and -0.0119, respectively. Combined with previous multivariate tests, these findings suggest that while the stock price reaction to the passage of the HLOG Act does not statistically differ between firms that had lobbied and firms that had not, the amount of lobbying significantly matters in explaining the CARs surrounding the HLOG Act’s passage.8In other unreported tests, we include controls for the number of institutional shareholders for each firm. Chung and Zhang (2011) suggest that institutional investors are better than non-institutional investors at monitoring management. Therefore, firms with a high number of institutional shareholders might be better governed. While we lose some of our sample due to missing institutional holdings data, the results reported in table 7 still hold.
Table 8 reports the results from estimating the following equation using our three cross-sectional samples:
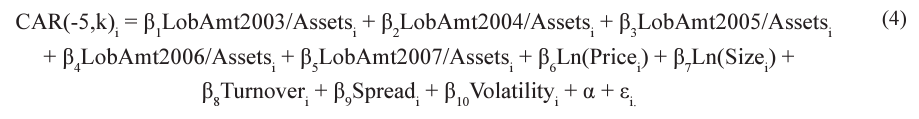
As before, the dependent variable and the control variables are similar to those in previous equations. The only difference is that we separate out the ratios of lobbying expenditures to assets by year. For instance, LobAmt2003/Assets is the ratio of the lobbying expenditures in 2003 for each firm i to total assets. Similarly, LobAmt2007/Assets is the ratio of lobbying expenditures in 2007 to total assets for each firm in the respective sample. Table 8 presents the results from estimating equation (4). For brevity’s sake, as with table 6, we do not report the coefficients on the control variables, although we do include the controls in each specification. The format of table 8 is similar to the format in the previous table. Focusing on these five independent variables of interest, we are able to make an important inference. None of the coefficients on the ratios is significantly negative except for LobAmt2006/Assets. In each of the six columns, the estimate for LobAmt2006/Assets is uniformly negative and reliably different from zero. These results indicate that the negative association between LobAmt/Assets and event-CARs in table 7 is being driven by the amount of lobbying in 2006. This result is intuitive and suggests that the firms with the most lobbying in 2006 are most negatively affected by the HLOG Act, which was introduced at the beginning of 2007 and passed in September of the same year. Data on lobbying are likely obtained by investors from lobbying disclosure reports filed with the Secretary of the Senate’s Office of Public Records. These reports are not available continuously but are filed—at most—quarterly. Total lobbying expenditures in 2006 seem to be explaining our main finding, and this observation is consistent with the idea that investors are aware of the amount of lobbying filed in those reports as of the end of 2006.
6. Conclusion
On September 14, 2007, President George W. Bush signed the HLOG Act into law, effectively placing a number of restrictions on the lobbying industry. In this study, we examine the effect of this legislation on the stock prices of firms that actively lobby. Our tests are motivated by the literature that attempts to determine whether firms that actively engage in political activities have higher values. For instance, while some prior research shows that firms that are politically active are valued higher than non-active firms (Roberts 1990; Fisman 2001; Faccio 2006), other research suggests that political activity can result in higher agency costs and additional exposure to political risks (Coates 2012; Skaife, Veenman, and Werner 2013), which can adversely affect firm value.
Motivated by this line of research, this study examines the stock prices of firms that lobby, surrounding the signing of HLOG Act into law. To the extent that the HLOG Act adversely affected the benefits associated with lobbying, and to the extent that lobbying directly affects firm value, the stock prices of firms that lobby are likely to respond negatively to the enacting of this legislation. A negative stock price reaction would be consistent with the idea that financial markets perceive firm-specific benefits associated with lobbying and that new legislation that attempts to counter these benefits would harm the valuation of these firms.
Results in this study provide initial evidence that stock prices of lobbying firms significantly decrease surrounding the implementation of the HLOG Act. For instance, during the three-day period surrounding the signing of the HLOG Act, stock prices of firms that lobby decrease (in excess of the market) between 67 basis points and 69 basis points, respectively. In annual terms, these results suggest that firms that lobby underperform the market by 55.8 percent to 57.5 percent. Our results are robust to various treatment groups of stocks and different methods for estimating cumulative abnormal stock returns. We also conduct a series of placebo tests where we replicate our analysis surrounding three random placebo event days. These results suggest that our findings are not simply a function of a broader downward trend in stock prices for firms that lobby, as our sample of firms that lobby neither underperform nor outperform the rest of the market in our placebo tests. As additional robustness, we attempt to determine whether our univariate results are unique only to firms that lobby. Said differently, we conduct various tests for treated firms (those that lobby) and various control firms, while accounting for firm characteristics in a multivariate setting. In these tests, we do not find a significant difference between the stock price responses for firms that had lobbied and the stock price reactions for firms that had not lobbied. However, in additional multivariate tests, we show that the amount that firms had lobbied (relative to total assets) helps explain the negative returns surrounding the passage of the HLOG Act. For instance, after calculating the ratio of lobbying expenditures to total assets both for firms that had lobbied and for those that had not, we find that this ratio is important in explaining the negative returns for firms that lobbied—even after controlling for various stock characteristics. These multivariate results provide support for the idea that this legislation negatively influenced the market value of firms that were most politically active.
Much of the economic literature discusses the benefits associated with political activity. Finding that corporate lobbying directly affects firm value contributes to this literature. However, these results might seem troubling given that firms are substituting capital away from profitable innovations to rent-seeking activities such as lobbying. A fruitful area for future research might be to identify or quantify the welfare loss associated with firms’ decision to substitute away from innovation to political engagement.
References
Acemoglu, Daron, Simon Johnson, Amir Kermani, James Kwak, and Todd Mitton. 2010. “The Value of Connections in Turbulent Times: Evidence from the United States.” Journal of Financial Economics 121:368–91.
Aggarwal, Rajesh K., Felix Meschke, and Tracy Yue Wang. 2012. “Corporate Political Donations: Investment or Agency?” Business and Politics 14:1–38.
Akcigit, Ufuk, Salome Baslandze, and Francesca Lotti. 2018. “Connecting to Power: Political Connections, Innovation, and Firm Dynamics.” NBER Working Paper No. 25136. National Bureau of Economic Research, October 3.
Alizadeh, Sassan, Michael W. Brandt, and Francis X. Diebold. 2002. “Range-Based Estimation of Stochastic Volatility Models.” Journal of Finance 57:1047–91.
Barrick, John A., and Raquel Meyer Alexander. 2014. “Tax Lobbying and Corporate Political Activity: How Do Firms Seek Tax Relief?.” Working Paper. Brigham Young University, September 22.
Becker, Gary. 1976. “Toward a More General Theory of Regulation: A Comment.” Journal of Law and Economics 19:245–48.
Brown, Jennifer L., Katharine Drake, and Laura Wellman. 2015. “The Benefits of a Relational Approach to Corporate Political Activity: Evidence from Political Contributions to Tax Policymakers.” Journal of the American Taxation Association 37:69–102.
Borisov, Alexander, Eitan Goldman, and Nandini Gupta. 2015. “The Corporate Value of (Corrupt) Lobbying.” Review of Financial Studies 29:1039–71.
Chen, Hui, David Parsley, and Ya-Wen Yang. 2015. “Corporate Lobbying and Firm Performance.” Journal of Business Finance and Accounting 42:444–81.
Chung, Kee H., and Hao Zhang. 2011. “Corporate Governance and Institutional Ownership.” Journal of Financial and Quantitative Analysis 46:247–73.
Coates, John, C.. 2012. “Corporate Politics, Governance, and Value before and after Citizens United.”
Journal of Empirical Legal Studies 9:657–96.
Cohen, Lauren, Karl Diether, and Christopher Malloy. 2013. “Legislating Stock Prices.” Journal of Financial Economics 110:574–95.
Cooper, Michael J., Huseyin Gulen, and Alexei V. Ovtchinnikov. 2010. “Corporate Political Contributions and Stock Returns.” Journal of Finance 65:687–724.
Do, Quoc-Anh, Yen Teik Lee, and Bang Dang Nguyen. 2012. “Political Connections and Firm Value: Evidence from the Regression Discontinuity Design of Close Gubernatorial Elections.” Working Paper. University of Cambridge, UK, March 16.
Faccio, Mara. 2006. “Politically Connected Firms.” American Economic Reviews 96:369–86.
Faccio, Mara, Ronald W. Masulis, and John J. McConnell. 2006. “Political Connections and Corporate Bailouts.” Journal of Finance 61:2597–635.
Fisman, Raymond. 2001. “Estimating the Value of Political Connections.” American Economic Review
91:1095–102.
Goldman, Eitan, Jorg Rocholl, and Jongil So. 2008. “Do Politically Connected Boards Affect Firm Value?”
Review of Financial Studies 22:2331–60.
Grier, Kevin B., Michael C. Munger, and Brian E. Roberts. 1994. “The Determinants of Industry Political Activity, 1978–1986.” American Political Science Review 88:911–26.
Hill, Matthew D., G. Wayne Kelly, G. Brandon Lockhart, and Robert A. Van Ness. 2013. “Determinants and Effects of Corporate Lobbying.” Financial Management 42:931–57.
Hutchens, Michelle, Sonja O. Rego, and Amy Sheneman. 2016. “Influencing Profits: The Differential Impact of Lobbying on Corporate Stock Returns.” Kelley School of Business Research Paper No. 16-41. Indiana University, Bloomington, IN, April 29.
Igan, Deniz, Prachi Mishra, and Thierry Tressel. 2012. “A Fistful of Dollars: Lobbying and the Financial Crisis.” In NBER Macroeconomics Annual 2011, edited by Daron Acemoglu and Michael Wood- ford, vol. 26, 195–230. Chicago: University of Chicago Press.
Kim, Jin-Hyuk. 2008. “Corporate Lobbying Revisited.” Business and Politics 10:1–23.
Knight, Brian. 2006. “Are policy platforms capitalized into equity prices? Evidence from the Bush/Gore 2000 presidential election.” Journal of Public Economics 90, no. 4-5 (2006): 751-773.
Li, Hongbin, Lingsheng Meng, Qian Wang, and Li-An Zhou. 2008. “Political Connections, Financing and Firm Performance: Evidence from Chinese Private Firms.” Journal of Development Economics 87:283–99.
Meade, Janet A., and Shihong Li. 2015. “Strategic Corporate Tax Lobbying.” Journal of the American Taxation Association 37:23–48.
Milyo, Jeffrey, David Primo, and Timothy Groseclose. 2000. “Corporate PAC Campaign Contributions in Perspective.” Business and Politics 2:75–88.
Peltzman, Sam. 1976. “Toward a More General Theory of Regulation.” Journal of Law and Economics
19:211–40.
Richter, Brian Kelleher, Krislert Samphantharak, and Jeffrey F. Timmons. 2009. “Lobbying and Taxes.”
American Journal of Political Science 53:893–909.
Roberts, Brian E. 1990. “A Dead Senator Tells no Lies: Seniority and the Distribution of Federal Benefits.” American Journal of Political Science 34:31–58.
Scholes, Myron S. and Joseph T. Willliams. 1977. “Estimating Betas from Nonsynchronous Data.” Journal of Financial Economics 5(3):309-327.
Shon, John J. 2010. “Do Stock Returns Vary with Campaign Contributions? Bush vs. Gore: The Florida Recount.” Economics and Politics 22:257–81.
Skaife, Hollis A., David Veenman, and Timothy Werner. 2013. “Corporate Lobbying and CEO Pay.” Working Paper. University of California, Davis, CA, October 15.
Snyder, James. 1992. “Long-Term Investing in Politicians: Or, Give Early, Give Often.” Journal of Law and Economics 35(1):15-43.
Stratmann, Thomas. 1998. “The Market for Congressional Votes: Is Timing of Contributions Everything?”
Journal of Law and Economics 41:85–114.
Stigler, George J. 1971. “The Theory of Economic Regulation.” Bell Journal of Economics and Management Science 2:3–21.
White, Halbert. 1980. “A Heteroskedasticity- Consistent Covariance Matrix Estimator and a Direct Test for Heteroskedasticity.” Econometrica 48(4)817-838.