
1 Introduction
“Should the US increase its H-1B visa program?” was the title of a San Francisco Gate article in 2006.1 In 2020, the opposite question lies at the core of the public debate on high-skilled immigration in the United States, as the Trump administration introduces restrictions on this program. Since the early 2000s, the effect of the program on labor market outcomes of domestic workers has been the cornerstone of this issue. As visa applications are sponsored by employers, assessing whether H-1B workers are complements or substitutes for domestic employees depends on the underlying motivations of firms’ recruitment strategies. Three quarters of H-1B applications were for computer and STEM related occupations in 2018,1U.S. Citizenship And Immigration Services (2018) and U.S. tech companies have raised concerns about the lack of domestic labor supply to fill these specific positions. In his 2007 Senate testimony, Bill Gates (2007) had already highlighted the “critical shortage of scientific talent” and called for “overhauling our [U.S.] high-skilled immigration system.” This paper provides evidence suggesting that employers seek to recruit foreign workers in response to the lack of domestic labor supply in specific occupations.
In this paper, I show that employers are more likely to seek H-1B workers when they have trouble finding domestic workers. I use online job posting data to study firms’ hiring processes. I link job posting duration to employers’ willingness to search among foreign workers. I rely on fixed effects specifications and show how a given employer adapts its recruitment strategy for positions that take longer to be filled. I then explore different aspects of the recruitment process and document the role played by the lack of domestic labor supply. I conclude that a substantial proportion of employers search for H-1B workers to complement the lack of domestic labor supply.
Employers claim that they need H-1B workers to fill positions that would otherwise stay unfilled. Matching online job postings to administrative data on H-1B visa applications allows me to investigate this claim at the job level. I have collected the entire universe of job postings advertised on one of the largest
U.S. job boards (hereafter “Job Board A”),2The real name of the job board on which data have been collected is anonymized. from November 2018 onward. I collected those data every two weeks to observe when ads disappeared from the website. Computing the difference with the precise posting date allows me to measure the duration of each job posting. Job posting duration partly reflects employers’ relative difficulty in filling this position. The H-1B visa program requires firms to sponsor their workers’ visas. Employers first engage in the process by submitting a labor condition application (LCA) to the U.S. Department of Labor for each position they want to fill with a foreign worker. I match online job postings data with administrative data on LCAs sent by employers. Therefore, I observe for each job eligible for the H-1B visa program whether its employer searched for a foreign worker to fill the position.
I first show that employers are more likely to seek H-1B workers when finding domestic workers takes more time. I use a within-firm within-occupation identification strategy to compare multiple recruitment decisions made by a given employer for similar positions as defined by occupation and location. Employers can fill their vacancies by either recruiting domestic or foreign workers. Domestic workers are legally authorized to work in the U.S. This category includes U.S. citizens, U.S. permanent residents and people living and working in the U.S. with a worker visa. Foreign workers need to be sponsored to obtain an H-1B visa. This category includes workers living abroad and foreign students graduated from a U.S. university. Sponsoring an H-1B visa is costly in time and money. My results show that employers are more likely to seek foreign workers for positions that take longer to be filled. In baseline regressions, one standard deviation increase in job posting duration increases the probability to submit an LCA by 28 (1.9) percent (percentage points).
I then investigate the mechanism at play by studying the determinants of job posting duration. Employers’ search duration for a given position is determined by the relative demand and supply of domestic workers trained for this job. This relationship is a function of three components: (1) the supply of domestic workers, (2) the wages offered for this position, and (3) the potential employers’ preference for foreign workers. I explore the role played by each one of these components in the relationship between job posting duration and the probability to submit an LCA. I find evidence suggesting that the effect is partly explained by the lack of domestic workers for these occupations. On the contrary, I do not find any evidence supporting the role of wages nor the role of employers’ preferences for foreign workers.
First, job posting duration reflects the employer’s difficulty in finding the right candidate. Imbalances between labor demand and labor supply of domestic workers increase these difficulties. I document this relationship at the local labor market level. I show a positive association between labor market tightness and employers’ probability to seek foreign workers. This suggests that the lack of domestic workers explains a part of the positive relationship between job posting duration and the probability to submit a LCA.
Second, job posting duration can also result from wage offers that are too low. Offering wages below domestic workers’ reservation wage reduces the attractiveness of these vacancies, and thereby increases job posting duration. Unfortunately, I do not observe job postings’ wage offers. However, I explore this channel by comparing employers according to the wage offers they made to foreign workers. I investigate whether the effect of job posting duration on the probability to submit an LCA is driven by employers offering low wages. I do not find evidence supporting this hypothesis. On the contrary, I find that this relationship is mostly driven by employers offering a wage premium to foreign workers.
Finally, job posting duration can also result from employers’ preferences for foreign workers over domestic workers. In some cases, employers have to prove that they first undertook good faith efforts to recruit domestic workers in order to apply to the H-1B visa program. In this context, “information such as where and when the job postings were advertised, salary offered, and actual job offers and acceptances should similarly be recorded and maintained.’’3Zhang and Associates P.C US immigration lawyers and attorneys, seen on June 8th, 2020. Employers can strategically leave their vacancy online as a proof of such efforts. I explore this channel in three different ways but do not find any evidence supporting this mechanism. First, I show that employers seeking foreign workers continue to advertise their vacancies after learning that they are not granted a visa. This suggests that these employers were not only seeking foreign workers to fill their positions. Second, I focus on vacancies advertised after the H-1B application season. I document that vacancies advertised in labor markets that submitted more LCAs are also advertised longer. This shows that this relationship is not only driven by firms’ strategic behaviors. Third, I focus on specific cases where employers have an incentive to manipulate their job postings’ duration. I replicate the main specification to compare employers who face this incentive and those who do not. I find that most of the effect still holds for employers who do not face this manipulation incentive. With these three different tests, I do not find any evidence suggesting that the relationship between job posting duration and the probability to submit an LCA is driven by this channel.
The last section of the paper explores the heterogeneity of this effect across employers, occupations and time. It documents that employers’ search duration affects more hiring decisions in small firms. Consistently with the literature, it reports a larger effect for science, technology, engineering, and math (STEM) occupations. Finally, it shows that the results are mostly driven by vacancies advertised for months.
By focusing on the role of firms, this paper first contributes to the literature assessing the effect of the H-1B visa program on labor market outcomes of native workers. Most of this research has exploited quasi-random (Kerr et al., 2015, Mayda et al., 2016, and Mayda et al., 2018) or random (Peri et al., 2015 and Doran et al., 2016) experiments to investigate whether H-1B workers are complements or substitutes for natives. Papers focusing on labor market levels highlight consistent results supporting complementarity between both types of workers. On the contrary, Doran et al. (2016) provide firm-level evidence rejecting this complementarity hypothesis. By showing that firms’ demand for H-1B workers partly result from their hiring difficulties, I propose an explanation to reconcile both approaches. My results show a lack of native labor supply for jobs filled with high-skilled foreign workers.4These results complement Sparber (2015), who first provided indirect evidence on this phenomenon. It can explain, therefore, as shown by Peri et al. (2015), why cities restricted in their recruitment of H-1B workers do not hire natives instead. Simultaneously, it provides a way to understand the results of Doran et al. (2016) who show why firms do not increase their native labor force when they recruit more foreign employees. Finally, my paper also relates to the strand of research nuancing the negative effect of the H-1B visa program on wages (Mithas and Lucas, 2010, Lofstrom and Hayes, 2011, and Aobdia and Srivastava, Aobdia and Srivastava).
By introducing a new measure of firms’ hiring difficulties, this paper also contributes to the literature assessing mismatches between local supply and demand for skills. This strand of research is motivated by policy reports highlighting employers’ perception that specific skills are in short supply (Chambers et al., 1998, Deloitte and the Manufacturing Institute, 2011, Carnevale et al., 2011, Manpower Group, 2018). While aggregate data do not provide convincing evidence to support recruiters’ complaints about the lack of labor supply (Barnow et al., 2013, Capelli, 2015, Abraham, 2015), I introduce a job level measure of hiring difficulties to cope with this issue. Deming and Noray (2018) document an important turnover of workers in STEM occupations, thereby supporting the hypothesis that there is a skill shortage. Exploring labor market heterogeneity, my findings confirm the existence of recruitment challenges for these specific occupations.
Finally, this paper relates to the literature studying labor market issues using job postings data. Over the last decade, the availability of online data have been extensively used to study different aspects of labor markets. One strand of this literature exploits proprietary data collected from major job boards to study job search behaviors (Kuhn and Skuterud, 2004, Kuhn and Mansour, 2014, Kroft and Pope, 2014, Chéron and Decreuse, 2017, Marinescu, 2017, and Marinescu and Rathelot, 2018). More recently, Burning Glass Technologies has collected and assembled the near-universe of U.S. online job postings. Azar et al. (2019) and Azar et al. (2019) take advantage of this new source of information to study labor market concentration. Using the same data, Deming and Kahn (2017) investigate variations in skills demanded by employers. My contribution to this literature is twofold. First, I extend its scope to the study of migrations. This paper thus complements Anastasopoulos et al. (2019), who first introduced the use of newspaper vacancy data in this field. Second, I focus on the duration dimension, which is usually overlooked.
Collecting my own data over time allows me to observe the online duration of each ad. I report an average duration close to 1.5 months. This result diverges from what Davis and de la Parra (2017) find using DHI data, an industry and occupation specific job board. However, it is perfectly in line with the results of Davis et al. (2014) for Germany. This suggests that my measure of job posting duration reflects the length of firms’ recruitment processes.
2 The H-1B visa program: Context
The H-1B visa program represents the main alternative to the recruitment of domestic workers. But recruiting a foreign worker under an H-1B visa is costly in both money and time, and it is very uncertain. First, visas are sponsored by firms. Second, recruiting H-1B workers take time. Finally, the number of visas awarded is subject to a quota. This section explains why these characteristics must be taken into account when studying employers’ recruitment strategies.
H-1B is an employer driven program that offers one of the main opportunities to recruit foreign workers with at least a bachelor degree. Contrary to most other types of visas, foreign workers first have to find an American employer willing to hire them. This company then submits a visa application on behalf of the worker. By applying to hire the foreign worker through this procedure, the employer agrees to manage the visa application and to pay its cost. This includes both visa fees and attorney’s fees as firms usually employ attorneys to deal with the administrative procedure. The U.S. General Accounting Office (2011) estimates the average cost per visa between $2,320 and $7,500. If obtained, an H-1B visa holds for three years and can be renewed once.
Figure 1. Timeline of the H-1B application process during fiscal year 2019
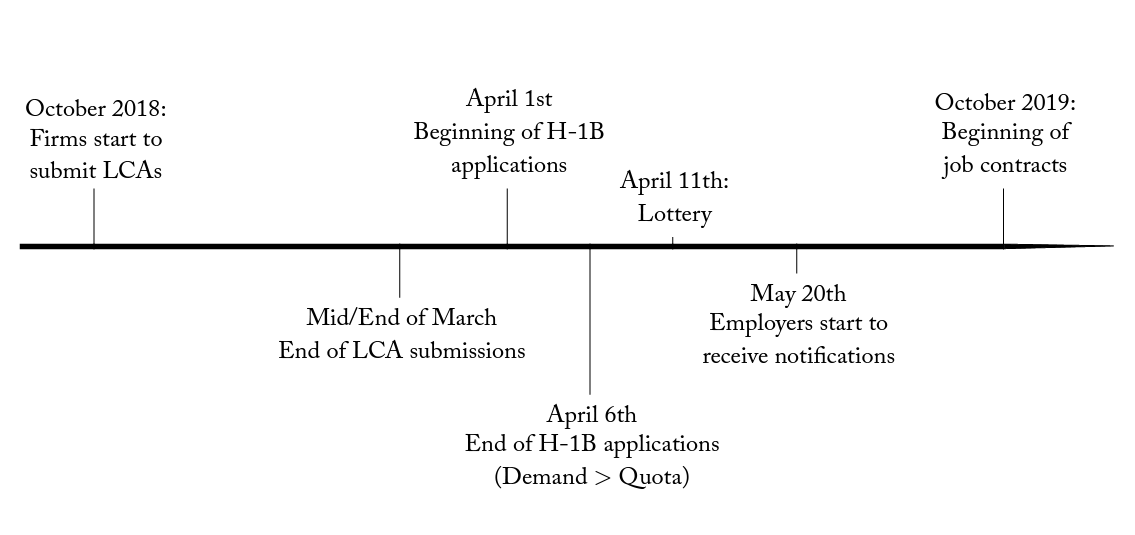
Notes: This graph presents the timeline of the H-1B application process for fiscal year 2019. Fiscal years start and finish in October of each year. The process takes place in fiscal year 2019 in order to obtain visas valid from the beginning of fiscal year 2020 to the end of fiscal year 2022. There are two steps. First, employers submit a labor condition application to the U.S. Department of Labor from October 2018 to March 2019. Second, employers send an I-129 form to U.S. Citizenship and Immigration Services. This second step starts on April 1, 2019.
The H-1B program is subject to a quota. This results in a recruitment timing way longer than usual. 1 details this specific timing. First, U.S. visas are delivered once per fiscal year through a lottery. Employers have to apply in March at the latest, but new H-1B holders can only start their job contract in October. During this period, the visa application process consists of two steps. Employers first submit an LCA to the Department of Labor. They thereby signal their willingness to search among foreign workers. This document allows the administration to check that the job is eligible for the H-1B visa program and that the foreign worker will have same working conditions as domestic workers. Employers send this first package between October and mid-March, then wait for the approval of the Department of Labor. Then recruiters can formally apply to the U.S. Citizenship and Immigration Administration to obtain an H-1B visa. This second step starts on April 1 and lasts until the quota is reached. Since 2014, firms’ applications have exceeded the 85,000 cap during the first week of April every year. To deliver the visas, the administration only selects applications received during this first week and runs a lottery by the middle of April. Employers learn about the result of the lottery between mid-May and mid-June. Finally, winning applicants can start their job contract by the first of October.
The H-1B quota also makes recruitment outcomes very uncertain. Between 2017 and 2019, the likelihood of obtaining a visa ranged from 36 to 45 percent.5Author’s computation based on USCIS data. The uncertainty associated with the recruitment of workers under H-1B visas increased even more under the Trump administration. Anderson (2020) documents the increase in the rate of denied applications.
These characteristics of the program have two key implications. First, the number of foreign workers coming to the U.S. depends on firms’ demand. Second, H-1B workers are more costly than domestic employees. This suggests that recruiting foreign workers only makes sense when domestic workers are not available, or when foreign workers bring additional benefit to employers. In this paper, I present different pieces of evidence suggesting that employers’ demand for foreign workers partly results from the lack of domestic labor supply.
3 Data
In this paper, I identify positions for which employers seek foreign workers by matching job postings with administrative data on LCA submissions. This original dataset simultaneously observes employers’ search duration and recruitment strategy. This section first details the procedure by which I merged both sources at the job level. It then presents the dataset and explores the representativeness of LCAs matched with job postings. Finally, this section describes the measure of job posting duration.
3.1 Matching procedure
The matching procedure relies on three pieces of information to identify both job posting and LCA referring to a given position: the location of the job, the name of the company, and the job title. This procedure may be subject to measurement errors when job postings or visa applications are duplicated. However, it represents a second best option in the absence of a common identifier. This analysis takes advantage of LCAs released by the U.S. Department of Labor. These administrative data detail each position for which an employer initiated a procedure to apply for an H-1B visa from October 2018 to March 2019. It includes therefore these three pieces of information. And any job posting advertised online must also specify at least this same information. For this analysis, I have collected the entire universe of job postings advertised on one of the largest U.S. job boards (hereafter ”Job Board A”), using their Application Programming Interface (API) from November 2018 to the end of June 2019.
For any job advertised on Job Board A, the matching procedure checks whether there is an associated LCA. The algorithm first focuses on the location dimension. Because some ads refer to the city (e.g., New York City) while other refer to their borough (e.g., Manhattan), I first translate the location information into Core Based Statistical Area (CBSA) codes corresponding to commuting zones. For each area, the algorithm then identifies a subset of companies included in both online and administrative data. Regarding the firm dimension, both datasets have to be harmonized. As both of them are collected in different contexts, firms can be called slightly different names across sources (e.g., “Facebook” and “Facebook, Inc.”). To fix this issue, I first get rid of usual suffixes before to compute a similarity score between each pair of company names.6This similarity score is computed using a Jaccard algorithm relying on a bigram method. It is computed with the matchit command in Stata 14. I only keep pairs whose score exceeds 80% of similarity between both strings. I then manually check whether both names refer to the same employer. For the sake of analysis, any pair of firms for which doubt remains is categorized as dissimilar. Finally, the algorithm focuses on the subsample of firms identified as similar across both datasets and looks for identical jobs. Once again, both documents often refer to a same job with slightly different job titles. Quite often, job postings display more precise job titles than LCAs. I identify similar jobs when job titles are the same or when the LCA job title is a subpart of the online job title. At each step, this matching procedure adopts a conservative strategy that mechanically increases the number of false negatives. This tends, if anything, to create a downward bias pulling my estimator toward zero. My estimate of interest tests whether recruitment duration increases the probability that a job posting is associated with an LCA. Therefore, my positive estimate can be interpreted, if anything, as a lower bound scenario.7Appendix A details the relationship between matching issues and estimate biases. Note that the analysis relies on the assumption that the ad duration is uncorrelated with these matching issues.
3.2 Sample description
After matching job postings to LCAs, my dataset contains 113,351 job postings collected by Job Board A on 1,493 employers’ career pages. 7,770 of these ads are matched with an LCA. This dataset only includes jobs whose occupations are eligible for the H-1B visa program, as observed in the LCAs. This paper relies on within-firm within-occupation specifications. Thereby, it exploits variations driven by 753 employers who advertise more than one job per occupation. I classify jobs by occupation using the U.S. Department of Labor algorithm. This procedure matches job titles to occupation groups. I take advantage of job categories referenced online by Job Board A to impute occupations. I take into account the limitations of this algorithm and only exploit information for major and minor groups of occupations as defined by the U.S. Standard Occupation Classification (SOC). Appendix B details this classification.
By applying these data restrictions, this sample focuses on only 2 percent of LCAs submitted in fiscal year 2019. However, this sample is fairly representative of all LCAs in terms of occupations. Figure 2 compares the distribution of occupations across LCAs. Dark grey bars represent LCAs matched with job postings. Light grey bars represent the other LCAs. This graph highlights that 70 percent of all LCAs are submitted for computer and mathematical occupations. The rest are distributed across management, business and financial, architecture and engineering, and other occupations. Figure 2 reports small variations across both groups. But overall, both datasets are fairly similar with respect to this dimension.
Figure 2. Distribution of occupations across LCAs
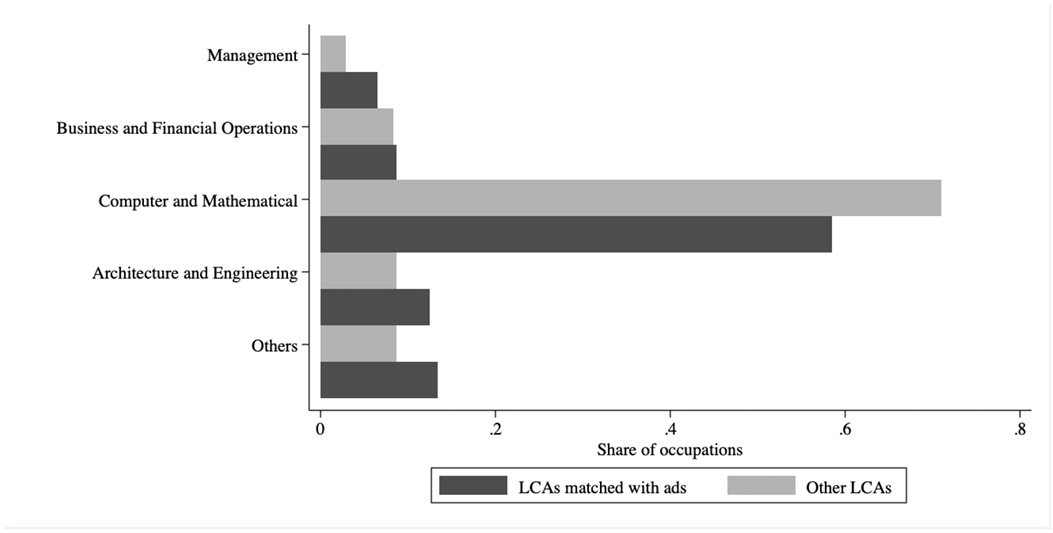
Notes: This graph compares the distribution of occupations between two groups of LCAs. Occupations are defined according to the U.S. SOC. Dark grey bars represent LCAs matched with job postings. The lighter grey bars represent the other LCAs. This figure focuses on occupation groups that account for more than 5 percent of all LCAs.
Source: U.S. Department of Labor.
Figure 3. Distribution of industries across LCAs
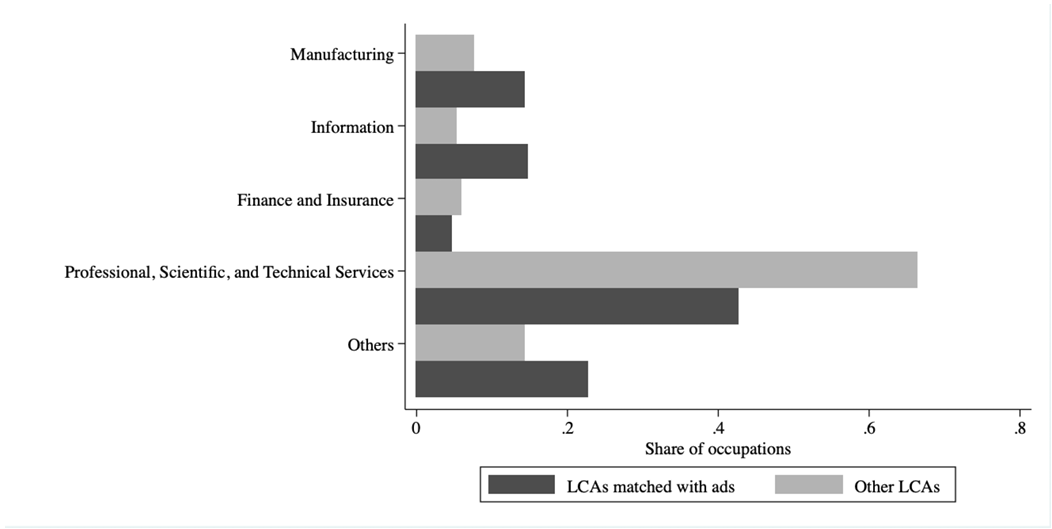
Notes: This graph compares the distribution of industries between two groups of LCAs. Industries are defined according to the NAIC. Dark grey bars represent LCAs matched with job postings. Grey bars represent other LCAs. This figure focuses on industries that account for more than 5 percent of all LCAs.
Source: U.S. Department of Labor.
Distributions by industry diverge more. Figure 2 compares these distributions across both groups of LCAs. This graph highlights that 70 percent of LCAs are submitted for positions in the professional, scientific, and technical services. Other LCAs are mostly submitted by companies in manufacturing, information, and finance and insurance. Compared to the full set of LCAs, those matched with job postings are more evenly distributed across industries.
3.3 Job posting duration
This paper relies on job posting duration to measure the length of recruitment processes. This section first details the measure of job posting duration. It then presents data characteristics that make this proxy relevant.
Figure 4. Distribution of job posting duration
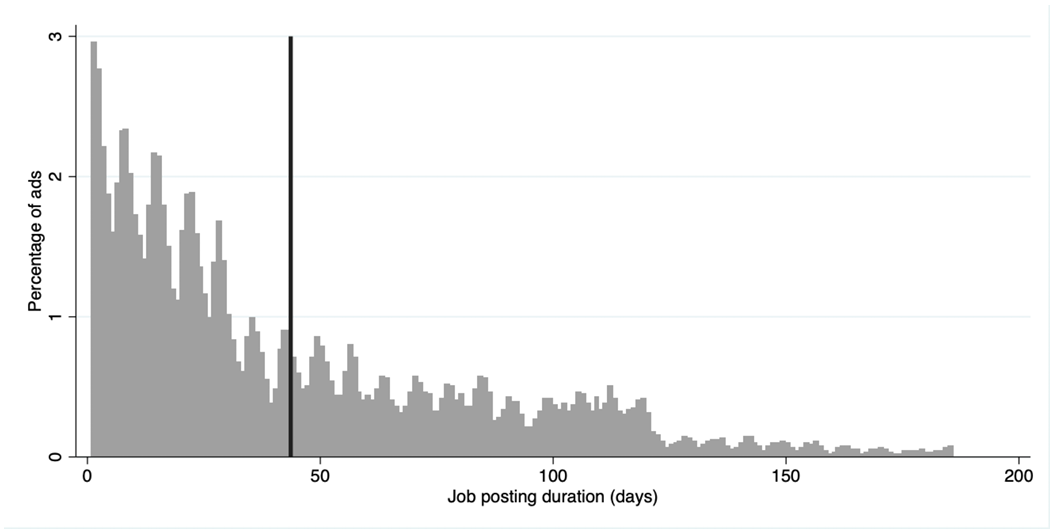
Notes: This graph presents the distribution of job posting duration on Job Board A. It relies on job posting data collected from November 2018 to March 2019. The black vertical line represents the average. The distribution ranges from 1 to 186 days with an average of 44 days. Because data was collected every two weeks, this graph is subject to up to two weeks measurement error.
Source: Job Board A.
I collected job postings data every two weeks from November 2018 to July 2019 using a web-scraping look-alike algorithm to measure job postings’ duration. Rather than connecting directly to the website, the script takes advantage of the Application Programming Interface (API) of Job Board A. This API aims to deliver job posting data to app developers continuously. This allows me to incorporate a longitudinal feature to my dataset by collecting information successively over time. This data reports the exact posting date of each ad. By collecting data every two weeks, I create a panel where I observe ads that have been removed between two crawling waves. I compute job posting duration as the difference between removing and posting dates. Note that this measure is subject up to two weeks measurement error due to the time interval separating two waves of data collection. Figure 4 presents the distribution of this duration measure. Its values range from one day to six months. The average job posting duration on Job Board A data is 44 days.
I collected data on Job Board A to ensure that job posting duration is an accurate proxy for the length of recruitment processes. Job Board A is an aggregator of job ads. Unlike other job boards, it directly collects job postings from career pages of the largest companies in the United States. I focus on these specific ads that mirror the information available on firms’ career pages. This specificity gets rid of the financial incentive influencing employers’ behaviors on other job sites. On these platforms, employers usually post their ad for a fixed duration. After the duration is elapsed, they face a second decision: removing their job posting from the website or contracting for another time period. The cost of these contracts is likely to influence their strategic decision. On the contrary, the marginal cost of advertising a vacancy on their own career page is almost null. Therefore, relying on the career page information to approximate the recruitment duration is more accurate. This could also explain the difference between my measure of average job posting duration and that in Davis and de la Parra (2017). The average duration on Job Board A is five times larger then what they find on Dice.com. Because employers directly post their ad on Dice.com, they face the financial incentive that they do not have on their own career page. In addition, the average job posting duration on Job Board A is fairly similar to the mean recruitment duration of 34 working days observed by Davis et al. (2014) in Germany.
Note that ads do not last forever on employers’ career pages. Even if financial incentives to remove vacancies from these pages are almost null, figure 4 also shows that employers voluntarily remove an ad after 44 days, on average. Overall, these lines of evidence suggest that job posting duration is an accurate proxy for the length of the recruitment processes.
Figure 5. Job posting duration across major groups of occupations
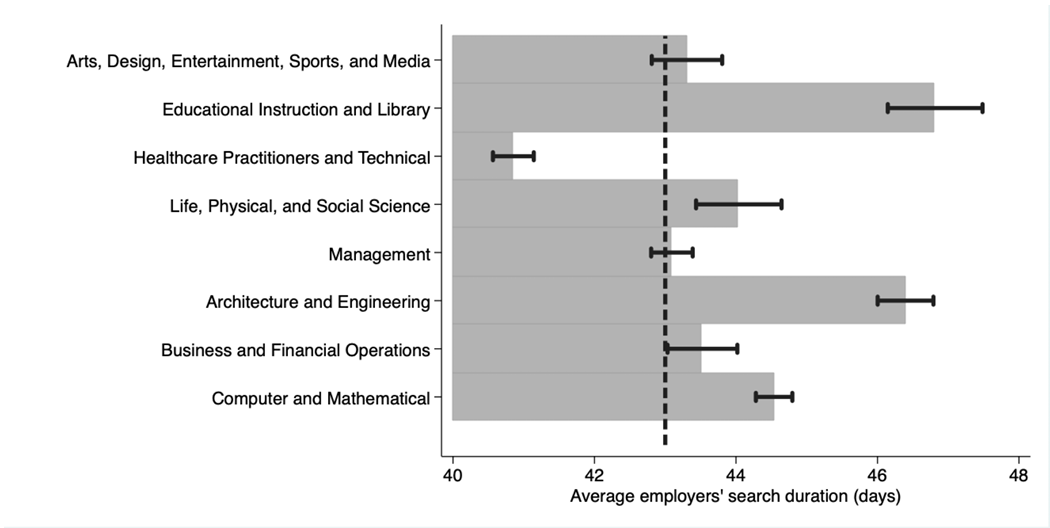
Notes: This graph presents the average job posting duration across major groups of occupations. It focuses on the eight most important groups within the job postings database. Grey bars represent the average duration. Black whiskers depict confidence intervals. The black dashed vertical line represents the mean of the whole sample. Black whiskers represent 95 percent confidence intervals. Average job posting duration ranges from 41 days for healthcare practitioners and technical occupations to 47 days for educational instruction and library jobs.
Source: Job Board A.
Interpreting job posting duration as the time needed to fill vacancies, figure 5 compares average job posting durations across the eight largest groups of occupations represented on Job Board A. It highlights a six-day range from the bottom to the top of the duration distribution. According to this graph, healthcare practitioners and technical occupations are the fastest to fill their vacancies. Educational instruction and library jobs take on average one additional week to find the right candidate. Finally, figure 5 highlights the relative difficulties of STEM jobs to fill their positions. Among the four groups of occupations with the longest job posting duration, three belong to the STEM category (i.e., computer and mathematical; architecture and engineering; and life, physical, and social sciences occupations).
4 Within-firm within-occupation identification strategy
This paper builds on a within-firm within-occupation identification strategy. This specification compares multiple recruitment decisions made by a given employer for similar vacancies that differ by their job posting duration. This section first details the main specification. It then presents the results.
4.1 Econometric specification
The within-firm within-occupation specification tests whether employers are more likely to seek foreign workers for positions advertised longer. This approach gets rid of variations associated with recruitment differences between employers and between occupations. Specifications control for geographic specificities of labor markets as companies are located in several cities. Finally, the analysis takes job posting date into account to compare vacancies that are as similar as possible. The main specification is the following:
(1) ![\begin{eqnarray*} \text{Pr[LCA}_{j}=1] &=& \beta_1 + \beta_2 \text{Duration}_{j} + \varepsilon_{eo(j)} + \lambda_{l(j)} +\delta_{d(j)} + u_j, \end{eqnarray*}](https://www.thecgo.org/wp-content/ql-cache/quicklatex.com-af68323039d21037f4897fa530f10e9f_l3.svg "Rendered by QuickLaTeX.com")
where the dependent variable corresponds to the probability of sending an LCA for a given position  . This specification focuses on the ad duration of position , denoted
  . Finally,
  represents the employer-occupation fixed effects,
  the location fixed effects,
  the polynome controlling for posting date and
  the error term. By including this set of controls, the coefficient of interest
  compares jobs similar in all these dimensions but job posting duration. The coefficient associated with job posting duration tests whether employers’ search duration affects their probability of seeking a foreign worker to fill that given position.
4.2 Results
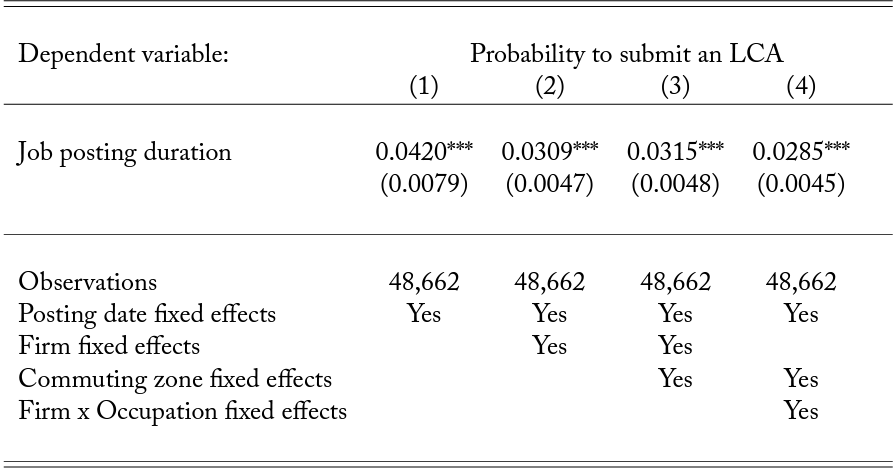
This section shows that employers are more likely to seek foreign workers when finding domestic workers takes more time. Table 1 presents the results of the specification presented above. This table progressively increases the number of controls to compare vacancies as similar as possible. All specifications take posting dates into account through fixed effects. Therefore, they control for time-specific shocks and reduce noise in the duration measure. Column (2) introduces employer fixed effects. Thereby, it gets rid of variations associated with employers’ preference for foreign workers and reduces the estimated relationship between job posting duration and the probability to submit an LCA. The two last columns refine this estimate by comparing recruitment decisions taking place in similar labor markets. Column (3) narrows the analysis within commuting zones. Column (4) presents the main specification presented above.
Table 1. Employers are more likely to seek foreign workers to fill positions advertised longer.
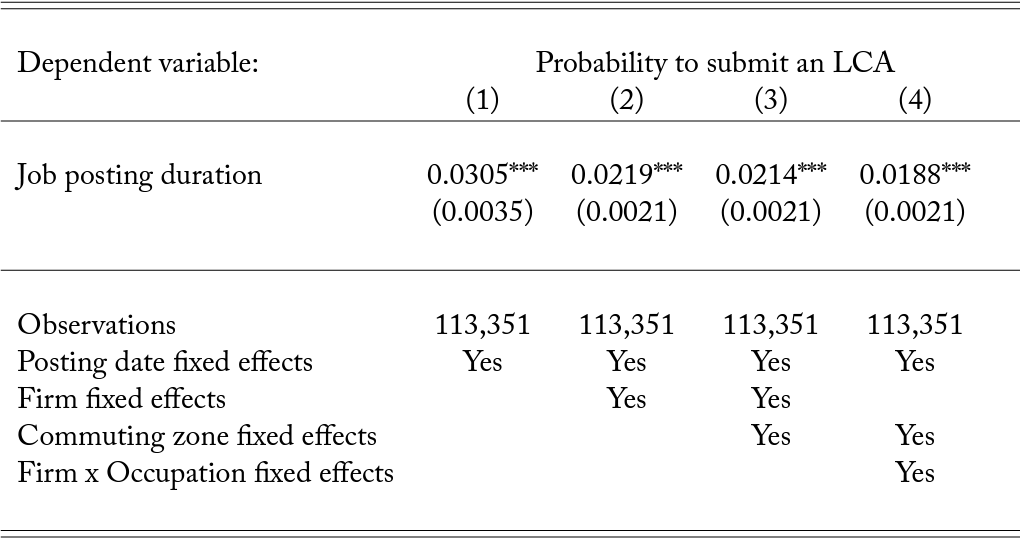
Notes: Standard errors in parentheses, *** p<0.01, **p<0.05, *p<0.1. This table presents the relationship between the probability to submit a labor condition application for a given job and its job posting duration. It reports average marginal effects from linear probability estimations. The measure of job posting duration is standardized. Standard errors are clustered at the firm level.
Source: Job Board A and U.S. Department of Labor.
Column (4) compares multiple recruitment decisions made by a given employer for similar vacancies that differ by their job posting duration. It shows that on average, one standard deviation increase in job posting duration increases the probability to submit an LCA for this given job by 1.88 percentage points. This corresponds to a 28 percent increase in the probability to submit an LCA. Thereby, it documents the positive relationship between employers’ search duration and the decision to seek foreign workers
4.3 Robustness
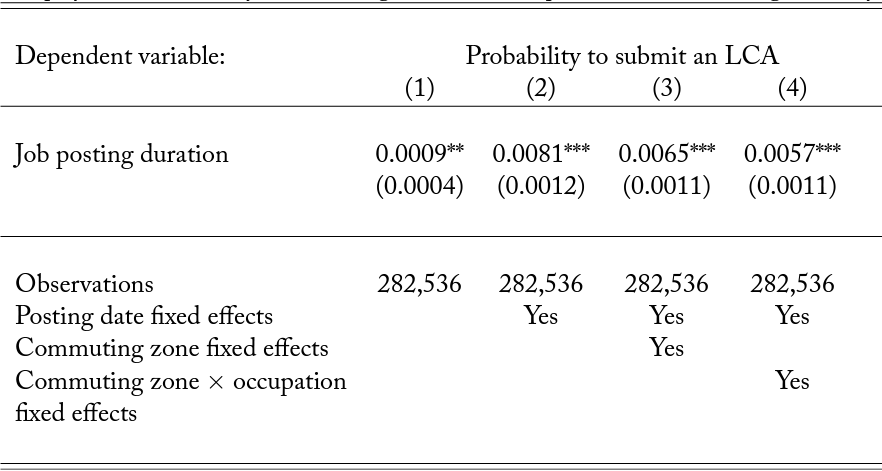
This section supports the external validity of the results. It takes all firms observed on Job Board A into account and provides additional evidence of the positive relationship between job posting duration and the probability of submitting an LCA. Thereby, it addresses one limit of the within-firm within-occupation identification strategy. On the one hand, the within-firm within-occupation approach gets rid of all employer-occupation specific variations. But on the other hand, it restricts the sample to a subset of firms that submitted at least one LCA. Table 2 presents the results for all firms. It no longer controls for employer fixed effects but still shows a positive relationship between job posting duration and the probability to submit an LCA.
This robustness analysis builds on an extended sample that contains 578,351 positions advertised by 4,424 employers. Data restrictions are similar to the main sample. The only difference relates to employers. This robustness sample also keeps employers with no job posting matched with an LCA. Obviously, this robustness sample fully includes the main sample presented above.
Table 2 presents a positive and significant relationship between job posting duration and the probability to submit an LCA for all firms. It progressively introduces posting date, commuting zone and commuting zone × occupation fixed effects. Standard errors are clustered at the local labor market level where each market is defined by a commuting zone and a major occupation group.
Table 2. Employers are more likely to seek foreign workers to fill positions advertised longer.
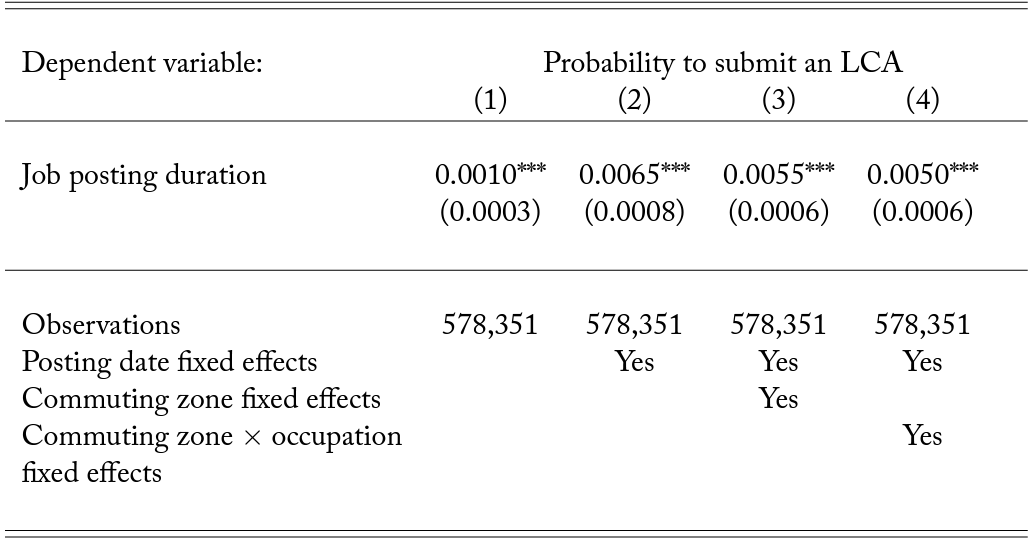
Notes: Robust standard errors in parentheses, *** p<0.01, **p<0.05, *p<0.1. This table presents the relationship between the probability to submit a labor condition application for a given job and its job posting duration. It reports average marginal effects from linear probability estimations. The measure of job posting duration is standardized. Standard errors are clustered at the firm level.
Source: Job Board A and U.S. Department of Labor.
These results support the external validity of table 1. However, magnitudes differ across tables. This can be noted by comparing the second column of table 2 to the first column of table 1 where results only differ by sample size. One explanation comes from the matching procedure. The robustness sample includes employers with no job posting matched with an LCA. Thereby, this sample extension mechanically increases, if anything, the number of false negatives (i.e., job postings not matched with an LCA while they should be). Appendix A shows that an increasing number of false negatives can explain this magnitude difference as it biases the relationship between job posting duration and the probability to submit an LCA toward zero.
5 Mechanism
This section explores the mechanism explaining why employers are more likely to seek foreign worker
s when finding domestic workers takes more time. Employers’ search duration for a given position is determined by the relative demand and supply of domestic workers trained for this job. This relationship is a function of three components: (1) the supply of domestic workers, (2) the wage offered for this position, and (3) the potential employers’ preference for foreign workers. I explore the role played by each one of these components in the relationship between job posting duration and the probability to submit an LCA. The first part presents evidence suggesting that the effect is partly explained by the lack of domestic workers for these occupations. In the second and third parts, I do not find any evidence supporting the role of wages nor the role of employers’ preferences for foreign workers.
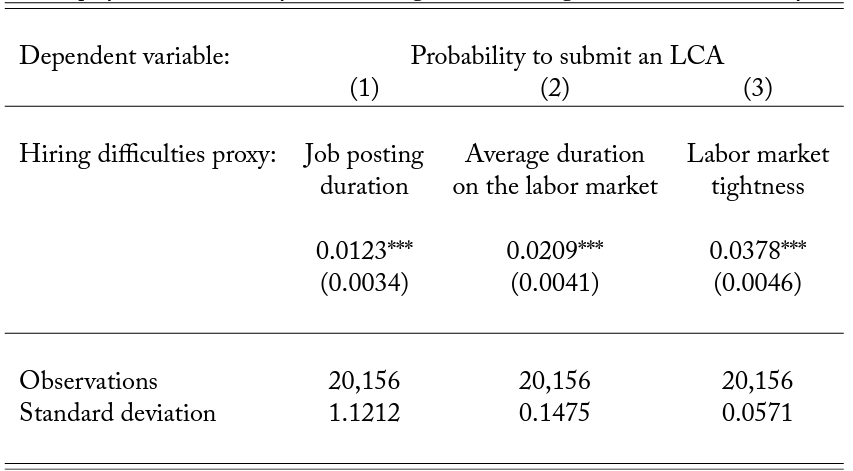
Table 3. Employers are more likely to seek foreign workers in tight labor markets.

Notes: Robust standard errors in parentheses, ***p<0.01, **p<0.05, *p<0.1. This table presents correlations between the probability to submit a labor condition application and different proxies of hiring difficulties. Job posting duration is the online duration of a given job . Average duration on the labor market is the duration of all jobs belonging to the same group of occupations and commuting zone as job . Labor market by commuting zone and major group of occupations. This table reports average marginal effects from linear probability estimations. All measures of hiring difficulties are standardized.
Source: Job Board A and U.S. Department of Labor.
5.1 Lack of domestic labor supply
I first provide evidence suggesting that the relationship between job posting duration and the probability to submit an LCA is partly driven by the relative lack of domestic supply. Section 3 documents the link between job posting duration and the duration of the hiring process. In this section, I study the relationship between three measures of hiring difficulties and the probability to submit an LCA. Table 3 reports similar results obtained with job posting duration, average ads duration per labor market, and labor market tightness.
For a given position, job posting duration is determined by two things: (1) relative labor demand and labor supply; and (2) the employer’s strategic behavior that has nothing directly to do with relative labor demand and labor supply. I use two other measures of hiring difficulties, besides that job’s posting duration, at the local labor market level to investigate the role played by the lack of domestic workers.
The first measure is the average duration of the other job postings advertised on the same local labor market. Local labor markets are defined by commuting zone and major group of occupations. Exploiting variations at the local labor market level intends to reduce variations associated with firms’ strategic behaviors. Average duration is separately computed for each job posting in order to exclude the duration of each given job posting.
The second measure is the local labor market tightness. This is the classic indicator of hiring difficulties in the job search literature (Phelps, 1970, Pissarides, 1974). This index is defined as the ratio between the number of job postings on a specific local labor market and total employment in this same market. Total employment is observed through Occupational Employment Statistics. The Open Skills Project provides the total number of job postings per labor market. However, this external data source introduces missing values for some pairs of commuting zone and occupation. This reduces the sample size to 45,515 positions advertised by 1,066 employers. Appendix C provides more details on the index computation.
Table 3 reports positive and significant estimates across all three columns. These correlations suggest that employers are more likely to seek foreign workers when they have trouble finding domestic workers first. These estimates are raw correlations. I do not introduce any control. However, the results are consistent with each other. They are even fairly similar across columns (2) and (3).
5.2 Low wage offers
Job posting duration can also be affected by wage offers. Offering a wage offer below the reservation wage of domestic workers decreases the attractiveness of the position and increases the time needed to fill it. This section investigates whether the relationship between job posting duration and the probability to submit an LCA is driven by this phenomenon. I replicate the within-firm within-occupation specification and test whether the estimates presented above are driven by employers offering low wages. I do not find any evidence supporting this channel.
I test the wage channel using LCA information on wage offers made to foreign workers. I use this information because I do not observe job posting wage offers. However, LCA wage offers allow me to distinguish two types of employers. These wage offers are regulated by law. According to the U.S. Department of Labor, employers must pay H-1B workers “at least the local prevailing wage.”8The Employer Law Guide edited by the U.S. Department of Labor states that the employer must “pay the nonimmigrant workers at least the local prevailing wage or the employer’s actual wage.” Hira and Gopalaswamy (2019) note that “the actual wage requirement has never been enforced” making “prevailing wage […] the sole binding constraint.” This is why I focus on prevailing wage. Prevailing wages are computed by the U.S. Department of Labor and depend on geographic location, occupation, and skill level. I distinguish employers making wage offers, as defined by prevailing wages, to foreign workers from employers making more generous wage offers. I assume that employers that offer the lowest wages to foreign workers are also those who offer the lowest wages to domestic workers.
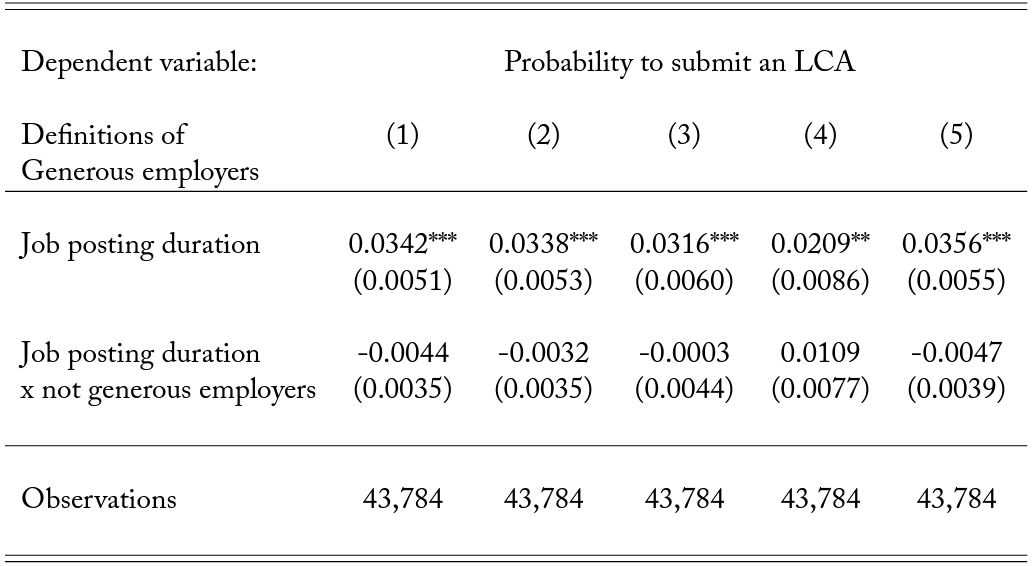
I test the wage channel by introducing a heterogeneity dimension in the within-firm within-occupation specification. I distinguish the relationship between job posting duration and the probability to submit an LCA across generous and not-generous employers. This test investigates whether my estimate is driven by not-generous employers. Table 4 considers several definitions of generous employers. Column (1) defines as generous those employers who offer a wage premium on top of prevailing wages to foreign workers. Following columns progressively restrict this definition. Column (2) defines as generous those employers offering a wage premium larger than 1 percent of the annual wage on top of prevailing wages. In columns (3) and (4), the wage premium thresholds are respectively set to 5 and 10 percent of the annual wage. Finally, column (5) defines as generous those employers who offer wages larger than the local average wage defined by occupation and measured via the Occupational Employment statistics. By restricting the definition of generous employers, table 4 progressively reduces the number of employers in this category.
Table 4 rejects the role of not-generous employers in the relationship between job posting duration and the probability to submit an LCA. The results are consistent across all definitions of generous employers. It shows that the effect is not driven by employers offering low wages. Thereby, it does not provide any evidence suggesting that low wage offers are driving the estimates presented in table 1.
Table 4. The relationship between job posting duration and LCA submission is driven by generous employers.
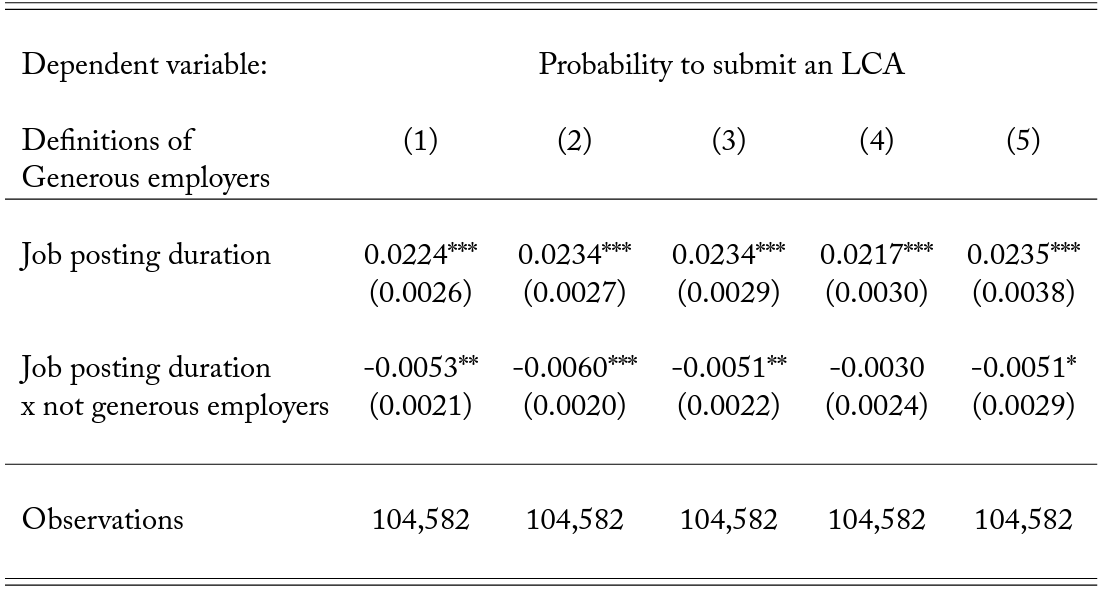
Notes: ***p<0.01, **p<0.05, *p<0.1. Robust standard errors in parentheses. This table compares the relationship between job posting duration and LCA submission across two types of employers. First line estimates present the result for generous employers. Second line estimates present the results for non-generous employers. Column (1) defines as generous those employers who offer a wage premium on top of prevailing wages to foreign workers. Following columns progressively restrict this definition. Column (2) defines as generous those employers offering a wage premium larger than 1 percent of the annual wage on top of prevailing wages. In columns (3) and (4), the wage premium thresholds are respectively set to 5 and 10 percent of the annual wage. Finally, column (5) defines as generous those employees who offer wages larger than the local average wage defined by occupation and measured via the Occupational Employment statistics. All regressions control for posting date, commuting zone, and firm-occupation fixed effects.
Source: Job Board A and U.S. Department of Labor.
5.3 Employers’ preferences for foreign workers
Job posting duration could also be affected by employers’ preferences for foreign workers. If employers prefer foreign over domestic workers, they could adopt a strategic behavior when advertising their vacancies. In particular, they could intentionally keep their domestic advertisements open in order to fulfill the requirements of applying for an H-1B. This section investigates this channel in three ways. First, I show that employers who are looking for both domestic and foreign workers still continue to seek domestic workers when they can no longer recruit foreign workers. Second, I document that vacancies posted after the H-1B application season need more time to be filled in labor markets that submitted more LCAs. Third, I show that the relationship between job posting duration and the probability to submit an LCA is not driven by employers who have incentives to manipulate their job posting duration. Overall, I do not find any evidence of employers’ preferences for foreign over domestic workers.
Figure 6. Comparing the share of ads still online after the lottery
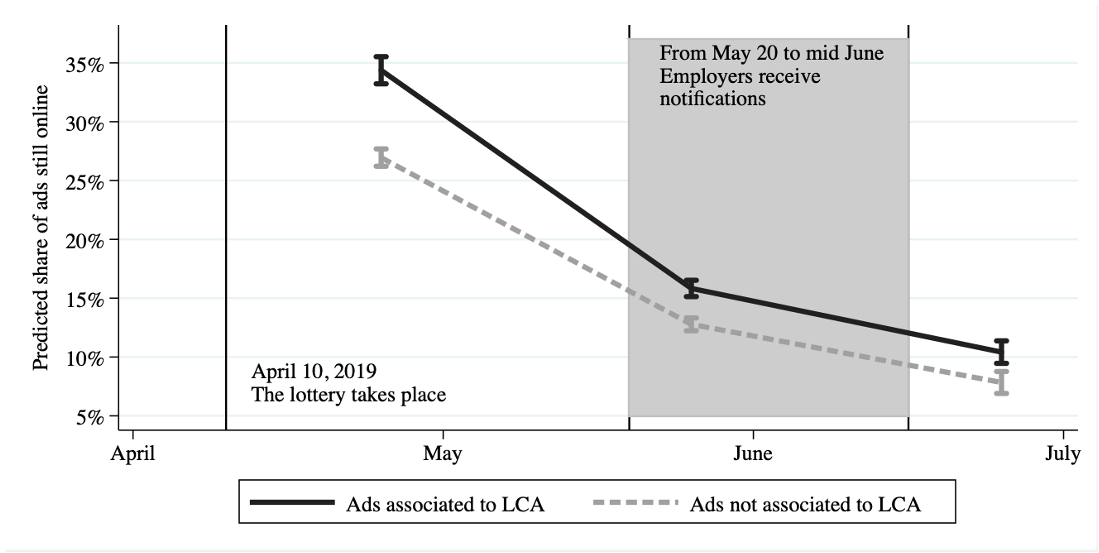
Notes: This graph studies the probability for a job ad to be still online after the lottery awarding H-1B visas took place. It compares job postings for which the employer has submitted an LCA to other job postings. It reports predicted probabilities estimated with ordinary least squares. The dependent variable is a dummy variable indicating if the vacancy was still online at each period. The main independent variable is a dummy variable distinguishing vacancies associated with an LCA from other vacancies. All regressions control for commuting zone and occupation fixed effects. They also control for the date at which vacancies were posted online in a linear way.
Source: Job Board A and U.S. Department of Labor.
I first investigate employers’ preferences for foreign workers by studying their firms’ posting strategies. I focus on the period at which the H-1B season ends. Thereby, I test whether employers that were looking for foreign workers stop advertising their ads after learning that they can no longer recruit a foreign worker. Considering all relevant jobs advertised between November 2018 and March 2019, I study the rate at which ads are removed from Job Board A between April and June 2019. Figure 6 compares removal rates between ads associated with an LCA and all other ads. This graph highlights a similar evolution across both groups of ads. This suggests that employers that submitted an LCA were not only looking for foreign workers in the first place. Otherwise, we would expect from them to stop advertising their vacancies after learning that they cannot recruit a foreign worker. Overall, this does not suggest that employers have intrinsic preferences for foreign workers.
I then explore whether a correlation between job posting duration and LCA submission holds independently from employers’ strategic behaviors related to the H-1B application process. I use additional data collected between April and June 2019 on Job Board A to measure labor market average job posting durations computed from new ads posted from April 2019 onward. By definition, this measure of job posting duration is independent from the H-1B application process. I relate this measure to the number of LCAs previously submitted per local labor market between October 2018 and March 2019. Table 5 presents this correlation. Column (1) considers all occupations. Columns (2) to (5) focus on specific groups of occupations. All columns report positive and significant correlations. On average, one standard deviation increase in job posting duration is associated with 10 additional LCAs submitted. This table documents important variations across groups of occupations. This correlation increases by a factor of eight for computer and mathematical occupations. Overall, this table documents that vacancies posted after the H-1B application season need more time to be filled in labor markets that submitted more LCAs.
Table 5. Relationship between job posting duration and LCAs submissions after April 2019
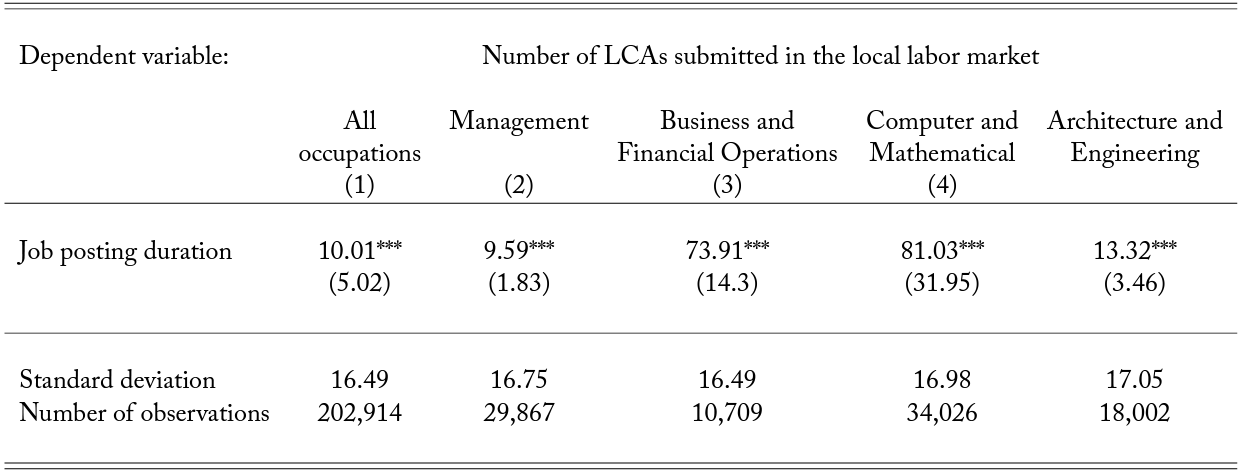
Notes: ***p<0.01, **p<0.05, *p<0.1. Standard errors in parentheses. This table presents the correlation between the average job posting duration and the number of LCAs submitted per local labor market. Local labor markets are defined by major group of occupation and commuting zone. It measures job posting duration on vacancies posted from April 2019 onward. All columns control for occupation and commuting zone fixed effects.
Source: Job Board A and U.S. Department of Labor.
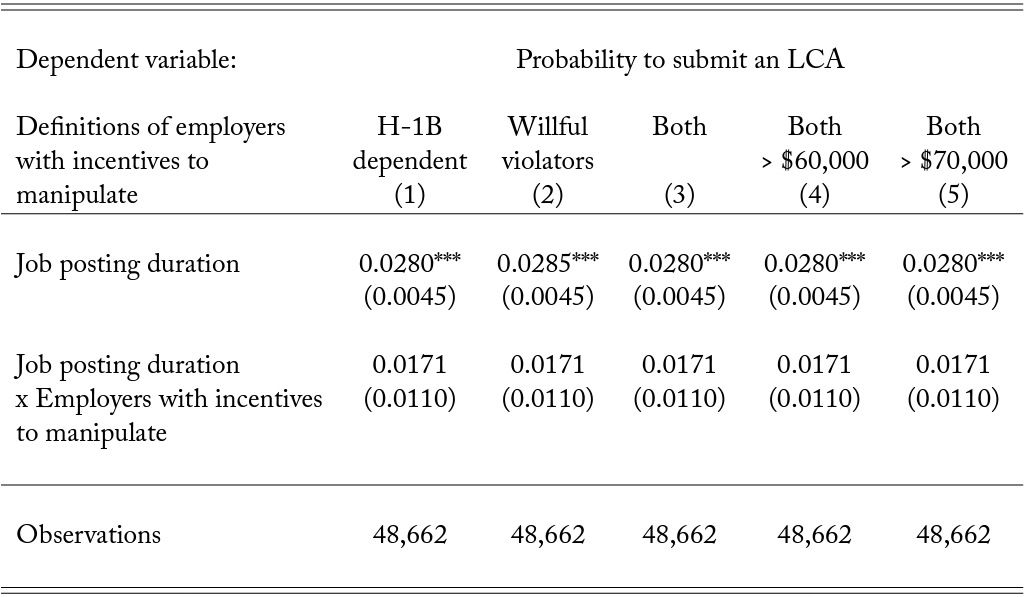
Table 6. The relationship between job posting duration and the probability to submit an LCA is driven neither by H-1B dependent nor by willful violator employers.

Notes: ***p<0.01, **p<0.05, *p<0.1. Robust standard errors in parentheses. This table presents the relationship between the probability to submit a labor condition application for a given job and its job posting duration. In particular, it explores the heterogeneous effect of job posting duration between H-1B dependent and willful violator employers and other employers. An H-1B dependent employer is, generally, one whose H-1B workers comprise at least 15 percent of the employer’s full-time equivalent employees. Willful violators of H-1B rules are employers who have “committed either a willful failure or a misrepresentation of a material fact” in LCA attestations. Column (1) separates H-1B dependent employers from the others. Column (2) distinguishes willful violator from other employers. Column (3) gathers H-1B dependent and willful violator employers in one category opposed to the rest of employers. Column (4) restricts the category of employers who have an incentive to manipulate their job posting duration to H-1B dependent and willful violator employers whose average LCA’s wage is larger than $60,000 per year. Column (5) increases this threshold to $70,000. The table reports marginal effects estimated from linear probability estimations. All regressions control posting date, commuting zone, and firm-occupation fixed effects. The measure of job posting duration is standardized. Standard errors are clustered at the firm level.
Source: Job Board A and U.S. Department of Labor.
I explore this channel by introducing a heterogeneity dimension in the within-firm within-occupation specification. I distinguish the relationship between job posting duration and the probability to submit an LCA across H-1B dependent and willful violator employers and other employers. This test investigates whether my estimate is driven by the first category of employers. The U.S. Department of Labor’s employment law guide defines an H-1B dependent employer as “one whose H-1B workers comprise at least 15 percent of the employer’s full-time equivalent employees.” Willful violators of H-1B rules are employers who have “committed either a willful failure or a misrepresentation of a material fact” in LCA attestations. LCAs identify H-1B dependent and willful violator employers. I match this information with job postings at the employer level.
Finally, I investigate whether the relationship between job posting duration and the probability to submit an LCA is driven by employers who have incentives to manipulate their job posting duration. H-1B dependent employers and willful violators of the H-1B rules have a specific incentive to manipulate their job posting duration. These specific employers must follow additional rules in order to apply for H-1B visas. The employment law guide specifies that “the employer, before petitioning for H-1B status for any alien worker pursuant to an H-1B LCA, took good faith steps to recruit U.S. workers for the job for which the alien worker is sought.”9U.S. Department of Labor, Employment Law Guide, Work Authorization for non-U.S. Citizens: Workers in Professional and Specialty Occupations (H-1B, H-1B1, and E-3 Visas), seen on 20th August, 2020. Zhang and Associates P.C Us immigration lawyers and attorneys explain that “information such as where and when the job postings were advertised, salary offered, and actual job offers and acceptances should similarly be recorded and maintained” in order to document an employer’s good faith efforts.10Zhang and Associates P.C US immigration lawyers and attorneys, seen on June 8th, 2020. This provides firms with an incentive to intentionally keep their advertisement open in order to fulfill this requirement. This strategic behavior could represent a potential confounder driving the relationship between job posting duration and the probability to submit an LCA.
Table 6 shows that the relationship between job posting duration and the probability to submit an LCA is not driven by employers who have incentives to manipulate their job posting duration. It replicates the within-firm within-occupation specification and distinguishes the main effect between employers who have this incentive to adopt a strategic behavior and employers who do not. Column (1) separates H-1B dependent employers from the others. Column (2) distinguishes willful violators from other employers.
Column (3) distinguishes all H-1B dependent and willful violator employers from all others. It is worth noting that additional rules only apply for non-exempt H-1B workers. The U.S. Department of Labor’s employment law guide mentions that “H-1B dependent employers that hire H-1B workers who are paid at least $60,000 per year or have a master’s degree or higher in a specialty related to the employment, can be exempted from these additional rules.” Columns (4) and (5) take this exemption into account when distinguishing employers. Because I cannot identify exempted jobs from job posting data, I use the wage information embodied in LCAs. Column (4) restricts the category of employers who have an incentive to manipulate their job posting duration to H-1B dependent and willful violator employers whose average LCAs’ wage is larger than $60,000 per year. Column (5) increases this threshold to $70,000. Overall, table 6 shows that the relationship between job posting duration and the probability to submit an LCA is not driven by H-1B dependent nor willful violator employers. The interaction term is slightly significant but most of the effect is driven by employers without any incentive. Results are robust across definitions of employers who have an incentive to manipulate their job posting duration. This does not provide any evidence supporting the role of the preference channel.
6 Heterogeneity analysis
This last section explores the heterogeneity of the relationship between job posting duration and the probability to submit an LCA across employers, occupations, and time. First, it studies which type of employers are the most likely to seek foreign workers due to the lack of domestic labor supply. Second, it compares this relationship across occupations to assess which group is the most likely to be affected by the lack of domestic labor supply. Finally, it investigates the non-linearity of the relationship between job posting duration and the probability to submit an LCA.
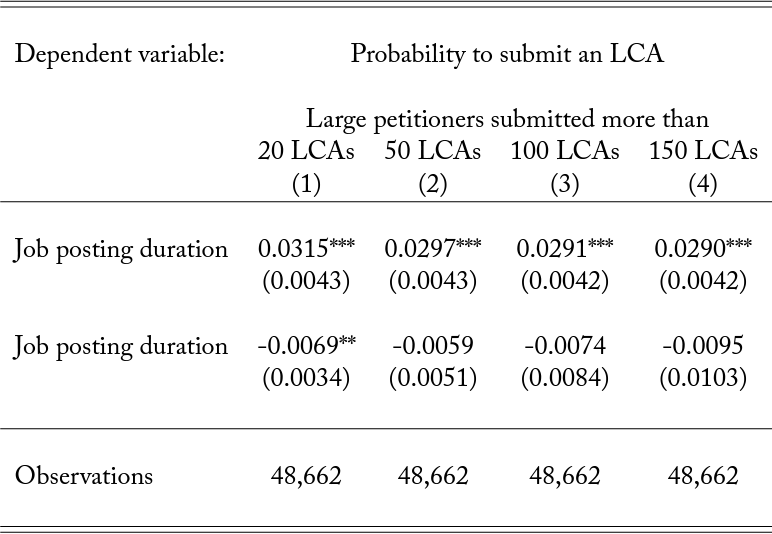
Table 7. The relationship between job posting duration and the probability to submit an LCA is not driven by large petitioners.
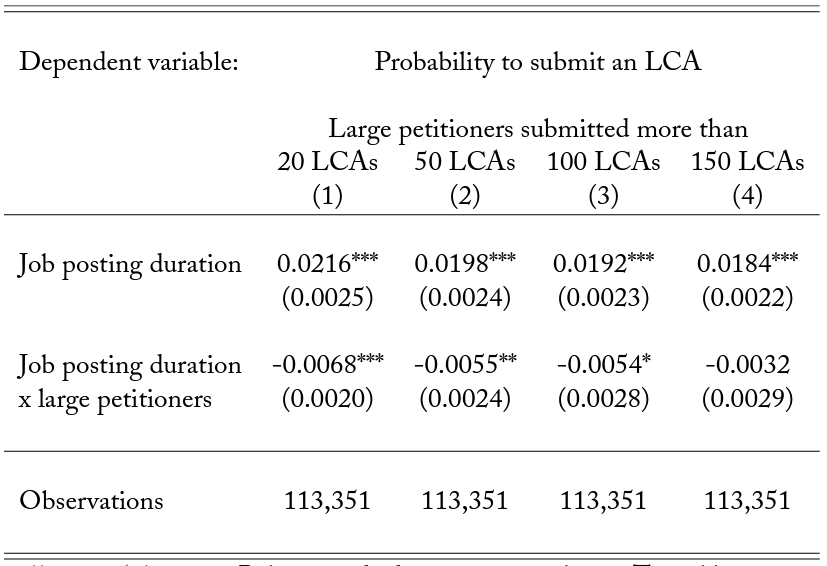
Notes: ***p<0.01, **p<0.05, *p<0.1. Robust standard errors in parentheses. This table compares the relationship between job posting duration and LCA submission across two types of employers. First line estimates present the result for employers who are not considered as large petitioners. Second line estimates present the results for large petitioners. Column (1) defines large petitioners as employers who have submitted more than 20 LCAs in fiscal year 2019. Columns (2), (3), and (4) adopt larger thresholds. They respectively define large petitioners as employers who have submitted more than 50, 100, and 150 LCAs in a fiscal year 2019. All regressions control for posting date, commuting zone, and firm-occupation fixed effects. The measure of job posting duration is standardized. Standard errors are clustered at the firm level. Source: Job Board A and U.S. Department of Labor.
The distribution of H-1B applications is skewed toward a small number of employers. While half of all companies that submit LCAs send only ten or fewer applications, some recruiters submit a large number of LCAs. In this section, I first investigate whether these large petitioners are as likely as other employers to be driven by the lack of domestic labor supply. This test builds on the within-firm within-occupation specification and introduces a heterogeneity dimension across employers. Column (1) defines large petitioners as employers who have submitted more than 20 LCAs in fiscal year 2019. Column (2), (3), and (4) adopt larger thresholds. They respectively define large petitioners as employers who have submitted more than 50, 100 and 150 LCAs in fiscal year 2019. I compare the relationship between job posting duration and the probability to submit an LCA across large petitioners and the rest of employers. Table 7 shows that this relationship is mostly driven by employers who only submitted a few LCAs. Results are consistent with table 1. The interaction term between job posting duration and the dummy variable identifying large petitioners is negative and slightly significant. Results are robust across different definitions of large petitioners. This suggests that large petitioners are less likely to be driven by the lack of domestic labor supply when seeking foreign workers.
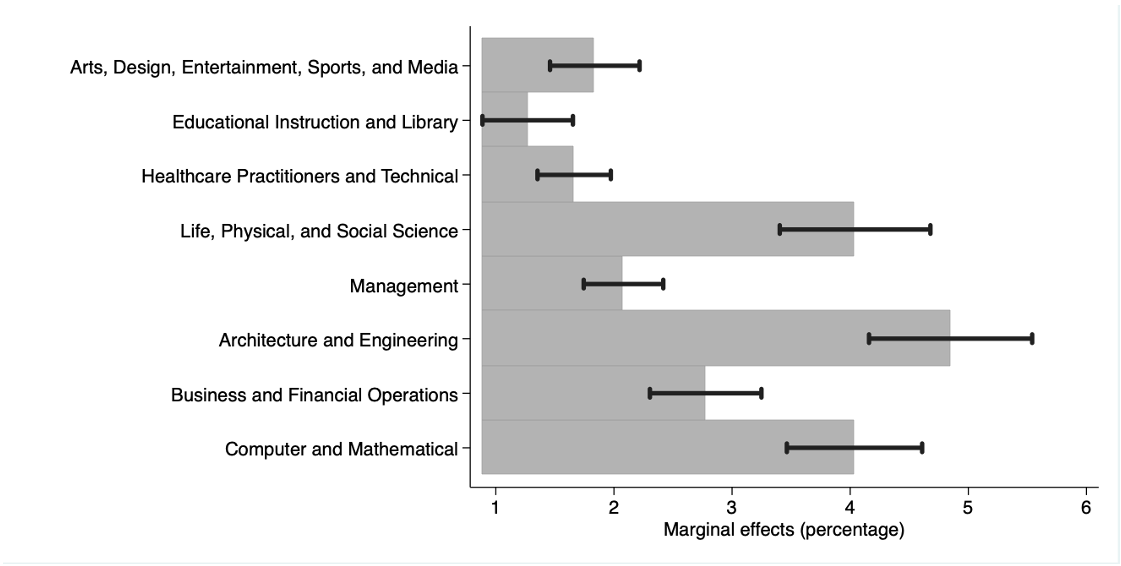
Balances between labor demand and labor supply vary across occupations. I investigate which groups of occupations are the most affected by the lack of domestic labor supply by comparing the relationship between job posting duration and the probability to submit an LCA across major groups of occupations. Figure 7 reports the results for eight major groups of occupations. This graph highlights that the relationship is particularly important for three groups: computer and mathematical; architecture and engineering; and life, physical, and social science occupations. For these categories, one standard deviation increase in job posting duration increases the probability to submit an LCA by more than 3 percentage points. This effect is 30 to 70% smaller for the last five groups of occupations. This graph suggests that scientific, technological, engineering, and mathematical (STEM) occupations are the most likely to be affected by the lack of domestic labor supply.
Table 7. The relationship between job posting duration and the probability to submit an LCA is not driven by large petitioners.

Notes: ***p<0.01, **p<0.05, *p<0.1. Robust standard errors in parentheses. This table compares the relationship between job posting duration and LCA submission across two types of employers. First line estimates present the result for employers who are not considered as large petitioners. Second line estimates present the results for large petitioners. Column (1) defines large petitioners as employers who have submitted more than 20 LCAs in fiscal year 2019. Columns (2), (3), and (4) adopt larger thresholds. They respectively define large petitioners as employers who have submitted more than 50, 100, and 150 LCAs in fiscal year 2019. All regressions control for posting date, commuting zone, and firm-occupation fixed effects. The measure of job posting duration is standardized. Standard errors are clustered at the firm level.
Source: Job Board A and U.S. Department of Labor.
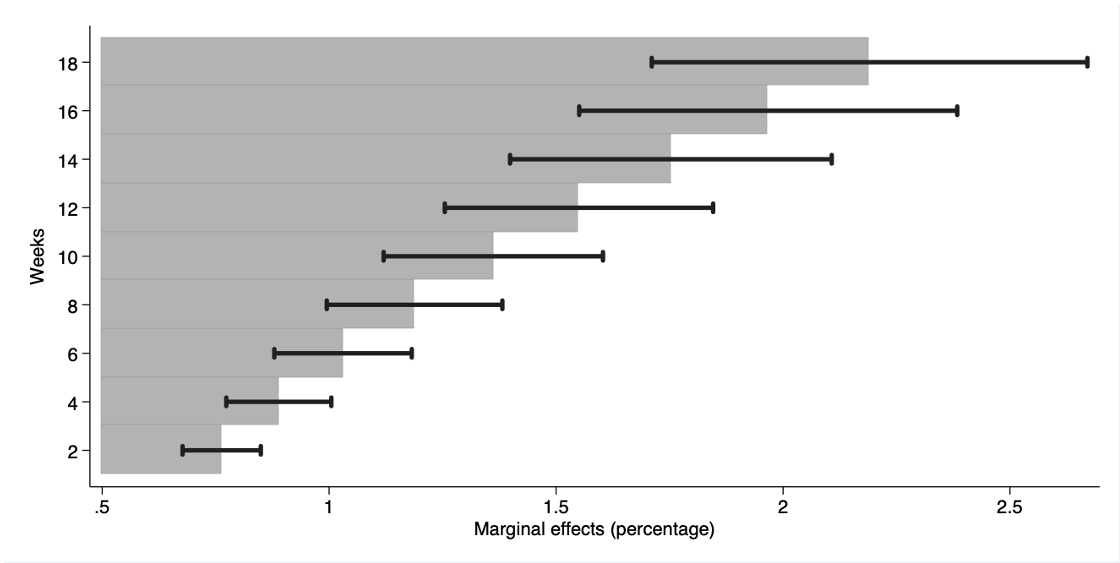
Figure 8 highlights how the relationship between job posting duration and the probability to submit an LCA varies over time. This effect increases by a factor three when comparing the bottom to the top of the duration distribution. These marginal effects result from a probit specification controlling for top petitioners. In terms of magnitude, each week added to the average duration increases the probability to submit an LCA by 1 percentage point. At the very top of the distribution, the increase is 1.5 percentage points. This graph shows that the relationship between job posting duration and the probability to submit an LCA is mostly driven by vacancies advertised for a few months. This seems consistent with a lack of domestic labor supply for these occupations.
Figure 7. Heterogeneity across major groups of occupations
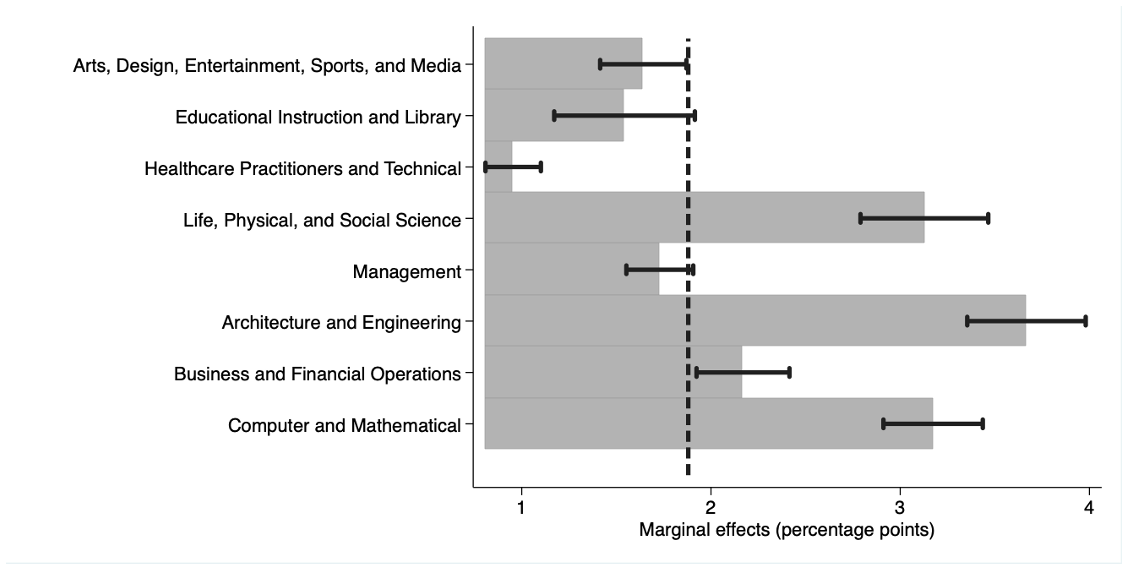
Notes: This graph presents the relationship between the probability of submitting a labor condition application for a given job and its job posting duration. It reports marginal effects estimated with a probit estimation. It highlights heterogenous results across major groups of occupations. The vertical dash line represents the average estimate at 1.88 percentage points. The estimation controls for commuting zone and posting date fixed effects. The measure of job posting duration is standardized. Source: Job Board A and U.S. Department of Labor.
Conclusion
This paper shows that U.S. employers are more likely to seek foreign workers when finding domestic workers takes more time. Within-firm within-occupation specifications report that employers are 28 percent more likely to submit an LCA when job posting duration is one standard deviation longer. It then explores the mechanism driving this relationship. It provides evidence suggesting that this phenomenon is due to the lack of domestic labor supply in specific occupations. On the contrary, it does not find any evidence supporting the role of low wages or employers’ preference for foreign workers. Finally, this paper suggests that the lack of domestic labor supply is particularly striking for employers submitting a few LCAs and employers trying to recruit in STEM occupations. Imposing additional restrictions on the H-1B visa program would increase firms’ difficulty to recruit in STEM occupations. As shown by Glennon (Glennon), this would lead firms to increase offshoring as an alternative approach to handling visa restrictions.
Figure 8. Heterogeneity over job posting duration
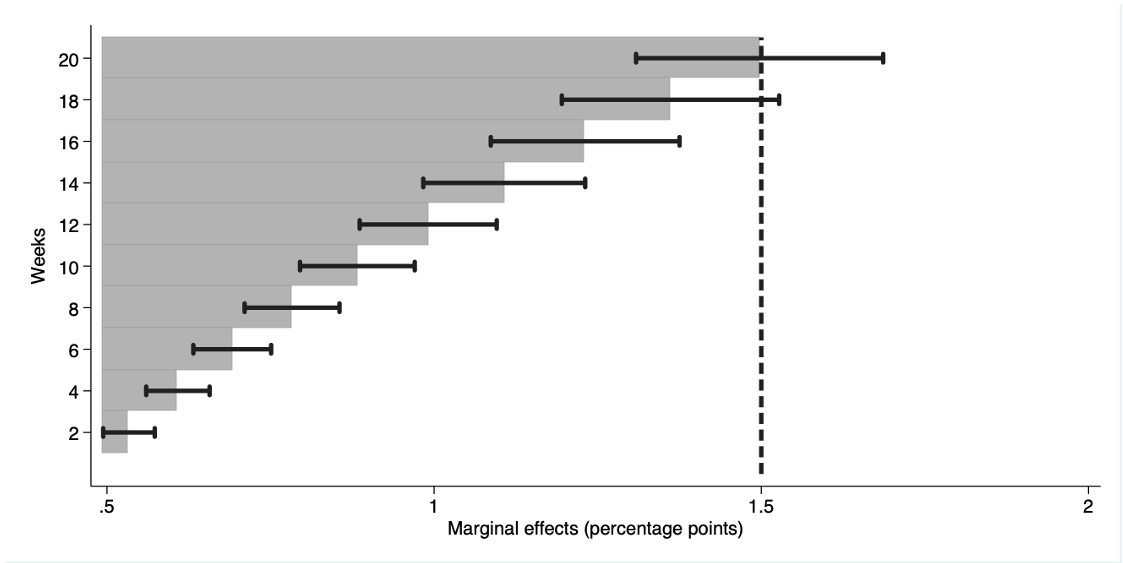
Notes: This graph presents the relationship between the probability of submitting a labor condition application for a given job and its job posting duration. It reports marginal effects estimated with a probit estimation. The vertical dash line represents the average estimate at 1.5 percentage points. It highlights the heterogeneity of the results along the duration scale. The estimation controls for commuting zone and occupation fixed effects. It also controls for posting dates. Source: Job Board A and U.S. Department of Labor.
Appendix
A Matching algorithm and lower bound estimate
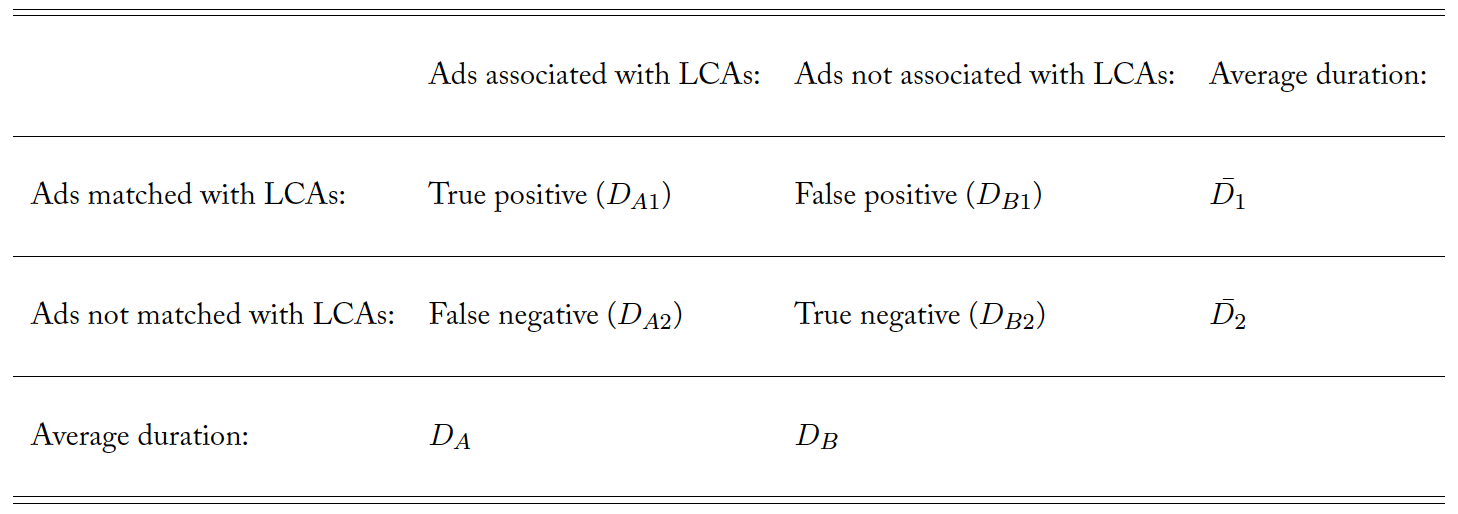
Interpreting how the matching issues may affect the sign of my estimate relies on one assumption. I only assume that the probability to match an ad with its LCA does not change over its lifetime. Building on this assumption, I distinguish three cases according to the correlation existing between job posting duration and the association with LCAs.
The first case assumes a positive correlation between job posting duration and the association with an LCA. In this scenario, the estimate of interest is denoted as follows:
(2) 
From an empirical perspective, what I do estimate is the following quantity:
(3) 
Without any matching issue:
(4) 
where my estimator  is equal to the quantity of interest
  . However, matching issues change my estimate as follows:
(5) 
Because  is smaller than
  and
and  is larger than
  , this implies:
(6) 
In this scenario, matching issues introduce a downward bias driving my estimate toward zero.
The second case assumes a negative correlation between job posting duration and the association with LCA. In this scenario, the computation detailed above leads to a symmetric result. Matching issues introduce an upward bias driving my estimate toward zero. Note that the likelihood that this difference becomes positive is very unlikely. By adopting the most conservative matching strategy, I limit as much as possible the number of false positives. Moreover, if the number of false negatives was larger than the number of false positive, it would drive the average duration of the unmatched ads  toward the average duration of the ads matched with LCAs
  . This would result in a null estimate.
Finally, the last case assumes no correlation between job posting duration and the association with LCA. In this scenario, matching issues do not introduce any bias in my estimate .
B The U.S. Standard Occupation Classification system
Throughout the empirical analysis, I rely on the U.S. Standard Occupation Classification system to identify occupations. This section details that categorization.
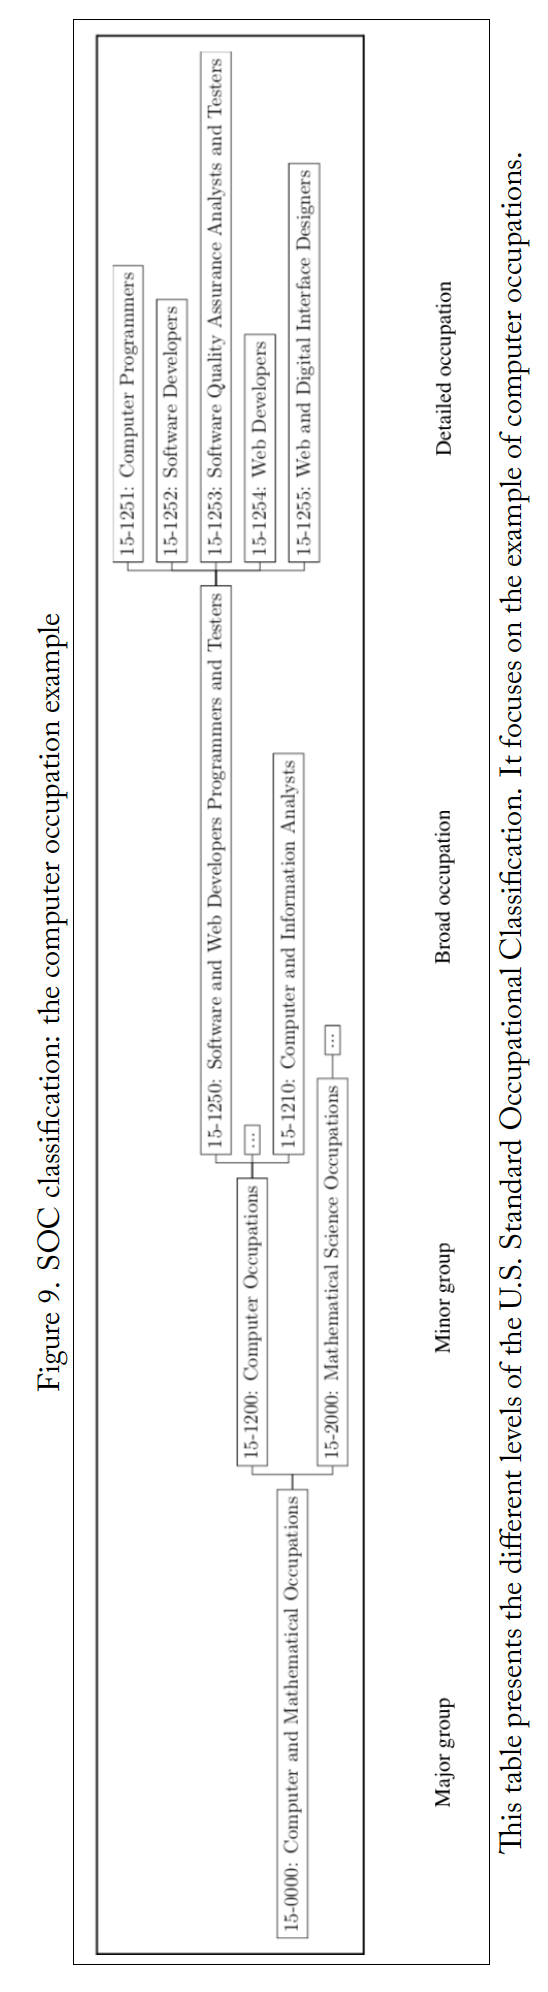
The SOC system aims to classify jobs into occupational categories. It is organized into a four-tiered system composed of 23 major groups, 98 minor groups, 459 broad occupations, and 867 detailed occupations. More especially, this classification system relies on SOC codes. The most precise level includes six digits. The two first ones correspond to the major group, the two following to the minor group, broad occupations are then specified by the 5th digit, and detailed occupations are indicated by the last digit. Each detailed SOC occupation includes all jobs with “similar job duties, and in some cases, similar skills, education, and/or training.’’
Figure 9 presents some of the hierarchy of SOC occupations within computer and mathematical occupations. This example highlights the high degree of precision in the distinction of detailed occupations. For instance, it distinguishes computer programmers from software developers. While the former “create, modify and test the code that allow computer applications to run,” the latter “develop computer and network software or specialized utility programs.” While job duties vary across both occupations, table 8 describes their similarities in skills. This table describes five main skills and the tools used for them in each occupation. Common tools are bolded in the text. They represent almost half of the toolbox used in both jobs. This suggests that workers performing one of these occupations could also be hired to fulfil the other.
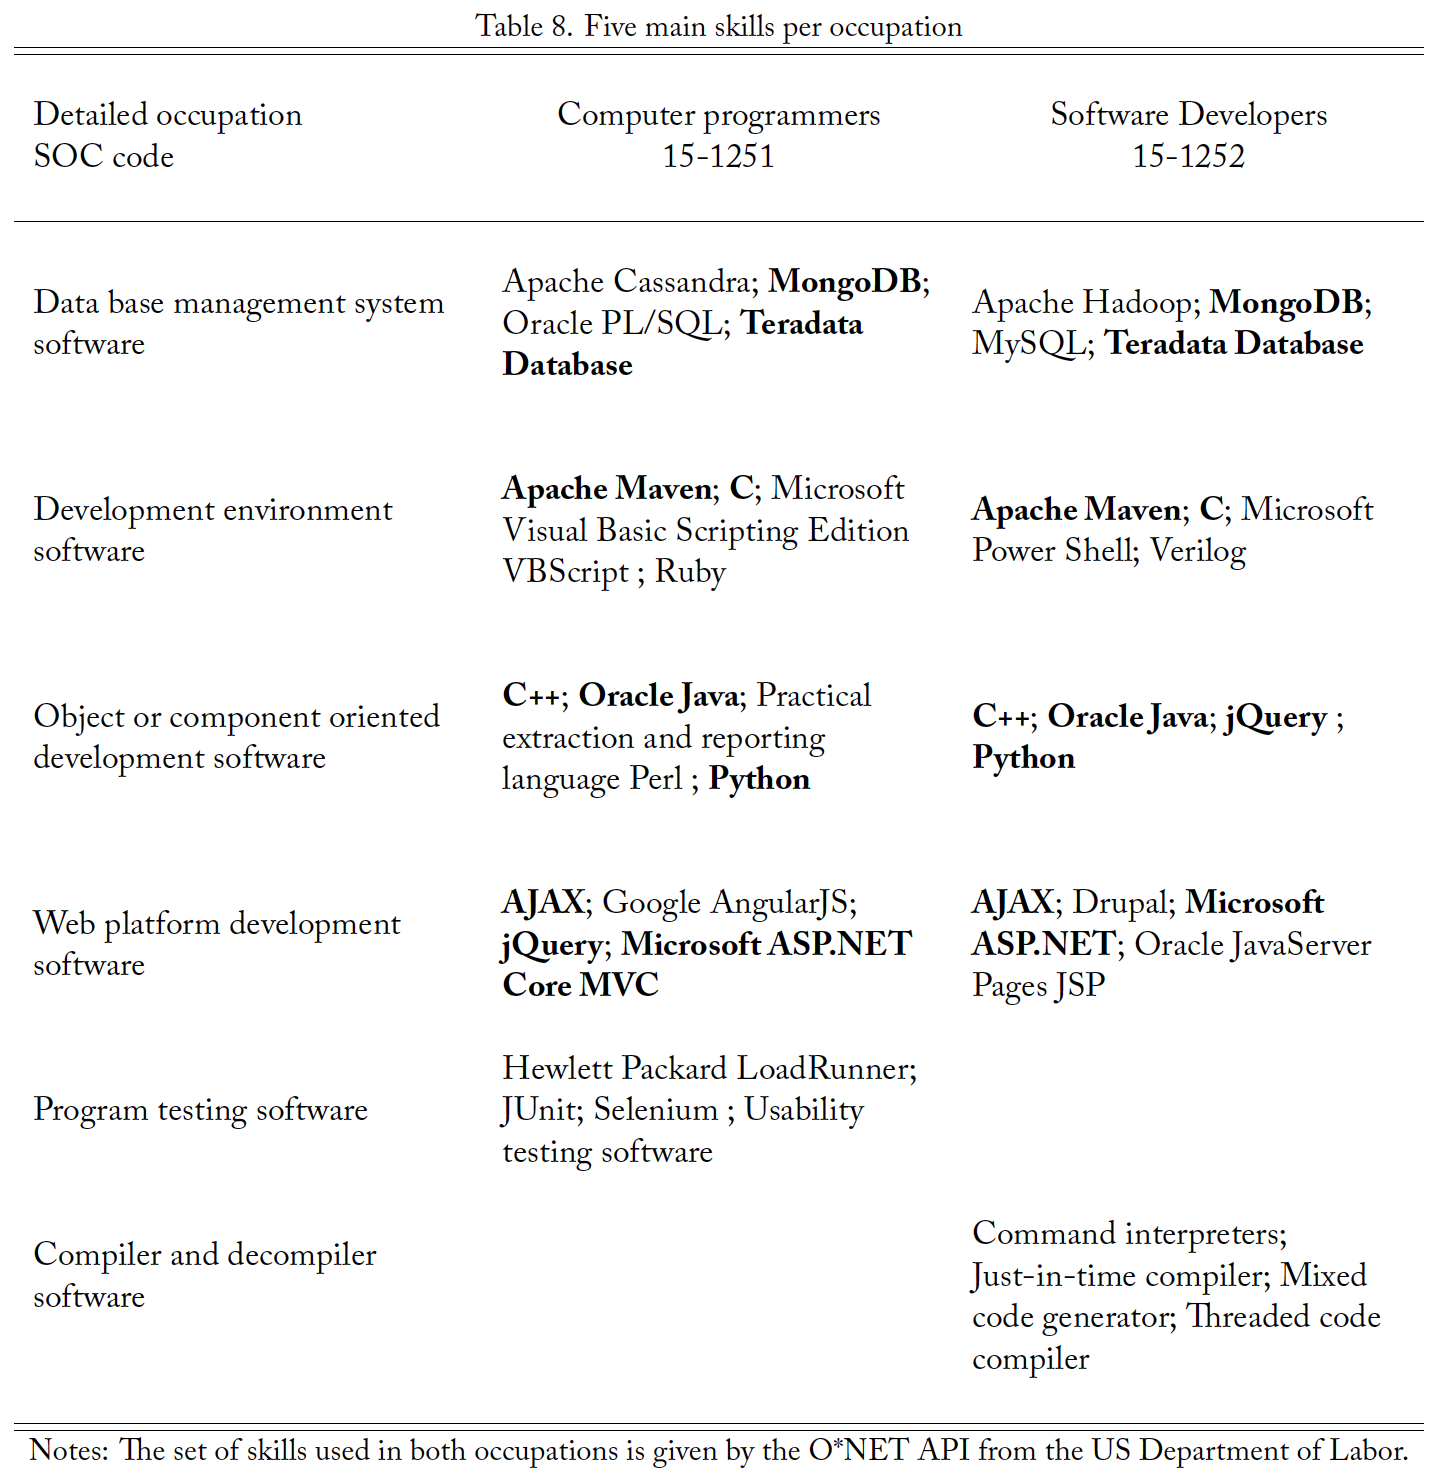
Notes: The set of skills used in both occupations is given by the O*NET API from the US Department of Labor.
C Measuring labor market tightness
This section presents both data sources used to construct my measure of labor market tightness. To construct this index, I use both online and survey data.
C.1 Open Skills Project
The Open Skills Project aims to compile a classification of skills associated with each job included in the U.S. labor market. It is composed by a consortium including research institutions, online job boards, and non-profit developers. This partnership allows researchers to exploit proprietary data on U.S. job postings to build a crosswalk between occupations and skills with a high level of granularity. In particular, they “build on and expand on the Department of Labor’s O*NET data resources.”
In this paper, I take advantage of the Open Skills Research Hub. This part of the project releases quarterly aggregate data on U.S. job postings at occupation and commuting zone levels. As data are provided by several of the main U.S. job boards (ADP, Career Builder, the National Labor Exchange), they provide me with the largest possible picture of the U.S. labor market. The hub details the quarterly aggregate number of job postings advertised online. These data are released at the local labor market level. The occupations are classified with six-digit SOC codes. Locations are identified through Core-Based Statistical Areas that correspond to commuting zones. These aggregate figures provide me with the numerator of my labor market tightness ratio.
C.2 Occupational Employment Statistics
After measuring the labor demand with online data, I approximate the supply side by taking advantage of the Occupational Employment Statistics (OES) released by the U.S. Department of Labor. This section details this additional source of data.
The OES is a semiannual survey based on 1.2 million U.S. establishments. It produces employment estimates for approximately 800 occupations. As data are released with the same level of granularity as the demand side, they provide me with indirect insights regarding the denominator of the tightness ratio.
Theoretically, measuring labor supply would necessitate observing the number of unemployed workers per occupation and commuting zone. Due to data constraints, I approximate this measure with employment estimates provided by this survey. This approximation is rooted in models of on-the-job search. This framework describes firms that recruit workers already employed by other firms. According to this theoretical framework, the supply side includes the whole labor force rather than only unemployed workers. Therefore, there are two possible implicit assumptions supporting the identification. On the one hand, this approximation does not raise any issue if the share of unemployed workers per local labor market is much smaller than the share of employed workers. On the other hand, identification problems are minimized if both quantities are correlated. Relying on these assumptions, I measure the tightness denominator with employment estimates provided by the OES.
D Results for fiscal year 2018
This appendix replicates all the results for fiscal year 2018. It thus tests the robustness of the main results on another sample. However, the quality of the data is poorer, because I collected online job postings for a shorter time frame. This sample only observes job postings in February and March 2018. Similarly to fiscal year 2018, the first part of the application process ended in late March. Visas were delivered through a lottery taking place in April 2018, and H-1B winners started their job contracts in October 2018. Results are similar in terms of sign and magnitude to those estimated for fiscal year 2019. The significance of estimates is also similar for most results but heterogeneity analyses. Estimating these specifications with smaller samples increases the confidence intervals. The rest of this section follows the same order as the one adopted in the core of the paper.
D.1 Section 4: Results (2018)
Table 9. Employers are more likely to seek foreign workers to fill positions advertised longer (fiscal year 2018).
Notes: Standard errors in parentheses, *** p<0.01, **p<0.05, *p<0.1. This table presents the relationship between the probability to submit a labor condition application for a given job and its job posting duration for fiscal year 2018. It reports average marginal effects from linear probability estimations. The measure of job posting duration is standardized. Standard errors are clustered at the firm level.
Source: Job Board A and U.S. Department of Labor.
D.2 Section 4: Robustness (2018)
Table 10. Employers are more likely to seek foreign workers to fill positions advertised longer (fiscal year 2018).
Notes: Robust standard errors in parentheses, *** p<0.01, **p<0.05, *p<0.1. This table presents the relationship between the probability to submit a labor condition application for a given job and its job posting duration for fiscal year 2018. It reports average marginal effects from linear probability estimations. The measure of job posting duration is standardized. Standard errors are clustered at the local labor market level. Local labor markets are defined by commuting zone and major occupation group.
Source: Job Board A and U.S. Department or Labor.
D.3 Section 5: Lack of domestic labor supply (2018)
Table 11. Employers are more likely to seek foreign workers in tight labor markets (fiscal year 2018).
Notes: Robust standard errors in parentheses, ***p<0.01, **p<0.05, *p<0.1. This table presents correlations between the probability to submit a labor condition application and different proxies of hiring difficulties for fiscal year 2018. Job posting duration is the online duration of a given job . Average duration on the labor market is the duration of all jobs belonging to the same group of occupations and commuting zone as job Labor market tightness is an index dividing the number of vacancies by the total employment in the same labor market as job . Labor market by commuting zone and major group of occupations. This table reports average marginal effects from linear probability estimations. All measures of hiring difficulties are standardized.
Source: Job Board A and U.S. Department of Labor.
D.4 Section 5: Low wages (2018)
Table 12. The relationship between job posting duration and the probability to submit an LCA is driven by generous employers.
Notes: ***p<0.01, **p<0.05, *p<0.1. Robust standard errors in parentheses. This table compares the relationship between job posting duration and LCA submission across two types of employers for fiscal year 2018. First line estimates present the result for generous employers. Second line estimates present the results for non-generous employers. Column (1) defines as generous those employers who offer a wage premium on top of prevailing wages to foreign workers. Following columns progressively restrict this definition. Column (2) defines as generous those employers offering a wage premium larger than 1 percent of the annual wage on top of prevailing wages. In columns (3) and (4), the wage premium thresholds are respectively set to 5 and 10 percent of the annual wage. Finally, column (5) defines as generous those employers who offer wages larger than the local average wage defined by occupation and measured via the Occupational Employment statistics. All regressions control for posting date, commuting zone, and firm-occupation fixed effects. Source: Job Board A and U.S. Department of Labor.
D.5 Section 5: Employers’ preference for foreign workers (2018)
Table 13. The relationship between job posting duration and the probability to submit an LCA is driven neither by H-1B dependent nor by willful violator employers (fiscal year 2018).
Notes: ***p<0.01, **p<0.5, *p<0.1. Robust standard errors in parentheses. This table presents the relationship between the probability to submit a labor condition application for a given job and its job posting duration for fiscal year 2018. In particular, it explores the heterogeneous effect of job posting duration between H-1B dependent and willful violator employers and other employers. An H-1B dependent employer is, generally, one whose H-1B workers comprise at least 15 percent of the employer’s full-time equivalent employees. Willful violators of H-1B rules are employers who have “committed either a willful failure or a misrepresentation of a material fact” in LCA attestations. Column (1) separates H-1B dependent employers from the others. Column (2) distinguishes willful violator from other employers. Column (3) gathers H-1B dependent and willful violator employers in one category opposed to the rest of employers. Column (4) restricts the category of employers who have an incentive to manipulate their job posting duration to H-1B dependent and willful violator employers whose average LCA’s wage is larger than $60,000 per year. Column (5) increases this threshold to $70,000. The table reports marginal effects estimated from linear probability estimations. All regressions control posting date, commuting zone, and firm-occupation fixed effects. The measure of job posting duration is standardized. Standard errors are clustered at the firm level. Source: Job Board A and U.S. Department of Labor.
D.6 Heterogeneity analysis (2018)
Table 14. The relationship between job posting duration and the probability to submit an LCA is not driven by large petitioners (fiscal year 2018).
Notes: ***p<0.01, **p<0.05, *p<0.1. Robust standard errors in parentheses. This table compares the relationship between job posting duration and LCA submission across two types of employers for fiscal year 2018. First line estimates present the result for employers who are not considered as large petitioners. Second line estimates present the results for large petitioners. Column (1) defines large petitioners as employers who have submitted more than 20 LCAs in fiscal year 2019. Columns (2), (3), and (4) adopt larger thresholds. They respectively define large petitioners as employers who have submitted more than 50, 100, and 150 LCAs in fiscal year 2019. All regressions control for posting date, commuting zone, and firm-occupation fixed effects. The measure of job posting duration is standardized. Standard errors are clustered at the firm level. Source: Job Board A and U.S. Department of Labor.
Figure 10. Heterogeneity across major groups of occupations (fiscal year 2018)
Notes: This graph presents the relationship between the probability to submit a labor condition application for a given job and its job posting duration. It reports marginal effects estimated with a probit estimation. It highlights heterogenous results across major groups of occupations. The estimation controls for commuting zone and posting date fixed effects. The measure of job posting duration is standardized. Source: Job Board A and U.S. Department of Labor.
Figure 11. Heterogeneity over job posting duration (controlling for top petitioners)
Notes: This graph presents the relationship between the probability to submit a labor condition application for a given job and its job posting duration. It reports marginal effects estimated with a probit estimation. It highlights the heterogeneity of the results along the duration scale. The estimation controls for commuting zone and occupation fixed effects. It also controls for posting dates. Source: Job Board A and U.S. Department of Labor.
References
Abraham, K. G. (2015). Is skill mismatch impeding U.S. economic recovery? Industrial and Labor Relations Review 68(2), 291–313.
Anastasopoulos, J., G. J. Borjas, G. G. Cook, and M. Lachanski (2019). Job vacancies, the Beveridge curve, and supply shocks: The frequency and content of help-wanted ads in pre- and post-Mariel Miami. IZA Discussion Paper 12581.
Anderson, S. (2020). H-1B denials remain high, especially for IT services companies. Forbes.
Aobdia, D. and A. Srivastava. Do U.S. corporations hire U.S. educated skilled immigrants to lower their labor costs? Evidence from the audit industry. Working paper.
Azar, J. A., E. Huet-Vaughn, I. Marinescu, B. Taska, and T. von Wachter (2019). Minimum wage employment effects and labor market concentration. NBER Working Paper 26101.
Azar, J. A., I. Marinescu, M. I. Steinbaum, and B. Taska (2019). Concentration in US labor markets: Evidence from online vacancy data. NBER Working Paper 24395.
Barnow, B. S., J. Trutko, and J. S. Piatak (2013). Occupational Labor Shortages: Concepts, Causes, Consequences, and Cures. Upjohn Institute for Employment Research.
Bill Gates (2007). Strengthening american competitiveness. [Transcript of U.S. Senate Committee Hearing].
Capelli, P. (2015). Skill gaps, skill shortages, and skill mismatches: Evidence and arguments for the United States. Industrial and Labor Relations Review 68(2), 251–290.
Carnevale, A. P., N. Smith, and M. Melton (2011). STEM: Science technology engineering mathematics. Technical report, Georgetown University Center on Education and the Workforce.
Chambers, E. G., M. Foulon, H. Handfield-Jones, S. M. Hankin, and E. G. Michaels (1998). The war of talent. McKinsey Quarterly.
Chéron, A. and B. Decreuse (2017). Matching with phantoms. Review of Economic Studies 84, 1041–1070. Davis, S. J. and B. S. de la Parra (2017). Application flows. Working paper.
Davis, S. J., C. Röttger, A. Warning, and E. Weber (2014). Job recruitment and vacancy durations in Germany. University of Regensburg Working Papers in Business, Economics and Management Information Systems.
Deloitte and the Manufacturing Institute (2011). Boiling point? The skills gap in U.S. manufacturing.
Technical report.
Deming, D. J. and L. B. Kahn (2017). Skill requirements across firms and labor markets: Evidence from job postings for professionals. NBER Working Paper 23328.
Deming, D. J. and K. L. Noray (2018). STEM careers and the changing skill requirements of work.
NBER Working Paper 25065.
Doran, K., A. Gelber, and A. Isen (2016). The effects of high-skilled immigration policy on firms: Evidence from visa lotteries. NBER Working Paper 20668.
Glennon, B. How do restrictions on high-skilled immigration affect offshoring? Evidence from the H-1B program. Working paper.
Hira, R. and B. Gopalaswamy (2019). Reforming US’ high-skilled guestworker program. Technical report, Atlantic Council South Asia Center.
Kerr, S. P., W. R. Kerr, and W. F. Lincoln (2015, June). Skilled immigration and the employment structures of US firms. Journal of Labor Economics 33(3), 147–186.
Kroft, K. and D. G. Pope (2014). Does online search crowd out traditional search and improve matching efficiency? Evidence from Craigslist. Journal of Labor Economics 32(2), 259–303.
Kuhn, P. and H. Mansour (2014). Is internet job search still ineffective? Economic Journal 124(581), 1213–1233.
Kuhn, P. and M. Skuterud (2004). Internet job seach and unemployment durations. American Economic Review 94(1), 218–232.
Lofstrom, M. and J. Hayes (2011, December). H-1Bs: How do they stack up to US born workers? IZA Discussion Paper.
Manpower Group (2018). Solving the talent shortage: Build, buy, borrow and bridge. Technical report.
Marinescu, I. (2017). The general equilibrium impacts of unemployment insurance: Evidence from a large online job board. Journal of Public Economics 150, 14–29.
Marinescu, I. and R. Rathelot (2018). Mismatch unemployment and the geography of job search. American Economic Journal: Macroeconomics 10(3), 42–70.
Matloff, N. (2006, December). Should the U.S. increase its H-1B visa program? San Francisco Gate.
Mayda, A. M., A. Ghosh, and F. Ortega (2016). The impact of skilled foreign workers on firms: An investigation of publicly traded U.S. firms. IZA Discussion Paper.
Mayda, A. M., F. Ortega, G. Peri, K. Shih, and C. Sparber (2018, September). The effect of the H-1B quota on the employment and selection of foreign-born labor. European Economic Review 108, 105–128.
Mithas, S. and H. C. Lucas (2010, May). Are foreign IT workers cheaper? U.S. visa policies and compensation of information technology professionals. Management Science 56(5), 745–765.
Peri, G., C. Sparber, and K. Shih (2015, May). Foreign and native skilled workers: What can we learn from H-1B lotteries? NBER Working Paper 21175.
Phelps, E. S. (1970). The Microeconomic Foundations of Employment and Inflation Theory. New York: Norton. Pissarides, C. A. (1974). Risk, job search, and income distribution. Journal of Political Economy 82(6), 1255–1267.
Sparber, C. (2015, August). The value of H-1B status in times of scarcity. CReAM Discussion Paper.
U.S. Citizenship And Immigration Services (2018). Characteristics of H-1B specialty occupation workers.
U.S. General Accounting Office (2011). H-1B visa program: Reforms are needed to minimize the risks and costs of current program. Technical Report GAO/HEHS 00-157, U.S. General Accounting Office, Washington, D.C.