1 Introduction
Salaries for workers with in-demand technology skills are high.1According to Bureau of Labor Statistics OES data from 2019, the mean annual wage for all occupations was $53,490 while the mean income of computer occupations was more than double that at $156,390. Increasing the pool of workers who have these skills and apply for tech jobs would increase economic productivity in the US and throughout the world. Policy discussions about science, technology, engineering, and mathematics (STEM) or computer skill training emphasize the social benefit of a high-skill work force. Often an assumption is made that if more people had access to training, more people would go into tech careers, especially since wages are high. However, self-selection into tech jobs is not well understood. The number of American college students who choose to major in computer science is increasing, but it remains a small fraction.2Starting around 2014, interest in the computer science major course of study for undergraduates has increased in the US. In some colleges, student demand has increased at a faster rate than universities can hire computer science professors, according to Singer (2019).
The majority of American college students are not pursuing tech careers but rather favor more traditional tracks such as business and nursing. It is important to determine the reasons why most students and job seekers do not consider tech jobs or pursue opportunities in the dynamic technology sector. One possible factor is the perception of the specific work tasks. Do people dislike computer programming, or do they lack confidence in their own ability to do technical tasks? This paper describes the first controlled study of what factors affect the decision to do computer programming jobs. The sample of participants is college students who are considering their future career.
The experiment is designed to isolate willingness to do the technical tasks involved in high-skill computer work.3Although the job title of “programmer” is on the decline in favor of other titles such as “application developer,” the fundamental skill of being able to understand code and logic is still in high demand. Specifically, we ask subjects if they will spend time learning and doing paid computer programming. They must pass a quiz on the function of basic commands in order to qualify for most of the payment. A control for the opportunity cost of time focuses the results on whether participants want to program or not. We abstract away from other concerns that a prospective tech worker has, such as whether they will be able to obtain a job offer, in order to isolate the perception of the technical tasks.
Most college students want to do the training and short job. However, some require a high wage and several refuse entirely. The variation in willingness to accept this job and the implied reservation wages in this experiment can help explain trends in tech employment.4The reservation wage is the lowest wage rate at which a worker would be willing to accept a particular job. The most important factor in their decision is whether they report that they enjoy programming or not. People who do not enjoy programming require more money to do it. We can show that this is not simply due to having a higher opportunity cost of time, since the experiment also measures the reservation wage for participants to do a simple task that takes the same amount of time as the programming task. Having previous formal training in programming has very little effect on willingness to train and take the job. Also, a treatment intervention wherein the subjects get to preview a programming challenge with an explanation of the answer has no effect.
Female subjects behave in the same way as males for incentivized portions of the experiment. However, their self-reported survey answers indicate that the gender gap in tech may be due to more than just a preference for the tasks involved. For example, female subjects are more likely to state that they expect to experience harassment if they pursue tech jobs outside of the experiment.
Several treatment interventions were implemented with the goal of increasing confidence. An encouraging message stating the fact that other students with no experience had been able to succeed in the training caused subjects to raise their reservation wage to program and actually reduced their confidence. Although there is some evidence in the literature that the right kind of encouragement from the right source increases the tech labor supply, this experiment serves as a warning about one-size-fits-all patronizing messages to college students.
2 Related Literature
Is there a “skills gap” in the US? Burning Glass Technologies compared job openings and workers to form an estimate that the demand for computer occupations exceeds supply by 17% (Restuccia et al., 2018). Cappelli (2015) provides a review over many decades of government policy initiatives aimed at increasing Americans’ hard skills and of reports by consultants stating that employers cannot fill open jobs. During the Cold War, concern grew about a skills gap, and the first publicly funded response was the 1958 National Defense Education Act. To the extent that a skills gap or mismatch is a problem in the US economy, the results in our paper can inform businesses and policy makers who wish to increase participation in tech.
One reason that more workers do not pursue tech jobs is that women and minorities might face discrimination. In our experiment, every participant is offered a job and there is little scope for experiencing discrimination, in an attempt to control for this factor. The enduring STEM gap between men and women is larger than the gap in skills (Stoet and Geary, 2018). If more competent women reject STEM careers than men, it could be due to some combination of different preferences, discrimination, or lack of confidence. Experiments can help give insight into the various causes of gender or minority disparities.
Another possible reason that more workers are not preparing for tech careers is that they lack confidence. Data from the College Board indicates that twice as many male high school students take AP Computer Science (CS) as females in the US.5The College Board released detailed information on AP test takers for 2018 at https://research.collegeboard.org/programs/ap/data/participation/ap-2018. Confidence could be a reason that young women are not getting into the tech pipeline at the same rate as male students.
One factor explaining the gender difference in intent to major in computer science found by Sax et al. (2017) is differences in math ability self-rating. However this confidence disparity only explained 13% of the CS gender gap in 2011, which is down significantly from 1976 when the confidence disparity explained about 80% of the gap. Subjective attitudes and beliefs can change over time as women are increasingly seeing female representation in tech.
There is evidence from around the world that women are sometimes deterred from tech by perceptions that can be altered through messaging and encouragement. In Bangladesh, Saifuddin et al. (2019) found that women held a self-perpetuating belief that high-tech jobs are only suitable for men. Del Carpio and Guadalupe (2018) found that representation of successful female role models resulted in more applications in an experiment on how women in Peru and Mexico select into a tech training program. Buhnova and Prikrylova (2019) report on a program that prepares young Czech women for tech jobs. They found that a combination of training and personalized encouragement affected the career choices of women who had previously underestimated their own abilities.
Many people, including American high school students, simply do not know what tech workers do. Chipidza et al. (2019) found that students’ stated career goals change after taking a class that exposed them to opportunities in tech. More information might help potential workers envision themselves getting involved in tech.
The competitive aspect of the high-tech workforce might deter workers, and women disproportionately. There is evidence from both laboratory and field experiments that women are less likely to apply for jobs with a compensation scheme that requires competing against others. Field studies that measure likelihood of applying for a job demonstrate that women are less likely to apply for a job that involves a competitive compensation scheme (Samek, 2019; Flory et al., 2014). Most of these studies use a task that is general. Flory et al. use job postings for an administrative assistant because it is a common occupation. Uncertainty in compensation, unrelated to competition, also reduces labor supply. A drawback to training for tech jobs is the risk that a worker might quickly suffer skills obsolescence.6Research indicates that new applied science STEM graduates enjoy a large wage premium over their liberal arts peers (Deming and Noray, 2018). However, that premium shrinks by half in the first decade of work because their skills quickly become obsolete. The low barriers to entry in computer occupations coupled with rapid technological change make this an issue for people considering training for a tech job. It is likely that the competitive and uncertain nature of rapidly changing technology jobs lowers labor supply overall and deters women particularly.
There is behavioral research that points to a tendency for women to avoid competing against other people (Niederle and Vesterlund, 2007). A more recent study finds that women are willing to take on challenges and compete against their own record of performance (Apicella et al., 2020). The competitive social aspect of the technology field is not captured in our experiment. Subjects have to achieve a certain performance threshold, but there is no behavioral evidence that predicts women will be less likely to take on a personal challenge such as the programming job in our experiment.
A survey of 1,600 students and young professionals, sponsored by Google in 2014, indicates that women who chose to major in computer science (CS) are most influenced by encouragement and by self-perception. According to the figures in (Google, 2014), women who major in CS are three times as likely to have been encouraged by their parents.. In their study, 76% of CS women agree with “I love math” compared with only 45% of non-CS women.7Respondents who said they agree “strongly” or “moderately” or “slightly” were all classified as ‘agree.’ The third most important influence was having previous exposure to CS through classes. The subjective attitude toward CS and math was more important than having had classes. Our experiment is designed to have a measure of all of the three most important factors mentioned in the Google study.
A final reason for the limited number of workers with tech skills is that the work itself may be more unpleasant than policy makers acknowledge.8Buchanan et al. (2020) provide an overview of the drawbacks to tech jobs, including a review of related psychology literature. The President’s Council of Advisors Olson and Riordan (2012) reports research that investigates why college students dropped out of STEM fields of study. Upon getting to college, students who performed well in high school find the work boring and other students find the math difficult. Among the students who are most capable of doing technical work, simply not enjoying the work was an important predictor of rejecting a STEM career. Outside of a controlled experiment, it is difficult to isolate the effect of enjoyment on the decision to pursue tech jobs.
If tech work is unpleasant, then even a confident worker will have to be paid a compensating differential to do something like programming. There is a large experimental literature on effort and incentives (see Charness and Kuhn (2011)).9Buchanan and Wilson (2014) found that economic incentives provided by intellectual property protection encouraged the development of creative entrepreneurs. It is generally true that people will work harder if they are paid
more.10Experiments have demonstrated interesting exceptions to that rule. For example, Ariely et al. (2009) find that very large stakes can decrease performance ability. Usually the tasks used for study in real effort experiments are small discrete tasks that do not require specific advanced skills. In regards to creative mental effort, Charness and Grieco (2019) demonstrate that financial incentives can induce higher output for certain types of creative tasks.
3 Experimental Design
There are three phases of the experiment, as follows:
Initial Survey ($7) → One-Hour Training and Quiz ($5) → One-Hour Task ($15–$85)
Initially, subjects come to the lab for $7 to take a 15-minute survey. Payment ensures that subjects will take and finish the initial survey even if they do not want to do the computer programming component. The advantage of running the initial survey in the lab is that subjects who came to the lab for the survey can probably return to the lab again for the programming job if they want to.
Subjects indicate whether they would like an invitation to return to the lab to do a one-hour computer programming job for $15, $25, $35, …, or $85.11We use a quasi-BDM to obtain a view of the labor supply curve at many different wages. The data is not as granulated as that which a traditional Becker-DeGroot-Marschak (BDM) mechanism obtains, but it is easy for subjects to understand. The BDM, while being theoretically appropriate for this purpose, has come under suspicion for being difficult for inexperienced subjects to understand Cason and Plott (2014). We follow Bartling et al. (2015) and use a discrete version. This is presented as 9 discrete options, such as:
“I would like an invitation to do the programming task if I will be paid $15, $25, $35, $45, $55, $65,
$75 or $85.”, or,
“I would like an invitation to do the programming task if I will be paid $85. If I draw a $15, $25,
$35, $45, $55, $65 or $75 then I will not receive an invitation.”, and the last choice is
“I would not like to receive an invitation for the programming task.”
The instructions explain that their actual wage offer will be the result of a random draw from $15 to $85 in
$10 increments. They do not know their draw when they are asked to indicate their reservation wage for the work task. Subjects are told that, for those who receive invitations, “There will be multiple dates and times that those people can choose from to do the task.”
Before the work task, they have to do a one-hour training session for which they are paid only $5. At the end of the training session, subjects have to pass a quiz in order to qualify to participate in the more lucrative work session. If they were to get offered $85 for the second hour, and if they pass the test after the training, then the hourly rate would work out to $45/hour over two hours. The high rate of $45/hour is considerably higher than what most college students can earn for paid work outside of the experiment.
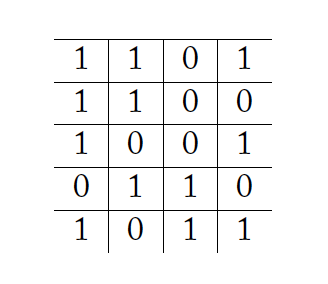
Subjects do the same quasi-BDM wage elicitation for an alternative counting task, to measure the opportunity cost of taking time to return to the lab. The task is to count the number of 1’s in a table of ones and zeroes.12This was used by Abeler et al. (2011) under a piece rate pay scheme. There is no risk involved because there is no quiz. Corgnet et al. (2015) advise that, when using a real effort task, it is important to provide an alternative activity to induce an opportunity cost of time. We sidestep this issue because our main outcome is voluntary selection into the longest part of the experiment.
The third decision with a financial incentive is to predict how many questions subjects expect to answer correctly in the quiz after the programming training. Subjects earn an additional $1 if they exactly predict their own quiz performance. They receive this payment only if they are invited to, and return, for the training.13It is unlikely that a subject would game the system by predicting a low quiz performance and then intentionally missing exactly as many questions as they predicted to guarantee themselves a dollar. There is a stronger incentive to strive to answer all of the questions correctly. Intentionally getting quiz questions wrong involves a considerable risk of not passing. More than two wrong answers disqualifies a participant from the part of the experiment that pays up to $85.[\mfn]
The complete survey instrument, including all demographic questions, is in Appendix B. Subjects were recruited through emails from the economics lab at a large public university in the US. Appendix B also contains the language used in the follow-up emails inviting students to participate in the longer portion of the experiment.
The training and job both utilize the programming language R for simple data manipulation with RStudio software.13R qualifies as a full computer programming language, along with Python, because the language meets the requirement of Turing completeness (Hao and Abeles, 1981). RSTudio is a development environment that allows subjects to write and execute code. Subjects work within an R Markdown document that combines instructions with actual programming practice.
Some quiz questions used to assess performance after training are in Appendix B.
The baseline description of the task in the instructions is “a one-hour computer programming task.” The training is described as follows:
In the training session you will learn how to write basic code in a commonly-used computer programming language. At the end there is a short quiz on what you learned in the training. You must pass the quiz to get invited to the second one-hour work session for the larger payment. The quiz will have 10 questions. You pass the quiz if you get 8 or more questions correct. These questions will ask you to apply what you learned in the training to answer questions about code. You will have access to all of the training materials while you take the quiz.
To some students, the baseline framing of the initial survey might be perceived as a choice under certainty. They simply need to decide if they want to work for two hours. These students generally assume that if something is “basic” then they can do it. To other students, the task will sound daunting and they wonder if they will be able to pass the quiz and feel successful. Some students lack confidence that they can train to “write basic code.” This is analogous, in a narrow sense, to what young people experience when they consider pursuing tech careers.
The treatment manipulations are to encourage students or to inform them about the content of the quiz.14These treatments were registered with the AEA RCT registry. The only difference between treatments and the baseline design is a small change in the wording of the first question, as shown below. Subjects read this before they indicate their reservation wage to program.
Encouragement (ENCOURAGE) treatment wording:
… training to answer questions about code. You will have access to all of the training materials while you take the quiz.
If you have never done computer programming before, don’t worry. We believe you can do it!
Extra Information (INFO) treatment wording:
… training to answer questions about code. You will have access to all of the training materials while you take the quiz.
Here is an example question from the quiz at the end of the training session:
Question 5. What would be the output from the following command? length(c(3,5,7))
- 3 4 5
You will have learned in the training that the combine command, c(), takes several elements and turns them into a list. And the length command, length(), reports the length of a list. To get the right answer, you would count how many numbers are in the list, 3,5,7.
In the Fall of 2019, 310 students participated from a large US public university. The baseline version was run with 115 students. There were 87 and 108 students in ENCOURAGE and INFO, respectively. A subset of the students who filled out the survey were emailed with an offer to return to the lab for the more lucrative portion of the experiment. In that follow-up email, the subject learned how much they will be paid for the hour of programming (or counting) after the training session. They receive a wage that is equal to or higher than the number they stated as their reservation wage. Subjects who drew a wage below their reservation wage were not eligible to be invited back and did not receive any further communication from us.
After this initial experiment, we ran a follow-up experiment called “High Stakes” because both the risk level and the potential compensation level was increased. High Stakes had 153 participants across 3 treatments. The design of High Stakes is reported in section 6.
4 Theoretical Concerns and Hypotheses
The widely used Roy Model presents occupational choice as a decision between two sectors assuming individuals are income-maximizers (Roy, 1951). The decision to move to the tech sector in pursuit of a high wage is somewhat like the decision described by Roy and later formalized by Borjas (1987).15There are three main differences between our theory and that of the classic Roy model. (1) We will consider the move to take a tech job to be a short-term decision, unlike the Borjas migration model. Thus, some people would value the job as training for future tech jobs and some might only value the one-time cash payment. The implications about wage distribution in the Borjas model are not as relevant to the decision to move into tech. (2) The tech sector offers little protection for low-skilled workers, so we would not expect to see low-skilled workers moving to the tech sector to take advantage of a compressed wage distribution. However, in our experiment, we do not expect anyone in the subject pool to be unable to earn the full fixed wage offered if they desire to participate. Some people avoid tech for reasons other than skills (i.e. they don’t enjoy programmign). (3) Lastly, there is not a significant one-time migration cost for participating in our experiment. The tech industry rewards high skill levels, and therefore is likely to attract high-skill migrants from traditional career paths.
Administrative data used to test the predictions of the Roy Model often include wage level and educational achievement Borjas et al. (2018). In this experiment we bring more characteristics into the observable domain through targeted survey questions. This allows me to study who selects into a high wage opportunity. We assume that subjects will pursue their best alternative. Therefore, a high outside opportunity cost will make the programming job less attractive. This experiment was designed to have a measure of the components that would go into the utility of taking a job that involves programming.
At a given wage level, such as $15, the probability that a subject participates is a function of the following components: the probability of actually earning the wage conditional on passing the training quiz; the future value of the skills gained through participating; the subjective enjoyment of the task; and the opportunity cost of the time it takes to do the task. Therefore, the probability of accepting the job for a low wage increases if a subject enjoys programming or has a future value for technology skills.
Expectations of actually earning the high wage by passing the quiz are captured with the predictions about quiz performance. More confident subjects will have a lower reservation wage because they expect to receive the high payment after training. However, the future value of programming skills should be lower among subjects who report that it is “unlikely” that they will program in their future career. To measure the subjects’ subjective experience, we use the self-reported answer about whether they enjoy programming. For an estimate of the opportunity cost of the time it takes to return to the lab, we use subjects’ reservation wages for the counting task.
If the wage offer per hour increases, then more students will want to program. But there might be other ways to alter behavior. The Google (2014) survey found that the most important predictor for women choosing computer science was encouragement. Encouragement should have no effect according to classical theory because it is cheap talk. However, cheap talk has been found to influence behavior (i.e. Levy et al. (2011); Fehr et al. (2007)). An encouraging message could increase confidence in one’s own ability to do the task in the short-term or in the future.
Subjects form a subjective probability of how well they will perform with the information they have. For most students, they know the task involves “programming,” and they will use information they have acquired outside of the experiment to estimate their own ability to do the task. If subjects in INFO are offered both a sample quiz question and training material on how to answer, then their confidence may increase.
Given the evidence of gender participation in tech, it would be surprising if women are equally willing to participate in this experiment. Women are often characterized as being less confident in regards to technical work. The measure of confidence through quiz score prediction will provide a way to explain lower participation by women.
The initial experiment is designed to test several hypotheses:
Hypothesis 1: Job seekers are price-sensitive. More subjects will accept the job at higher wages.
Hypothesis 2: Females will be less willing to do the job, which might be a result of lower confidence.
Hypothesis 3 (ENCOURAGE): Confidence can be increased by adding an encouraging message. Encouragement will increase labor supply.
Hypothesis 4 (INFO): Confidence can be increased by letting students see a sample quiz question to reduce uncertainty. Showing the example will increase labor supply.
5 Results of the initial experiment
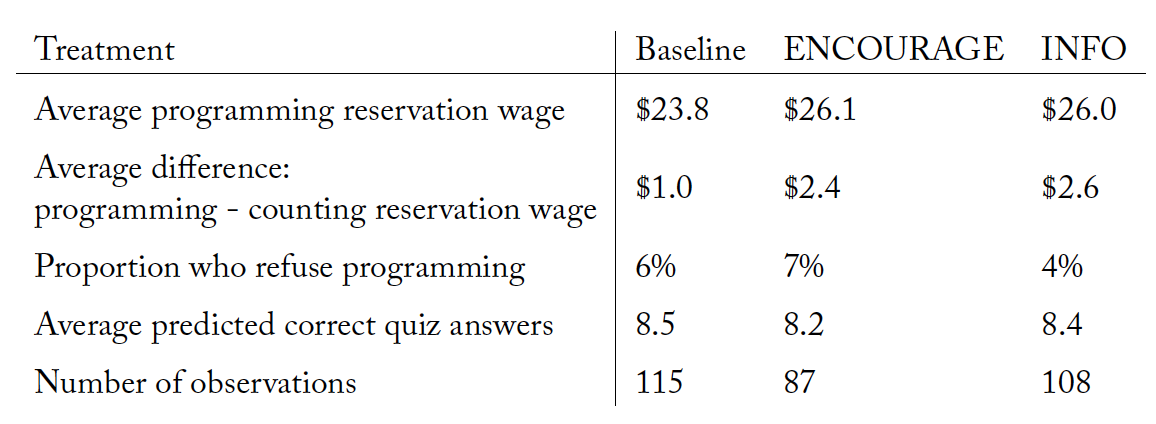
Most subjects who came to the lab for the $7 survey, in the initial experiment, indicated that they wanted an invitation to return to the lab. The average reservation wage for the programming job was about $25 and many subjects accepted the lowest wage rate of $15. Only 17 people (5.5%) refused an invitation to the programming task completely. The proportion who refused any programming invitation is displayed by treatment in Table 1.
5.1 Results of randomly assigned treatments in the initial experiment
About one third of the subjects saw a short encouraging message, in the ENCOURAGE treatment. In the INFO treatment, subjects saw one of the actual quiz questions along with an explanation of how to solve it, before they made their first decision. Neither the message nor additional information affected the incentivized behavior in the initial experiment.
The two treatments were hypothesized to lower the reservation wage by increasing confidence. Table 1 shows that the reservation wages are slightly higher with the treatments, not lower as predicted. A non-parametric Wilcoxon rank-sum test indicates no difference between the samples from Baseline in comparison to either treatment. A tobit regression, with or without controlling for sex, yields no significant treatment effect on reservation wage. A tobit is used because the reservation wage is censored below at $15 and above at $85.
Table 1. Main results across treatments, initial experiment
The reservation wage for a counting task (that has the same time commitment and compensation scheme as programming) was measured to control for the opportunity cost of time. We calculate the “difference,” or the reservation wage for programming minus the reservation wage for counting. The reservation wages for programming and counting were often the same, perhaps because most subjects were confident that they would pass the quiz. In the baseline treatment, on average, subjects demanded $1 more to program than to count.16There is a concern that subjects will select the counting wage to be the same as the programming wage because of a desire for consistency. The fact that the two numbers are often the same for an individual subject is a reason to take this concern seriously. Although it’s possible that subjects allow bias to influence their choice of counting reservation wage, it would be quite costly to allow that to affect their decision by more than one $10 increment. Note that if the actual difference in the reservation wages is small, then they will often appear identical because choices have to be made in $10 increments. If subjects are confident that they will pass the quiz, then it’s reasonable for them to view these two tasks as nearly equivalent. Subjects are always asked to state the reservation wage for counting second (after answering for programming) because the reservation wage of programming is the primary outcome of interest.
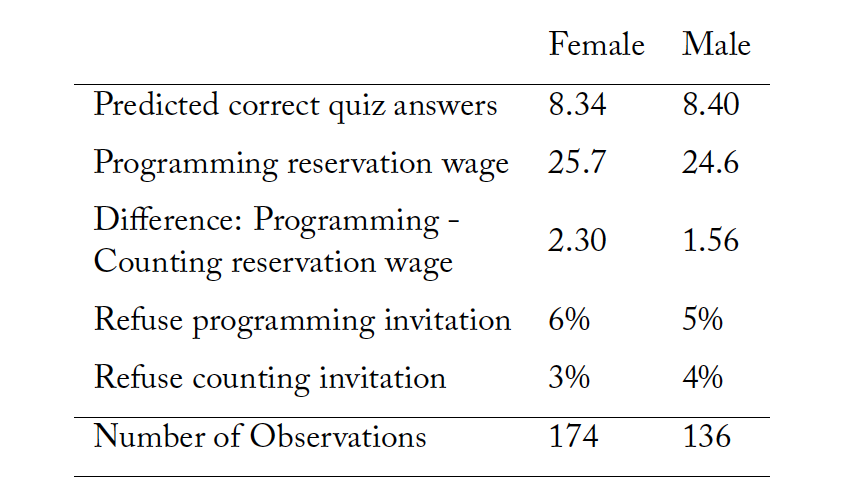
Table 2. Averages for incentivized choices, female and male, initial experiment
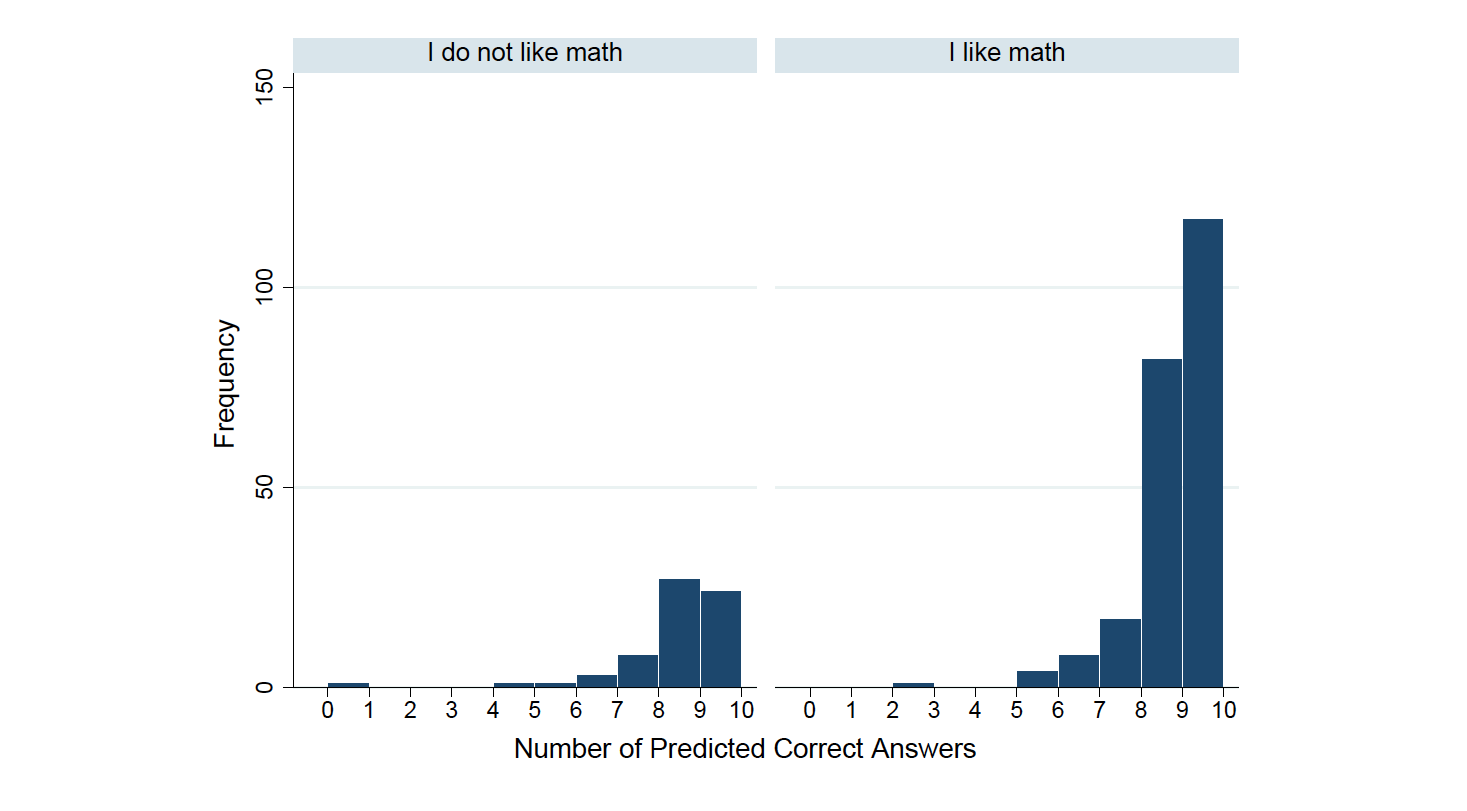
Subjects were incentivized to predict how many quiz questions they will answer correctly after training. A Wilcoxon rank-sum test indicates no difference in the predictions between baseline and treatments. The overall level of confidence is high. The modal answer is that they will pass the quiz with 8 correct answers (see Figure 2 for the full distribution of predictions).
Result 1: The encouraging message and extra information treatments do not increase willingness to program.
At the end of the survey, subjects were explicitly asked to explain why they made their decisions in the incentivized parts of the survey. Answers are reported in Appendix Table A1, for the initial experiment. The reasons offered by subjects were very similar across treatments. Most subjects were motivated by money and a majority said that they valued the chance to get technical training. One third expressed doubt about whether they would be able to pass the quiz.
5.2 Investigating the Gender Gap in Tech
In the survey, subjects make three decisions that are incentivized by potential future payments. The largest payment is determined by the reservation wage set for programming and counting. Additionally, conditional on returning to train, there is a chance to earn an extra $1 for correctly predicting how many questions will be answered correctly on a 10 question quiz. For the decisions that involved financial incentives, male and female students behave nearly identically.
Result 2: Male and female subjects behave in the same way for choices that are incentivized.
Female students are not less willing to take a short-term programming job, so their labor supply curve is the same as males. When asked a specific question about beliefs in their own performance, they appear equally confident, as shown in Table 2.
Google (2014) found that young women were only half as likely to have been encouraged at home as male students. The sample at this university shows much more similar rates of previous encouragement, which might explain why behavior is similar. Nearly half of female subjects report that they had been previously encouraged to study computers, and that is a potential explanation for the ineffectiveness of the ENCOURAGE treatment.
The unexpected similarity between male and female participants motivated the High Stakes design in which there is both higher risk and a larger potential reward for programming. There is more analysis of gender differences in section 6. Although behavior was the same for incentivized choices, there were significant differences in the answers to self-reported survey questions.
5.3 Self-reported characteristics: subjective attitudes and previous training
After making the incentivized choices, subjects answer questions about themselves and their previous exposure to computers. Only half of the subjects have taken classes in computer programming. This substantial variation allows for meaningful tests.
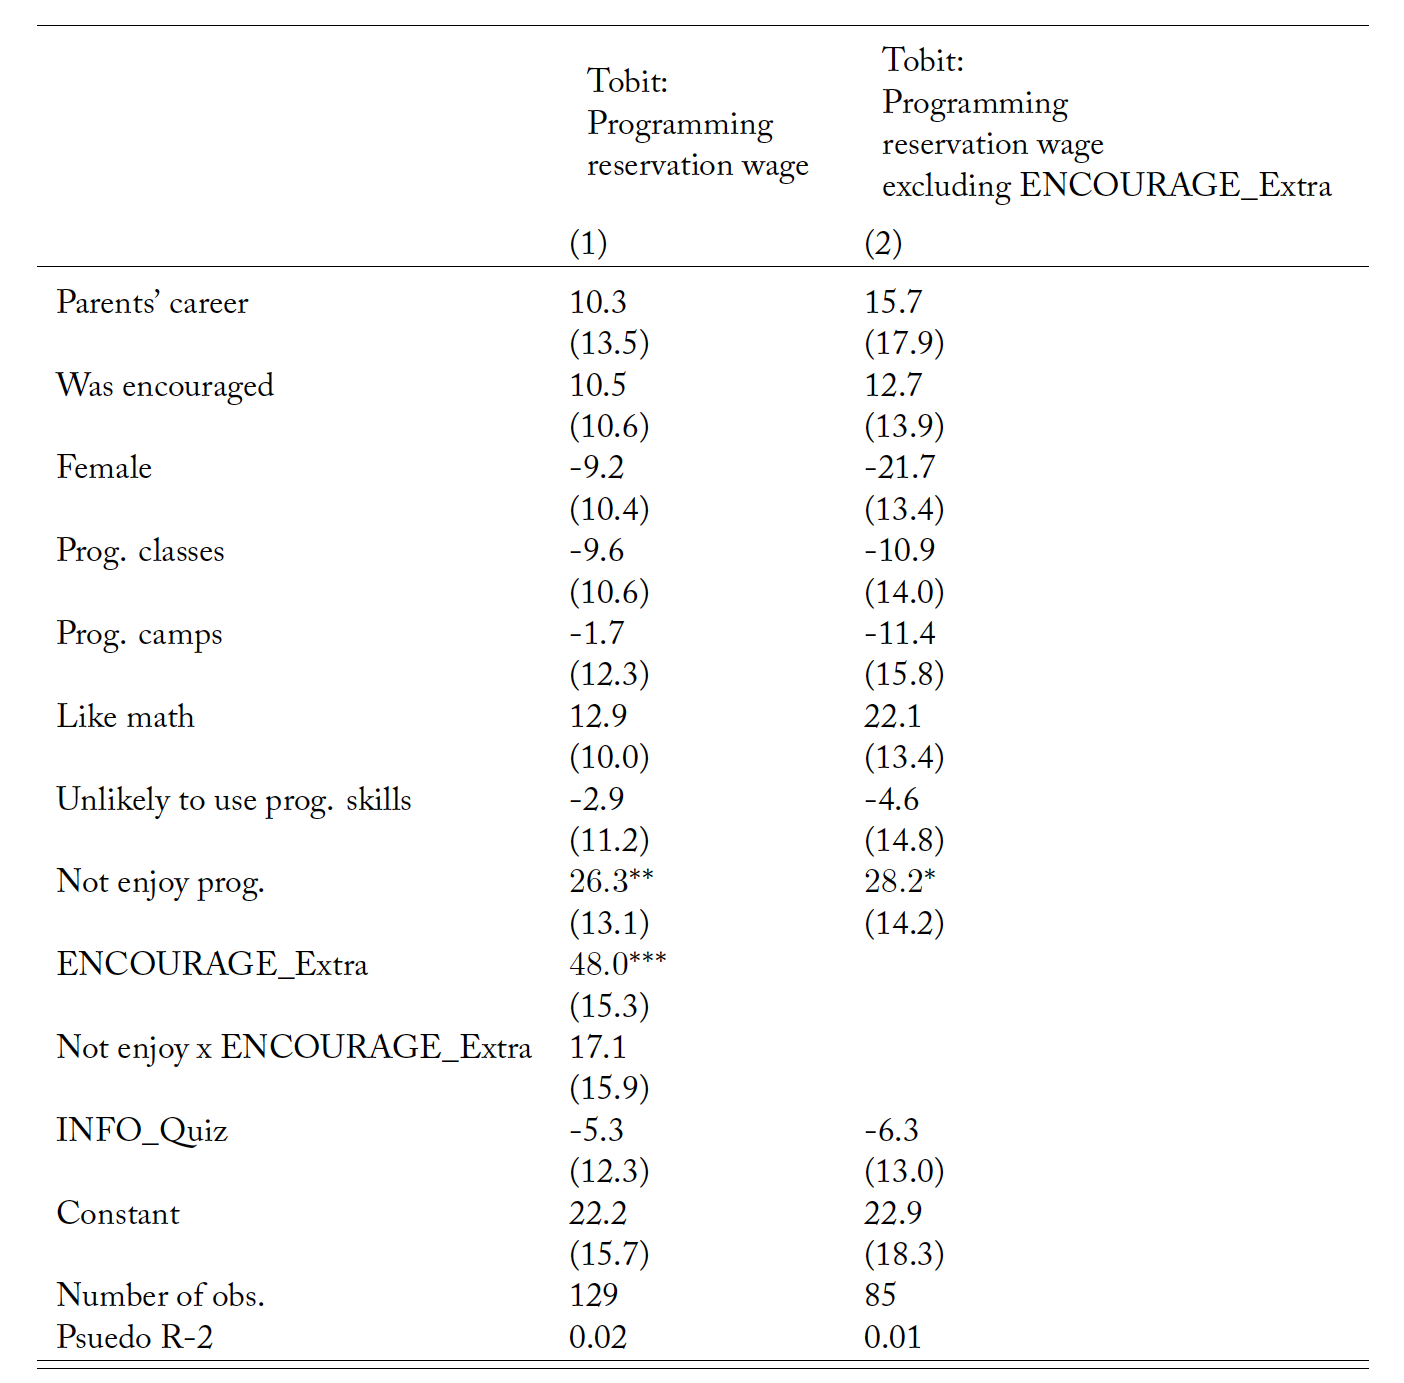
What explains the variation in willingness to be paid? The most significant variable is whether subjects believed that they would enjoy programming. Those who do not enjoy programming select a higher reservation wage because they require a compensating differential. This section focuses on results from the initial experiment, and the following section shows that the effect of enjoyment is also substantial in the High Stakes experiment.
This sample of subjects (from a large US state university) had access to better educational resources than a nationally representative population. Less than 5% of participants said their high school did not offer calculus.17By one estimate, half of US public high school students don’t have access to calculus (Civil, 2014). Most of the students had access to AP math or computer science courses in high school, even if they did not choose to enroll. The majority of these students had previously selected into the business school. Business students have some mathematical training because statistics coursework is required in the business program. Importantly, almost no participants were already in a computer science major or profession.
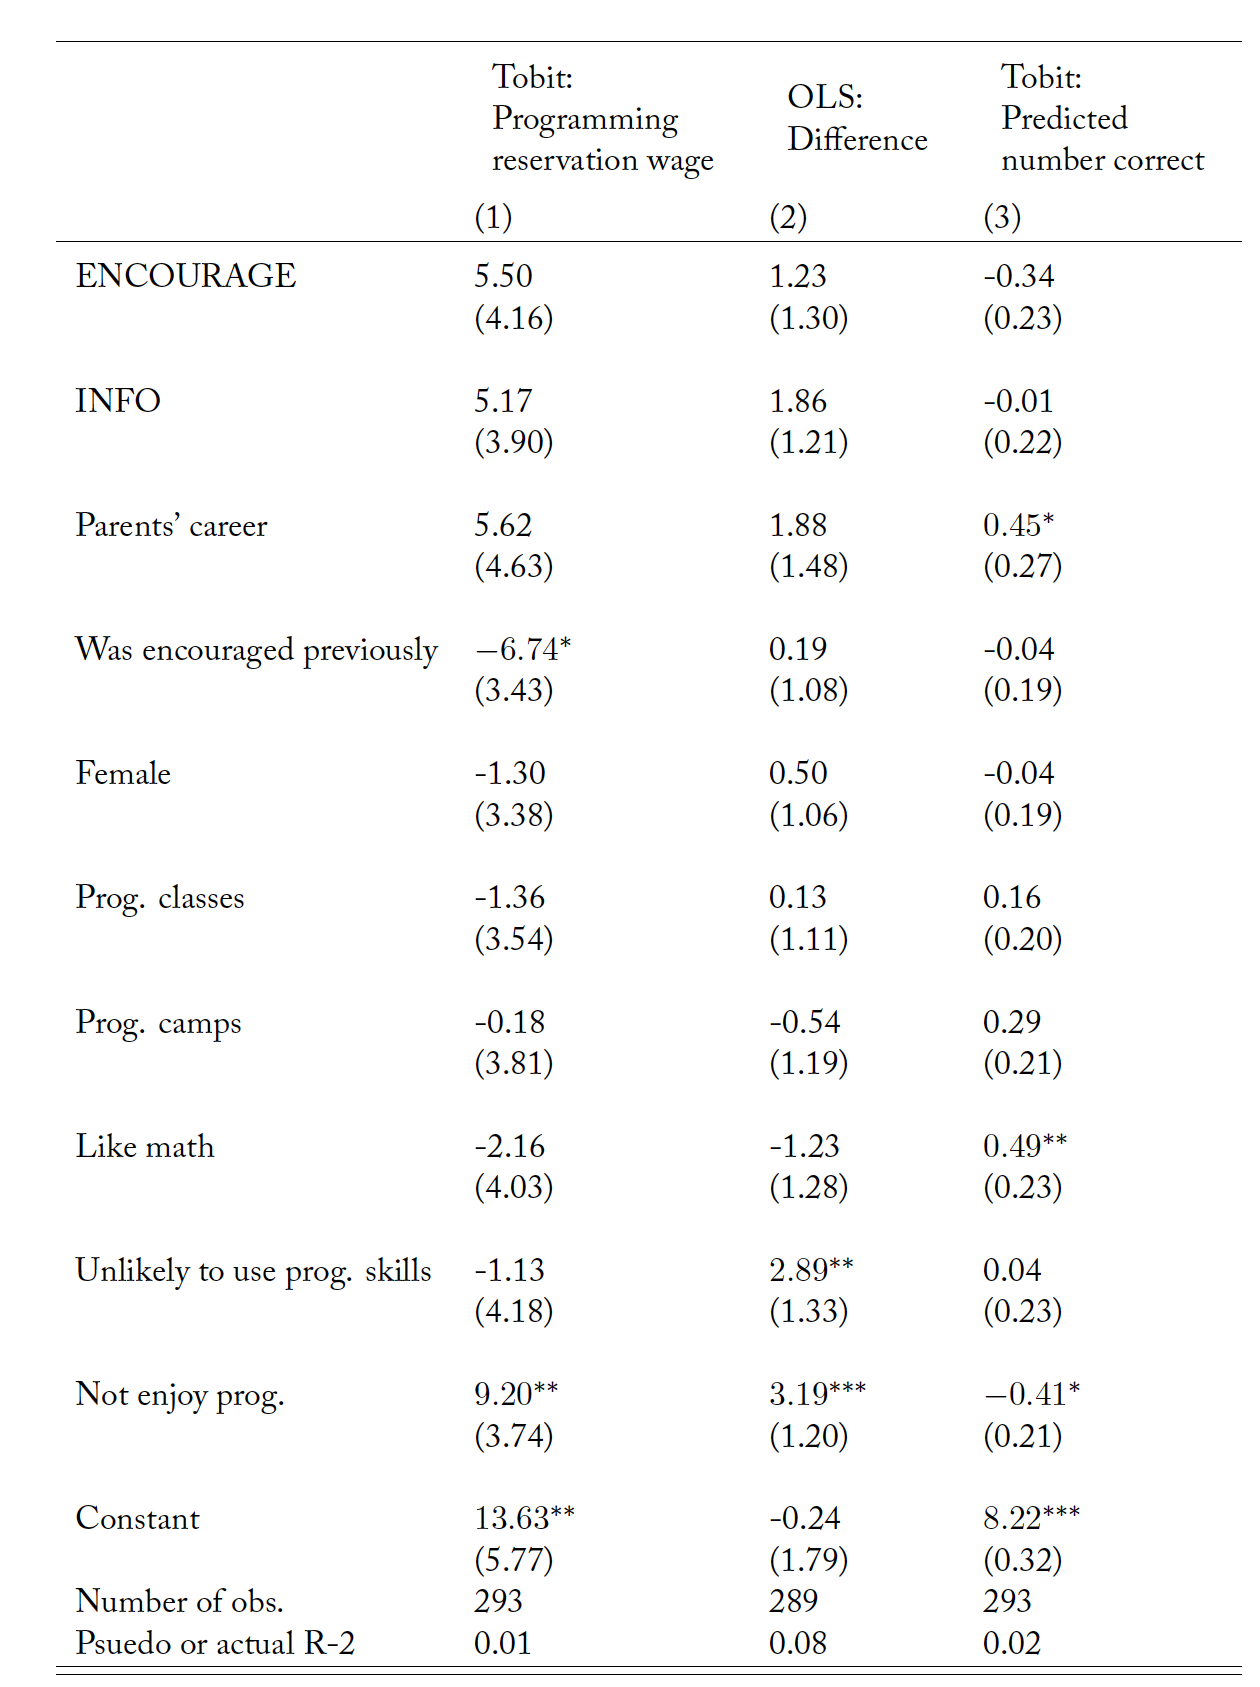
There is considerable heterogeneity among subjects in regards to exposure to computers and personal preferences for programming. Some of these features are predictive of behavior in the experiment. Table 3 presents the influence of several factors on the incentivized decisions in the initial experiment. The treatments have no effect, as previously reported. The next two independent variables in Table 3 are personal influences: whether any parent’s career involved programming and whether the subject had been encouraged in the past to study computers. The finding that parents’ career has little effect is consistent with the Google (2014) survey.
Model (1) in Table 3 estimates the effect on the reservation wage to program. The dependent variable in Model (2) is the programming reservation wage minus the counting wage.18There are less total observations in Model (2) in Table 3 because the difference can only be calculated for people who accepted both types of jobs at one of the possible wage levels.
Prior training could in theory reduce the risk of not passing the quiz and increase the expected financial benefit from the job. However, classes and camps have no effect.
The first variable in Table 3 that affects the difference between programming and counting is whether a subject believes that it is “unlikely” that they will use programming skills in their career. Subjects who do not expect to use this skill in the future demand almost $5 more to program than to count on average.
Table 3. Determinants of incentivized choices, initial experiment
Standard errors in parentheses. *p<0.1; **p<0.05; ***p<0.01
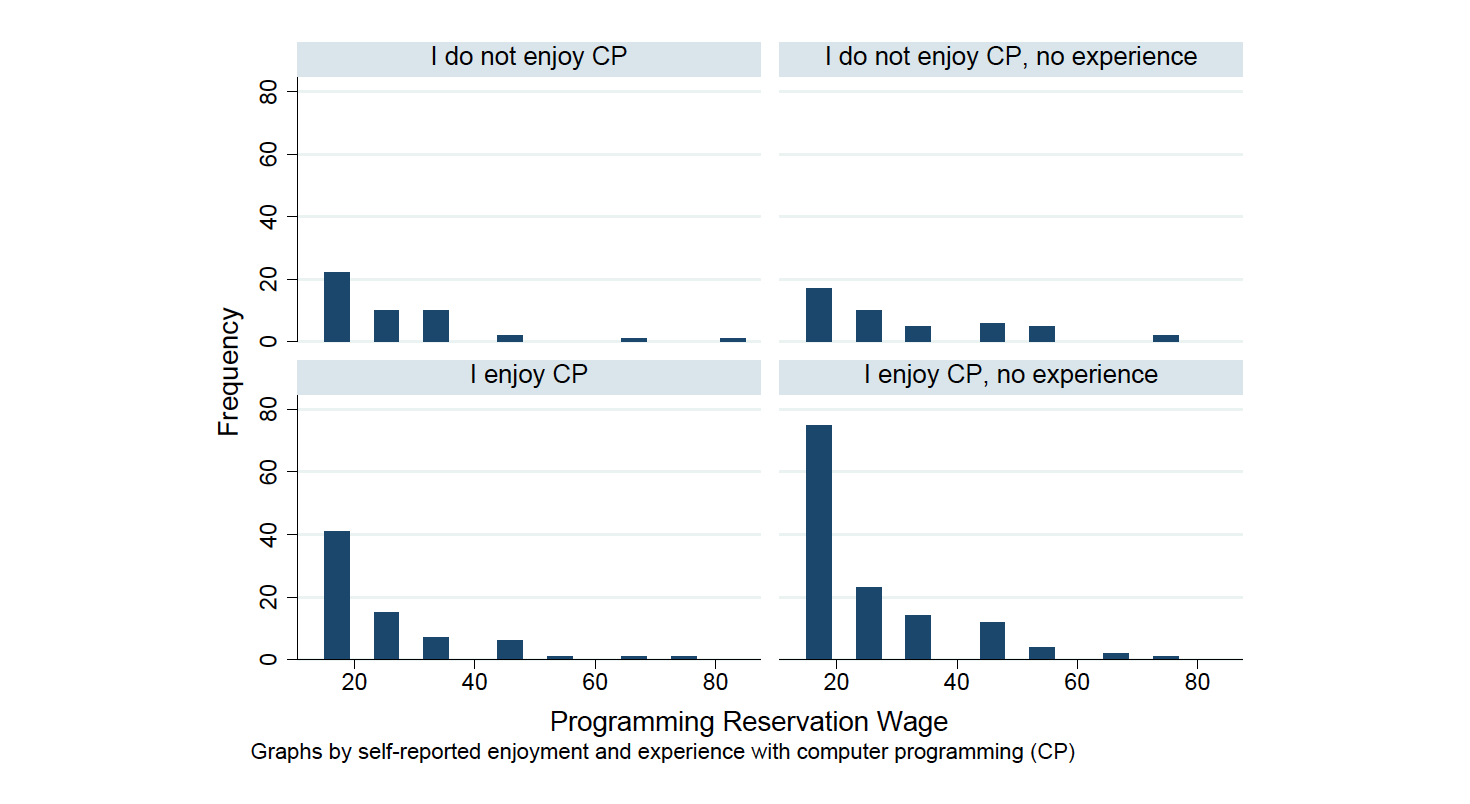
Figure 1. Histogram of reservation wage for programming job, by reported enjoyment of computer programming (CP), all treatments pooled in initial experiment
The largest determinant of reservation wage that survives the control for opportunity cost in Model (2) is whether subjects anticipate that the programming task will be unpleasant. Subjects who say they enjoy programming are more willing to do it at a given wage rate.
The model input variable ‘Not enjoy prog.’ is a composite of survey answers. Subjects who say they enjoy programming are grouped together, regardless of whether they claim to know this from experience or not. Figure 1 shows the frequency of four possible responses to the survey question.
Result 3: Subjects who do not enjoy programming have a higher reservation wage to program, and they demand more money to program than count.
People who do not enjoy programming increase their reservation wage by almost an entire $10 increment. Most people who say they enjoy programming select the lowest wage level of $15 in the initial experiment, which implies earning $10/hour for both the training and the task. Subjects who do not enjoy programming are more likely to reject the lowest wage level for programming.
The most important predictor of how students will view programming in comparison to the alternative job is their subjective attitude specifically toward computer programming. People who do not enjoy programming need to be paid $3.19 more to program than to come back and spend time in the lab for a guaranteed easy payment by counting.
Using the same set of self-reported characteristics, Model (3) in Table 3 presents associations with the incentivized measure of confidence. Students predicted how many quiz questions out of 10 they would answer correctly, knowing that 8/10 is required to pass. Once again, there is a significant effect for not enjoying programming. People who do not enjoy programming predicted that they would get fewer questions correct. The effect size is about half of one question. On average, in the initial experiment, people who don’t enjoy programming predicted they would get 8.12 questions right. Students who expect to enjoy programming predicted, on average, that they would get 8.54 questions correct.
Figure 2. Number of predicted correct answers on this quiz, by math preference, treatments pooled, initial experiment
It is possible that confident subjects believe they will enjoy programming because they expect to be good at it. Expecting to use programming in the future does not seem associated with confidence. Having attended an extracurricular camp is associated with a small marginally significant increase in confidence in Table 10.
Another subjective characteristic that is associated with confidence is whether a subject likes math. Those who like math expected that they would do better on the programming quiz. Figure 2 shows the frequency of responses for people who like math and those who do not in the initial experiment. Table 3 indicates that subjects who like math estimate their performance on the quiz will be higher by half of one question (p-value < 0.05).
Result 4: Subjects who enjoy math and programming are more confident.
See Appendix A.2 for more analysis of self-reported answers. Those who enjoy programming were more likely to expect doing programming in a future career. Higher academic performance is associated with liking math but not the enjoyment of programming.
5.4 Robustness of the effect of enjoyment
The significance of the effect of enjoyment, evident in Table 3 for the initial experiment, can be demonstrated in several other ways.
In the initial experiment, there were 38 subjects (about 10% of the sample) who asked for an invitation to count for $15 but also refused to program for $15. These students were available to return to the lab and have a low upper bound on the opportunity cost of their own time. We used a logistic regression to see how self-reported characteristics affect that decision. The margins for the logistic regression indicated that someone who does not enjoy programming had a 16% chance of being in that group who would count and not program for $15. Someone who enjoys programming was only half as likely (8% chance). This is further evidence that subjective attitudes are important, and other factors have very little influence.
The vast majority of subjects who had come to the lab initially for $7 indicated that they wanted the option to return for another study that involves computer programming. In the initial experiment, there were 10 people who did not want to return to program but who did ask for an invitation to count. These subjects were able to return to the lab but specifically did not want to program at any wage. Out of 10, 8 of those subjects said that they did not enjoy programming. A chi-square test indicates that this group is statistically different (p-value< 0.00) from the majority of subjects who enjoy programming.
Result 5: Subjects who do not enjoy programming are more likely to refuse the programming task entirely.
The effect of enjoyment is anticipated ex-ante for the High Stakes follow-up experiment. The effect remained strong at a different university, as shown in Table 9.
Lastly, there is another way to assess the effect of enjoyment on confidence, by examining the answer to the self-reported measure of confidence to pass the quiz. Using the same independent variables as Table 3, the important influences on the self-reported measure of confidence appeared the same. Liking math and enjoying programming significantly increased confidence (p − value < 0.05, in the initial experiment (n=310)) . No other variable has a significant effect. The 108 subjects in INFO got to see what the task actually looks like before answering the questions about confidence. Within that sample, the result about subjective attitudes still generally held. Liking math was still significant and enjoying programming became less significant (p-value = 0.14).
5.5 Reservation wage and the utility of the task
In the spirit of Roy’s (1951) labor allocation decisions model, we assume that subjects will pursue their best alternative. Therefore a high outside opportunity cost will make the programming job less attractive. At a given wage level, such as $15, the choice to participate took the following components into account:
(1)
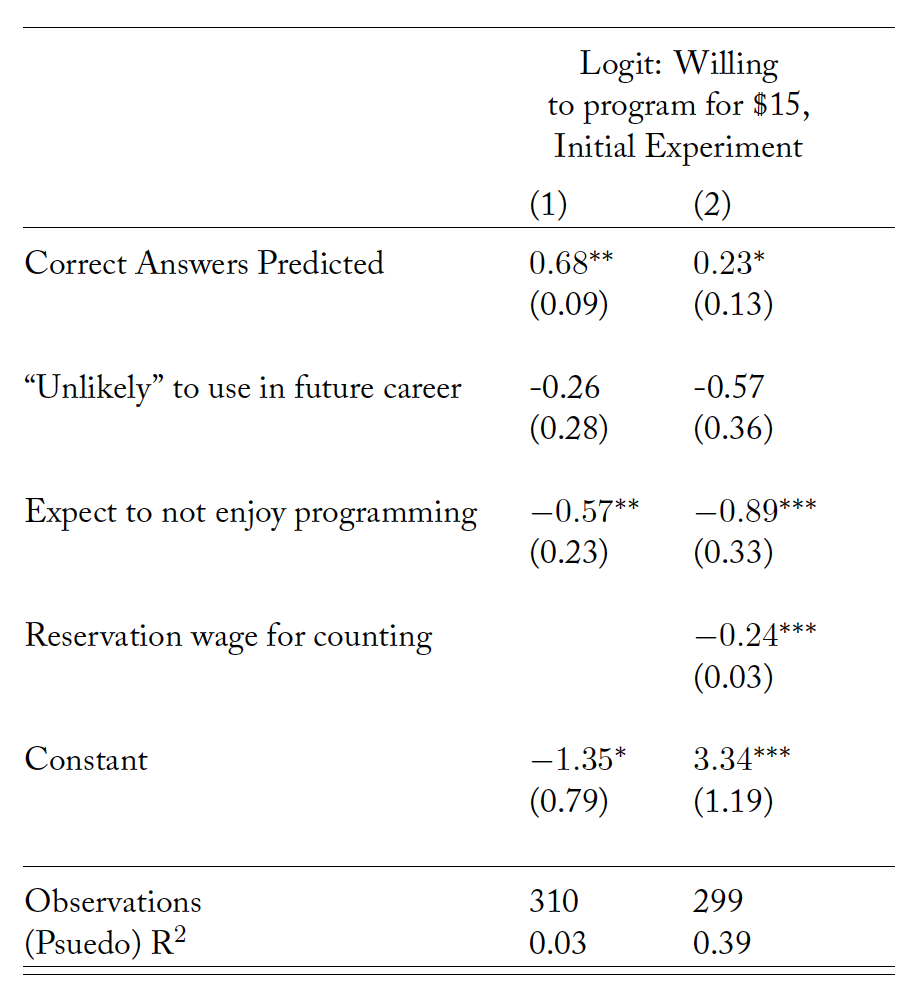
Expectations of actually earning the high wage by passing the quiz are captured with the predictions about quiz performance. The future value of programming skills should be lower among subjects who report that it is “Unlikely” that they will program in their future career. The self-reported answer about whether subjects enjoy programming indicates the subjective experience value. The reservation wage for counting serves as an estimate of the opportunity cost of the time required for the job.
Table 4. Utility of programming model in the initial experiment
Standard errors in parentheses; * p<0.10; ** p<0.05; *** p<0.01
Models (1) and (2) in Table 4 show the results of a logit model predicting whether a subject asks for an invitation at the lowest wage level of $15 in the initial experiment. Willingness to train is higher for those who are more confident that they will answer quiz questions correctly. Subjects who do not believe they will use programming are less likely to program, as predicted, but the relationship is not significant.
Consistent with earlier results, enjoyment of the task is important, with or without controlling for opportunity cost. Enjoyment enters the model as a dummy variable. The reservation wage for counting is treated as a continuous variable, so a subject with a high counting wage is predicted to have a very low probability of programming for the lowest wage.
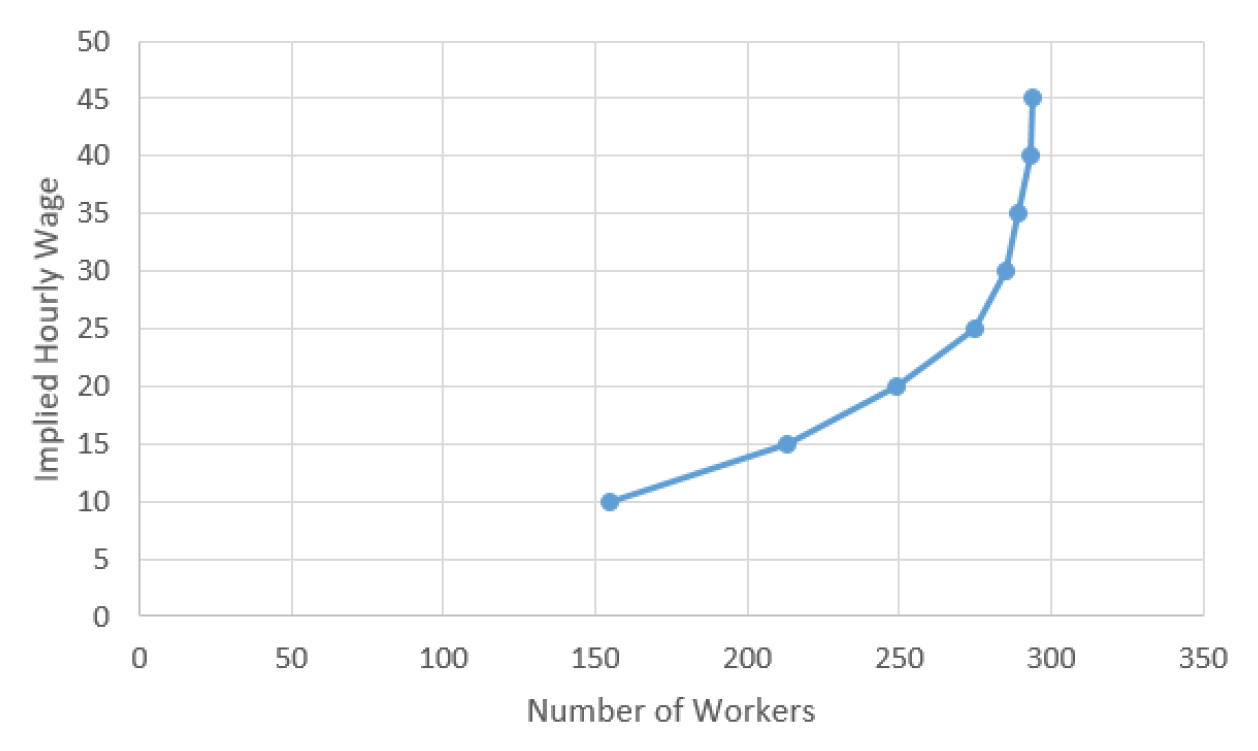
In the initial experiment, the labor supply level at the highest wage is double that of the lowest wage offer. Figure 3 shows the labor supply curve, excluding subjects who did not ask for an invitation to program at any wage.
Result 6: More subjects will program when the wage is higher.
It is possible that Figure 3 overestimates the true supply. Not all of the students who were invited to program returned (see Appendix A.3). Actual attendance to train for programming was not influenced by the wage offer, so the shape of the supply curve is probably correct, even if it is only an upper bound.
Figure 3. Labor supply at different wage offer levels, initial experiment
These results have policy implications. Most college students are not pursuing tech jobs, even though they seem like lucrative opportunities. Some policy makers have presented this as a problem that could be solved by boosting confidence. Many talented students do not pursue tech jobs because they would rather do something else with their time. That is not to say that confidence is irrelevant, indeed it is a significant factor in models (1) and (2) in Table 4. Confidence is an attractive target for policy makers. Our experiment shows that low-cost messaging may have very little effect, however. Even prior training, which is a more expensive intervention, seemed to have a small impact. The most effective means of getting people to program was increasing the payment.
If a student believes that programming is not enjoyable, is it possible to persuade them otherwise? This study indicates that is an important question for policy makers who seek to increase the labor supply for high-skilled technology jobs. The next section details a follow-up experiment that was designed to test the ex ante hypothesis about enjoyment and also find whether a gender gap would emerge when the risk level increases.
6 Follow-up experiment: High Stakes
The hypotheses in the High Stakes experiment are the same as the initial experiment, with one addition. The design in High Stakes is intended to intensify the effect of exogenous encouragement and of extra information. Thus, the prediction is that treatment effects will be amplified in High Stakes. High Stakes was conducted at a private university, near the location of the original experiment.
Hypothesis 5: Doing the job is less costly for subjects who enjoy programming. Subjects who enjoy programming will be willing do the job at lower wages.
61. High Stakes Treatments
The High Stakes_Baseline treatment was very similar to the baseline treatment of the initial experiment. The range of possible payments was $5 to $145, in $10 increments.
Subjects could complete the training and task remotely on campus or on their own computers. Subjects were paid $7 in cash for taking the survey. The training was exactly the same as the initial experiment, however there was no payment for the training. The task was extended so that it would take two hours, and subjects were paid only if they completed the task correctly. There was an objective grading rubric to judge if the task was complete. For example, subjects were given a dataset and asked to calculate descriptive statistics, for which there were objective correct answers. The phases of High Stakes are:
Initial Survey ($7) → One-Hour Training and Quiz (no payment) → Two-Hour Task ($5-$145 if completed)
The ENCOURAGE_Extra treatment had a slightly longer encouraging message. A statement was added, based on the fact that most students had done well on the quiz in the initial experiment.
ENCOURAGE_Extra treatment wording:
… training to answer questions about code. You will have access to all of the training materials while you take the quiz.
If you have never done computer programming before, don’t worry. Other students with no experience have been able to complete the training and pass the quiz.
The INFO_Quiz treatment, like the initial experiment, provided subjects with a sample quiz question and an explanation for how to answer it. In High Stakes, subjects not only had the option of reading the extra information, but they were forced to answer the sample quiz question. This ensured that subjects saw the additional information. It is possible to answer the question correctly if the subject reads the explanation. Subjects were not graded or told whether their answer was correct.
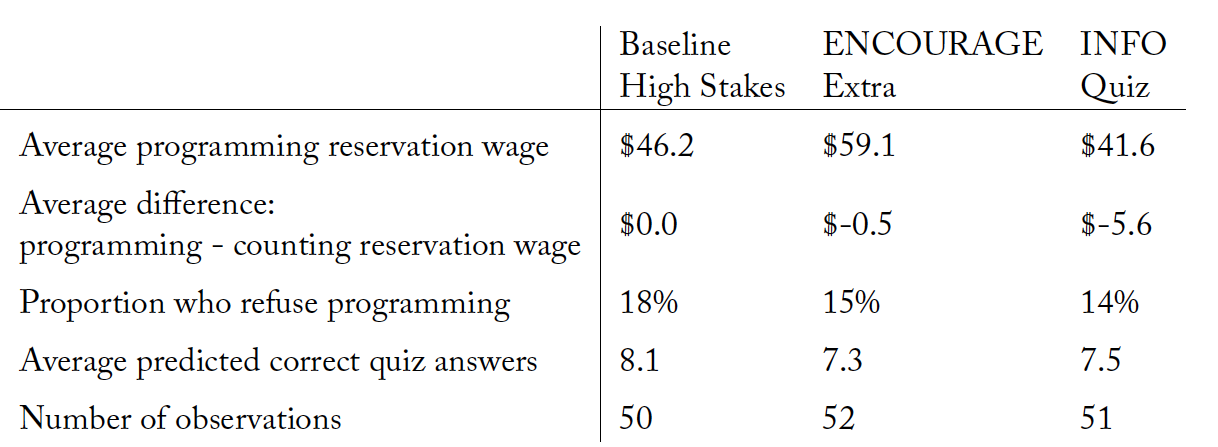
Table 5. Main results across treatments, High Stakes experiment
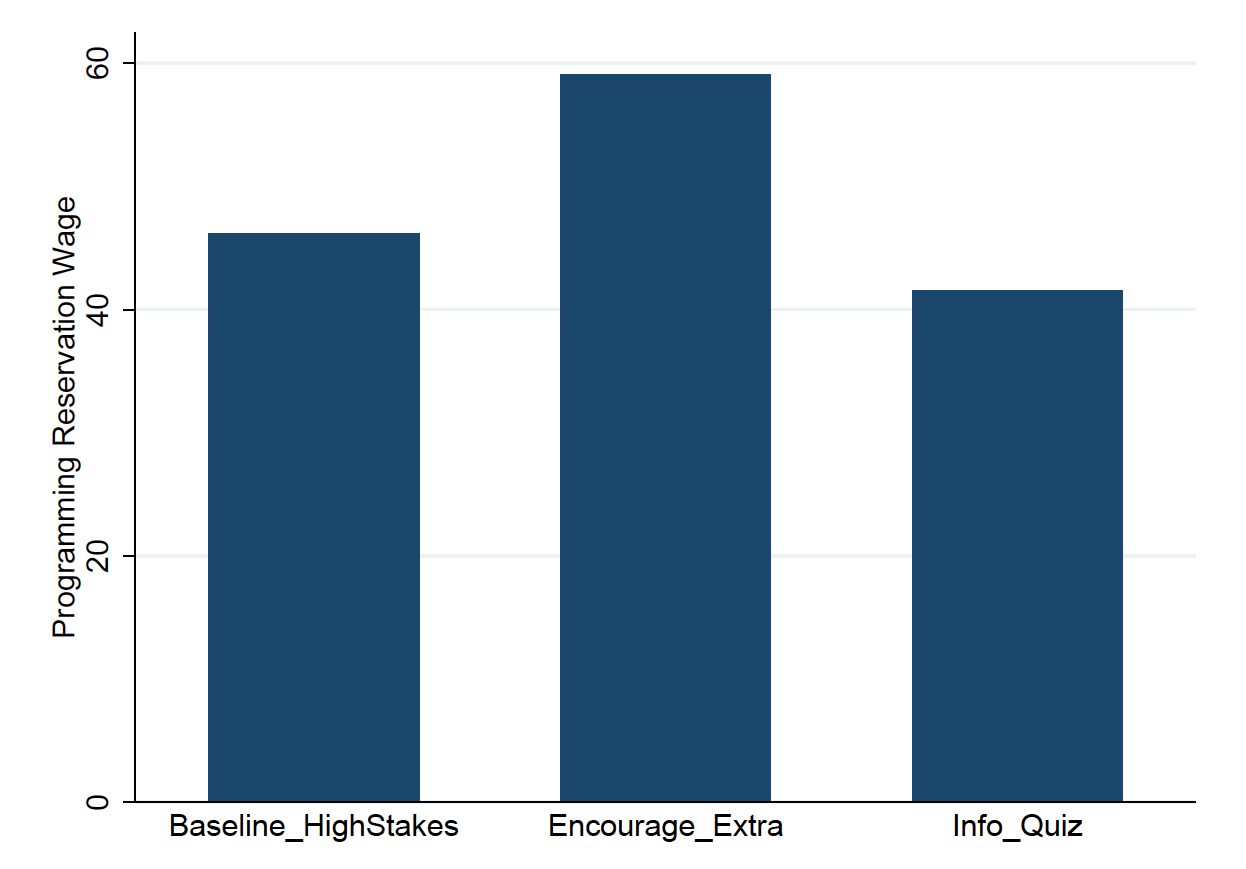
Figure 4. Programming reservation wage ($) by treatment, in the High Stakes experiment
Result 7: The longer encouraging message in the High Stakes experiment raises the reservation wage and decreases measured confidence.
According to a non-parametric Wilcoxon rank-sum test, the reservation wage in ENCOURAGE_Extra is higher than other treatments in the High Stakes experiment (see Figure 4 and Table 5). The two-sample Wilcoxon rank-sum test comparing 44 subjects in ENCOURAGE_Extra and 41 subjects in BaselineHighStakes yields a marginally significant treatment effect (Prob. > |z| = 0.051). If BaselineHighStakes and INFO_Quiz are pooled, then the reservation wage in ENCOURAGE_Extra is significantly different (Prob. > |z| = 0.026). This analysis excludes subjects who rejected the programming job at any price because they do not state a reservation wage.
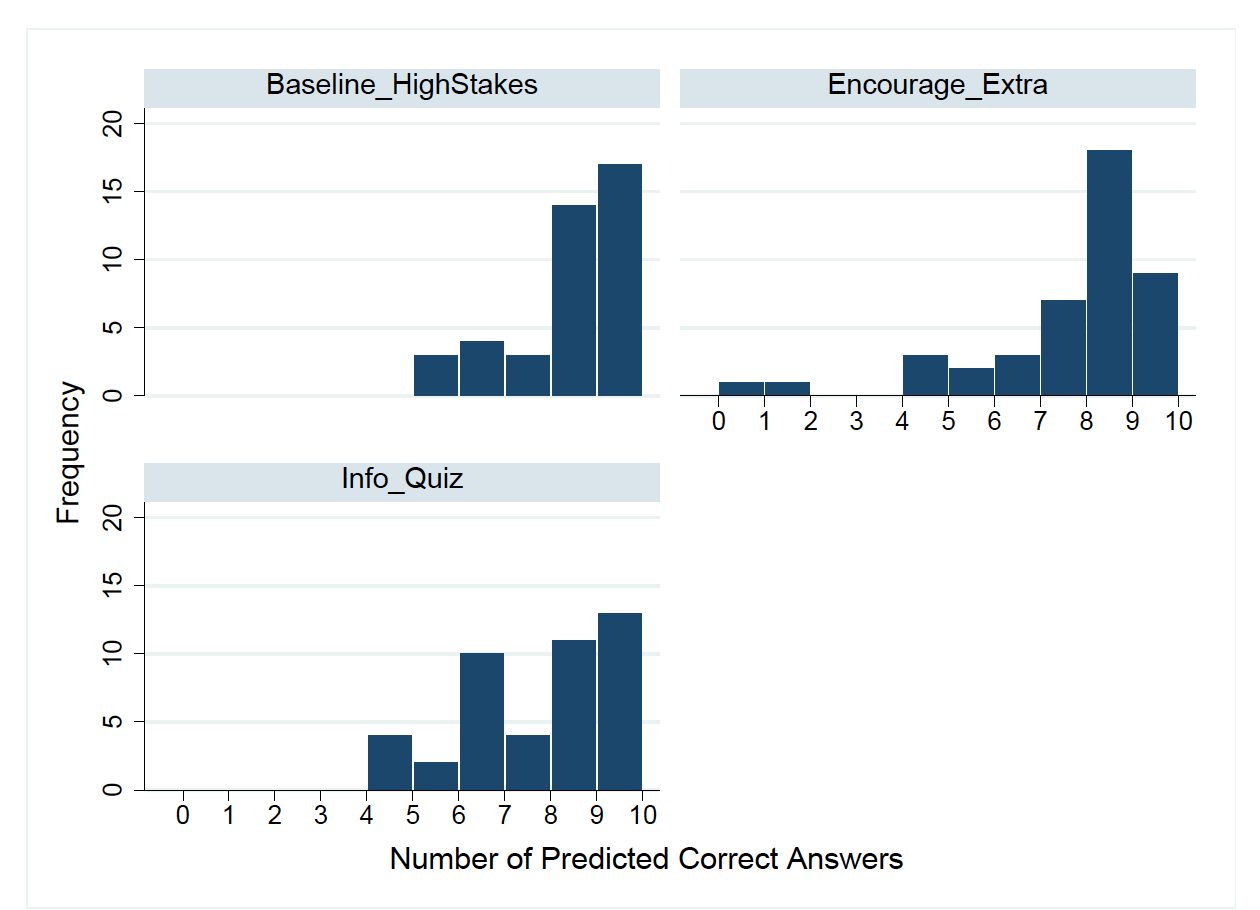
The incentivized measure of confidence is also lower in ENCOURAGE_Extra. Figure 5 shows that more subjects expected high test scores in BaselineHighStakes. According to a Wilcoxon rank-sum test, confidence is significantly lower in ENCOURAGE_Extra as compared to BaselineHighStakes (Prob. > |z| = 0.042). The rank-sum test result is not significant if BaselineHighStakes subjects are pooled with INFO_Quiz.
6.2 Demographics and High Stakes
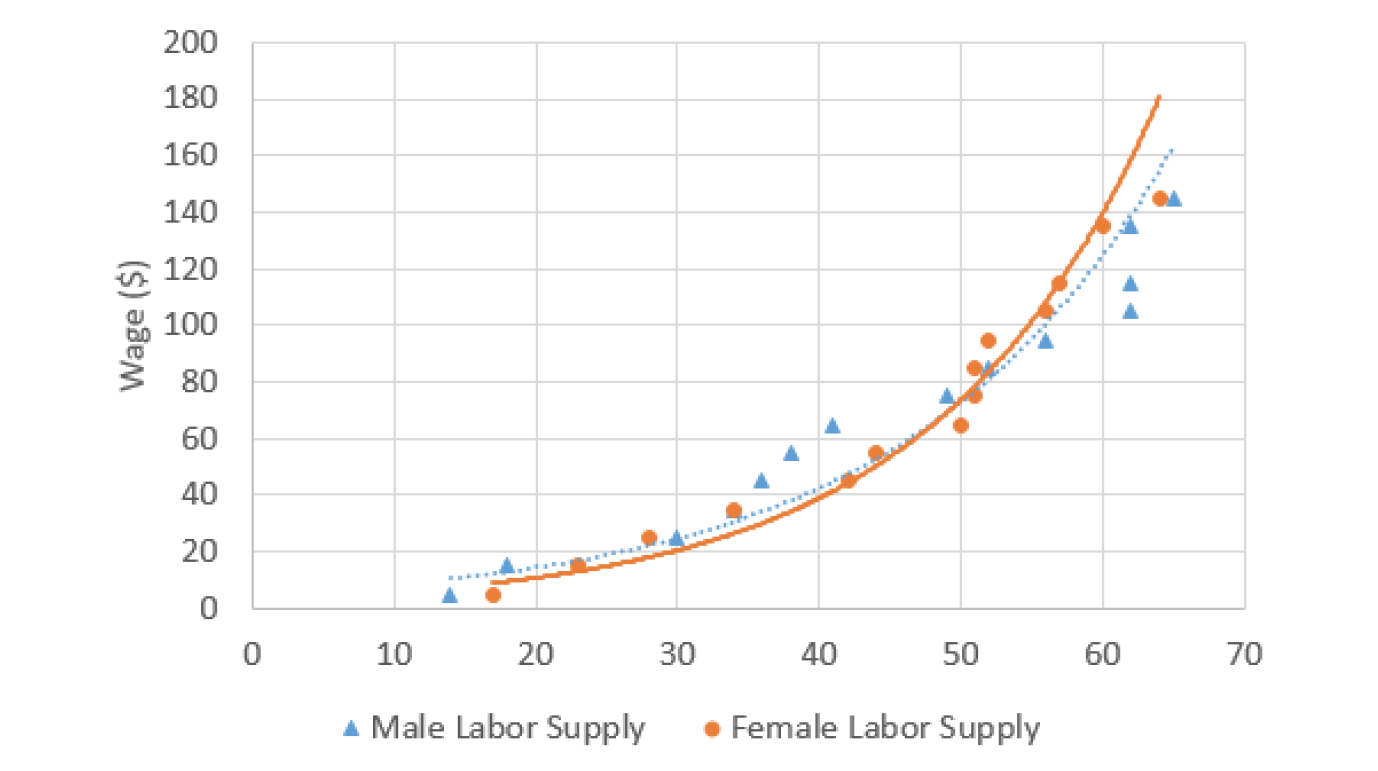
The labor supply curve in the High Stakes experiment, separate for male and female, is shown in Figure 6. The labor supply more than triples from the lowest wage to the highest wage. Most subjects will attempt this task, even if it sounds challenging; however, most of them require more than $10 per hour.
Figure 5. Number of expected correct answers by treatment, in the High Stakes experiment
Figure 6. Cumulative labor supply at different wages, males and females, in High Stakes experiment
Table 6. Demographic comparison, male to female
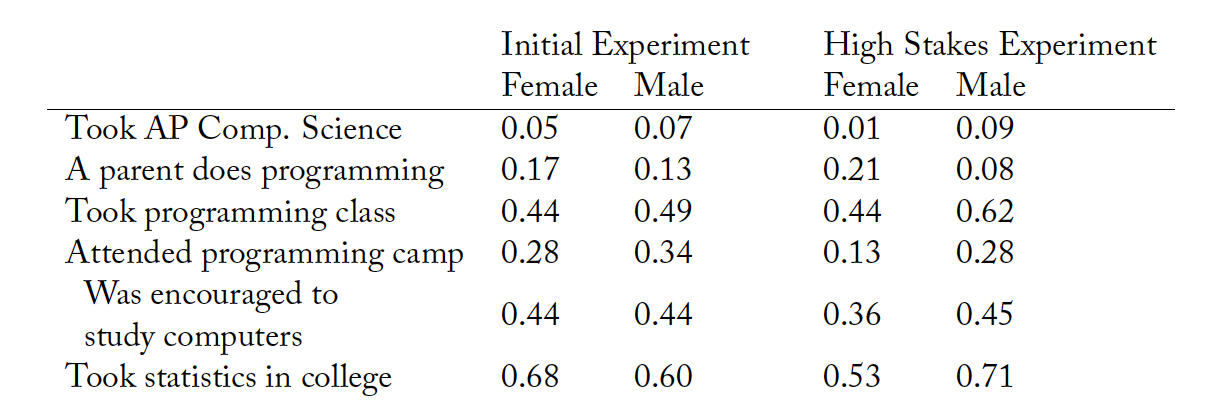
Table 7. Previous training and exposure, male to female
Figure 6 shows the implied labor supply curve in the High Stakes experiment fitted with an exponential trend line. This line demonstrates how many people would be willing to work for about three hours at different wages. Male and female workers are quite similar, just as in the initial experiment.
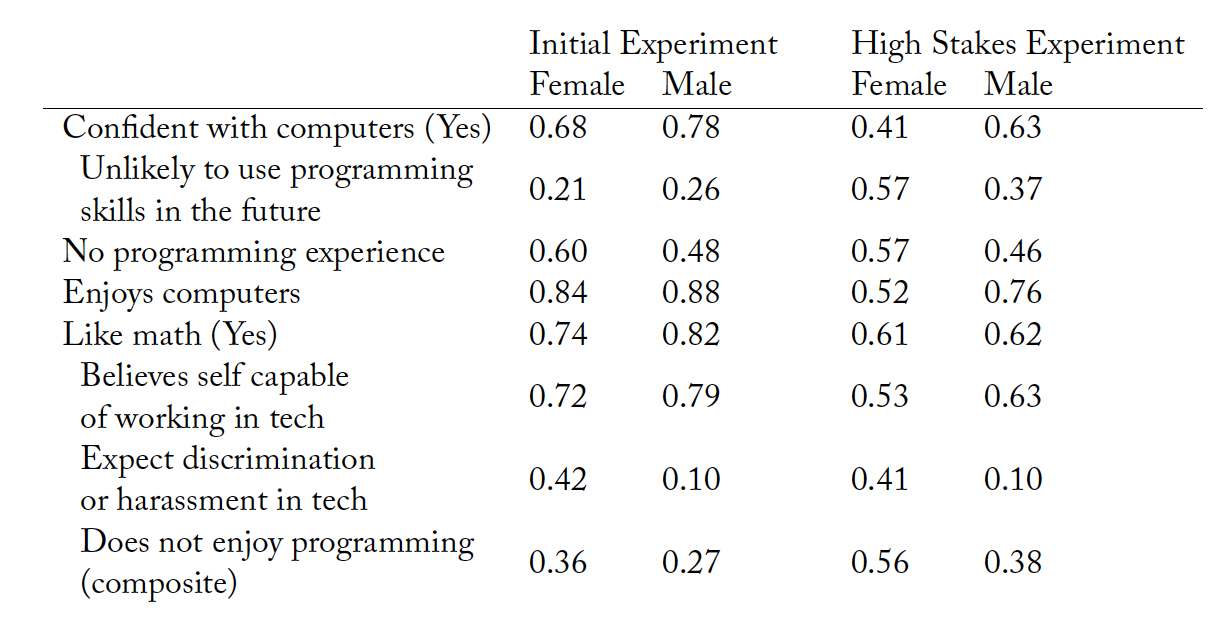
However, male and female students do not answer the self-reported survey questions in exactly the same way. These answers provide insight into why a gender gap may persist in tech that is not primarily caused by a skills gap. Self-reported survey answers indicate that male and female subjects do not perceive themselves in the same way and do not have the same career aspirations.
Table 6 shows that male and female subjects are similar along many dimensions, except that male students in the High Stakes experiment are more much likely to be in the business school. Subjects from the private university where High Stakes was conducted are less likely to have attended public high school because many of them attended a private high school in the US, not because there are more international students.
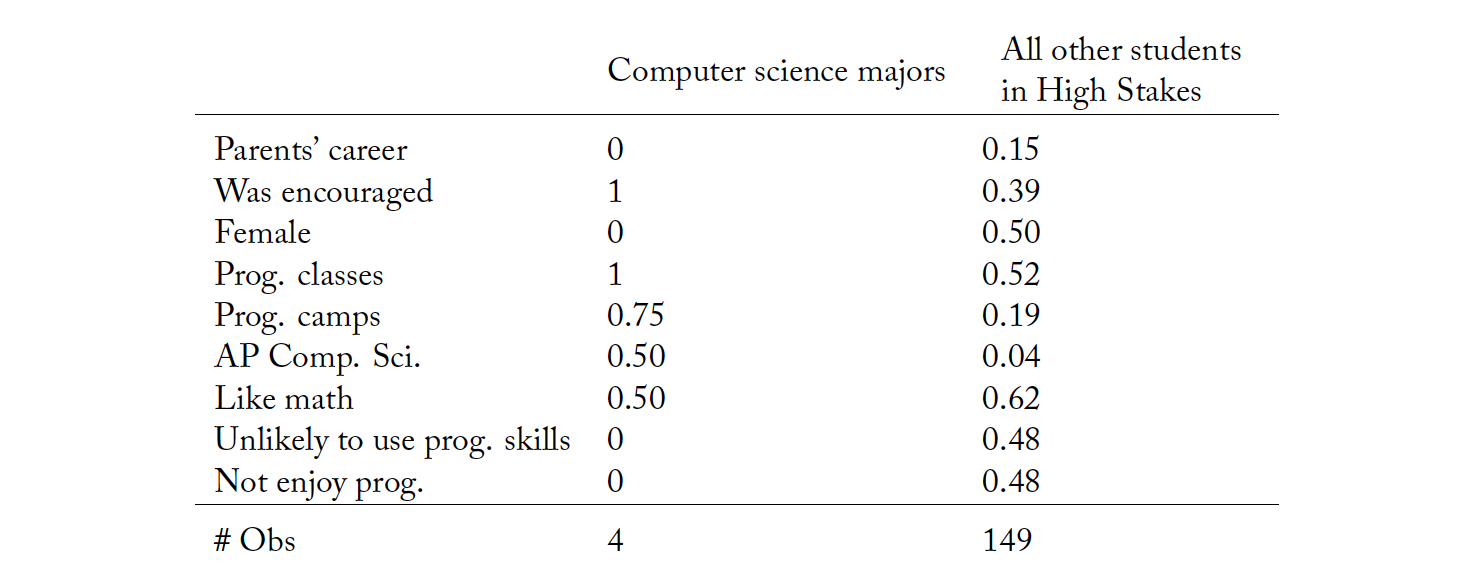
The responses in Tables 7 and 8 would look different if the experiment had been run with students who had already chosen to major in computer science.19In High Stakes, we asked students to report their college major. Summary statistics about the four (all-male) computer science (CS) majors are in A2. They all report having been previously encouraged, which is consistent with the Google (2014) finding about girls who choose CS majors. Students from a variety of majors were recruited intentionally. There are more tech job openings than students who choose computer science. Indeed, many people who work in tech did not major in computer science. This experiment investigates what might encourage students to take advantage of new job opportunities and acquire new skills.
According to Table 7, roughly half of all subjects have had a class in school that included computer programming training.20The proportion of students who took Advanced Placement CS before college is low. Students reported that many of their high schools did not offer AP CS, so it is possible that more would have taken AP CS if it had been available. Less than half did extracurricular programming or “camp.” The disparity in statistics education for the private university students is largely due to the fact that many males are in the business school where a statistics class is required.
Table 8. Subjective attitudes, male to female
More than half of all subjects believe that they could work in tech if they wanted to do so. In the case of females at the private university, it is a slim majority. Nonetheless, it foreshadows a workforce that can adapt if offered lucrative jobs, as demonstrated in the experiment.
Although male and female students react the same way to a job offer in the experiment, the subjects in this experiment still appear poised to experience a gender gap in tech after college. Female students say that they are less prepared in terms of formal classes. The answers in Table 8 indicate that females are less confident on average and perhaps less inclined toward those jobs. Male students are more likely to embrace a narrative that they are prepared for tech jobs and positioned to succeed in a technology career. Note that this is not a representative sample of college students in the United States. The finding is that equal behavior in the incentivized experiment is not mirrored with equal answers about their lives outside of the experiment.
Table 8 shows that females are more likely to say that they have no experience with computer programming (chi-squared test p-value = 0.036, initial experiment). The other two response options are ‘some training’ or proficiency in programming. The difference in reported experience level cannot be fully explained by the information subjects provide about access to camps and classes.21Women may believe that others consider them less qualified to program, holding their level of training constant. Dustan et al. (2019) find that women have different second-order beliefs about aptitude. Although females feel less experienced, there is not a large gap with regards to believing they could work in tech if they wanted to (72% for females versus 79% for males in initial experiment).
There is a large difference between males and females concerning an expectation of experiencing either discrimination or harassment if they pursue a career in tech (40% vs. 10%). In our study, we isolate a technical task away from the social environment of a technical community. It is possible that some of the women who want to participate in the experiment because they are willing to program are less likely to pursue a career in tech because the work environment is unfavorable. Females report that they believe they could work in tech if they want to. For some of them, whether they want to may depend on whether they would feel supported. Racial minorities, along with females, are more likely to say that they expect discrimination or harassment.
Enjoyment influences the reservation wage in High Stakes, when the powerful effect of the ENCOURAGE_Extra treatment is accounted for. Table 9 shows the effect of self-reported characteristics on wage choices. When allowing for an interaction between ENCOURAGE_Extra and enjoyment, enjoyment has a large and highly significant effect. The reservation wage to program can range from $5 to $145 in High Stakes. The effect size of about $28 for enjoyment is 20% of this range. Result 5 from the initial experiment is supported in High Stakes.
6.3 Confidence with Merged Data
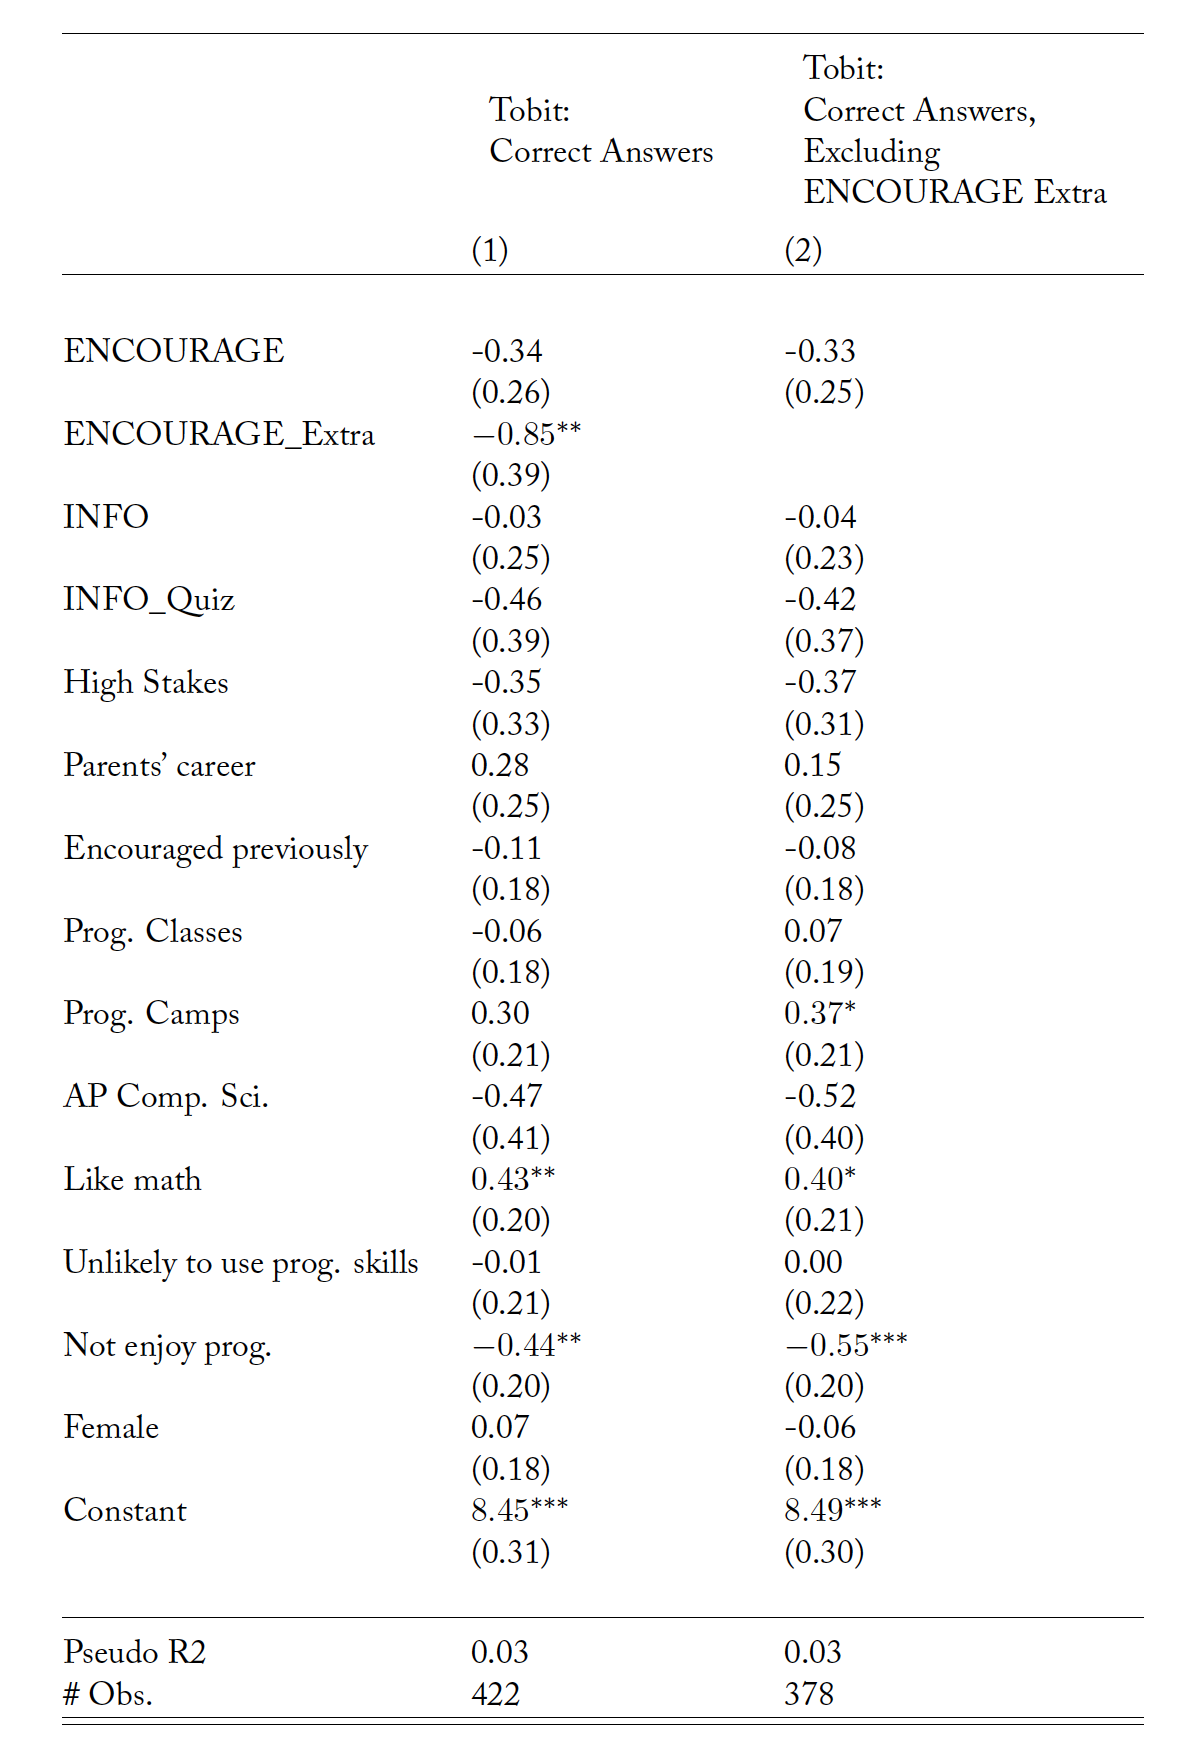
In both experiments the training quiz was the same. Subjects were asked to predict their performance on a range of zero to 10. Subjects from both experiments, with a control for the High Stakes environment, are merged in Table 10 to create a large dataset for explaining confidence.
There are several insights from Table 10. The ENCOURAGE_Extra treatment makes people less confident (the opposite of the intended effect). Subjective preferences regarding math and programming have significant relationships with task confidence. If a subject likes math or enjoys programming, he or she reported higher confidence. Importantly, and perhaps surprisingly, female subjects did not appear less confident in their ability to pass this quiz.
This confidence is not unfounded. A subset of subjects were invited back to actually do the training and take the quiz. There was a large financial incentive to do their best on the quiz. Among subjects who were invited, male and female subjects were equally likely to do the quiz and there is no difference in their performance. Most subjects passed with a score of 8 or higher.
7 Discussion
The large survey by Google (2014) led to several policy recommendations.22Google may have a sample that is more nationally representative than this experiment. However, when they compare computer science (CS) students and graduates to non-CS students, they are using college students as their sample, like this experiment. First, they recommended an outreach program so that “parents learn how to actively encourage their daughters.” The Google study found that women who study computer science were twice as likely to have been encouraged. Although encouragement was not randomly assigned, the Google study had many demographic controls.
Our experiment provides cautionary results in regards to policy applications of the Google finding on encouragement. Is there an encouraging message that is cheap to implement on a large scale? The message in our experiment was not effective. It is possible that a different phrasing would work, and considering the size of the effect found by Google this merits future research. However, perhaps encouragement only works if it comes from people who are known and trusted by the recipient, which makes it difficult to scale as a policy. The High Stakes experiment demonstrates that messages intended to encourage students can backfire.
However, the data from our experiment supports the findings of the Google survey regarding encouragement in two ways. First, students who had been previously encouraged were more likely to have pursued training before the experiment. And encouragement from family was also associated with a lower reservation wage for the programming job, with marginal significance.
Table 9. Determinants of reservation wage in High Stakes experiment
Standard errors in parentheses. *p<0.1; **p<0.05; ***p<0.01
Table 10. Determinants of confidence, pooling initial and High Stakes experiments
Standard errors in parentheses. *p<0.1; **p<0.05; ***p<0.01 ‘programming’ is abbreviated as ‘prog.’
Also, consistent with the Google study, we found that personal preferences matter: students are more likely to work in tech if they think it sounds fun.
This is the first empirical evidence, to our knowledge, demonstrating that people give up money because they do not enjoy programming. The experimental design controls for many other factors such as confidence and the opportunity cost of time. Future research can explore how much of the “shortage” of tech workers is caused by this simple fact that some people do not like working with computers. Also, some people do actually enjoy working with computers. They have a lower reservation wage, and they do activities for free such as contributing to helpful online message boards.
In the policy-oriented literature on access and education, preferences are rarely mentioned. The assumption that everyone would want a high-paying tech job if they had access to training is not supported in this experiment. About one quarter of subjects said that the programming job sounded “unpleasant.”
As a test of the narrative that most people would want tech jobs if they had more exposure to computer technology, we exposed one third of subjects to an example of what they would be doing. This extra information did not raise the willingness to participate. It is possible that more information, either in a different form or with a different sample of participants, would have an effect.
The Google study found that having taken previous programming classes was the third most important factor in choosing computer science. We found no significant effect of classes on the decisions in this short-term experiment. Some students who had taken classes did not want the programming job. A high school student can be offered AP Computer Science and still not pursue a tech career. A class that is poorly taught could even deter a young person, since enjoyment matters so much.
It is a promising direction for future research to determine if there would be a gender gap or lower overall participation in a programming experiment if the task exhibited more of the negative aspects of full-time tech careers. Features that deter candidates and especially women include competition, job insecurity, and poor management by supervisors. Speer (2019) found that women are not only less likely to train for computer science jobs in college, but conditional on getting a job in computer science, women are more likely to leave the field. This suggests that the work environment and schedule causes women to quit—not a distaste for the work, which would have led to attrition earlier in college.
To investigate the claim of a tech skills shortage, Weaver (2021) conducted a broad survey of IT helpdesk managers in the US. Weaver writes, “In order to understand hiring frictions, it is important to move beyond a narrow focus on technical skill mismatch.” Weaver found that, at the level of a helpdesk technician, soft skills posed a greater problem for hiring than hard skills.23The helpdesk technician position is lower paying than a software engineer job. A bachelor’s degree is usually not required and only 15% of helpdesk positions require “programming.” A problem in hiring is that candidates with the best soft skills have a higher opportunity cost of doing tech.24Cowen (2013) observes that in the computer-augmented economy, not everyone needs to be a programmer to earn high wages. High financial rewards are available to marketers and managers if they have exceptional soft skills and productivity. Interventions aimed at building confidence with technical skills may not be very effective with this population. They need to be paid more to divert them from activities that they prefer.
Our experiment confirms that more confident people and those with a low opportunity cost of time make a favorable labor supply pool for tech companies. Tech companies benefit from more publicly funded education in the US that produces students who are more confident in their own computer skills. More H-1B visa holders means that tech companies can hire people with a lower opportunity cost compared to high-skill Americans. Tech companies can advocate for policy changes that will increase the labor supply. Currently, they face the current labor market and so they pay high wages to attract talent.25Leswing (2019) reports that a recent college graduate who is able to get a job as a software engineer at Google or Facebook makes a starting salary of over $150,000. The source of the data is a crowdsource website for Silicone Valley.
8 Conclusion
Capelli (2015) states the importance of studying this question as follows:
The topic of skill problems in the US represents something reasonably new for labor market and public policy discussions. It is difficult to think of a labor market issue where academic research or even research using standard academic techniques has played such a small role, where parties with a material interest in the outcomes have so dominated the discussion, where the quality of evidence and discussion has been so poor, and where the stakes are potentially so large.
Our experiment is designed to rigorously isolate attitudes toward the skills needed for high-paying tech jobs. Many college students are confident and willing to program, if the wage is high enough. Willingness to program can be partly explained by subjective preferences. People who do not enjoy programming have to be paid a compensating differential to spend their time doing it.
Confidence was not increased either by a randomly assigned encouraging message or by extra information. Even prior formal classes did not appear to increase confidence or willingness to participate. An important finding from this experiment is that confidence in programming is difficult to manipulate and is closely linked with liking math and enjoying programming. Our encouraging message actually decreased confidence.
This design serves as a useful starting point. Future research can examine other aspects such as a longer-term job commitment. Additional controlled studies are needed to understand selection into tech and what interventions increase confidence or enjoyment. Future research could determine what factors, aside from attitudes toward the technical work itself, deter students from a career in tech.
Appendix A
A.1 Ex post reasons for participation decisions, Initial Experiment
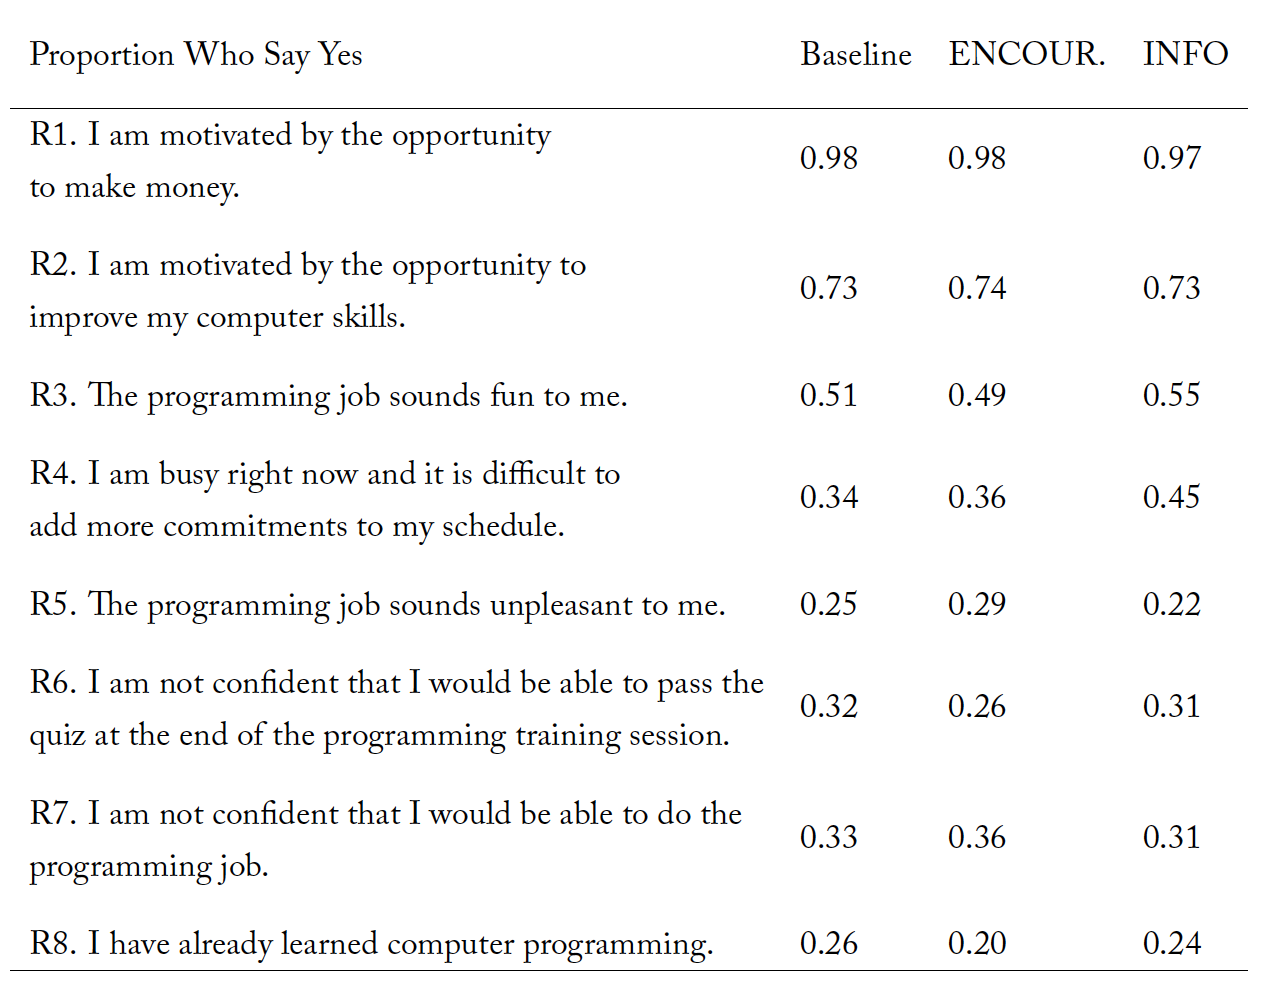
After demographic questions, subjects were asked to “Consider your reason for your decision about the one-hour task that involves computer programming.” Table A1 shows the proportion of subjects who answer “Yes” to the proposed reasons, broken down by treatment, in the initial experiment. There are no differences between the reasons given across treatments, in keeping with the fact that behavior is similar.
Table A1. Ex post reasoning for decisions, by treatment, initial experiment
The large implied labor supply from the initial survey is a result of a positive attitude toward programming and the desire to earn more money in the lab. There are no significant differences in the way that males and females select ex post explanations, if all treatments are pooled. More females report being busy and more males say that the programming job sounds fun, but the differences are not significant. Many subjects say they value the training, which may explain why people who are not confident want an invitation.
An additional significant effect of ENCOURAGE_Extra is the way it impacted self-reported confidence. Generally, male and female subjects report the same level of confidence in their own ability to pass the quiz.
Table A2. Proportion of self-reported characteristics of computer science majors in High Stakes experiment
In ENCOURAGE_Extra, males are slightly more confident and females are less confident (a chi-square test of confidence by sex yields p-value = 0.01).
Students were asked their college major in High Stakes. The sample size of declared computer science majors is only 4.
A.2 Relating self-reported variables, in the initial experiment
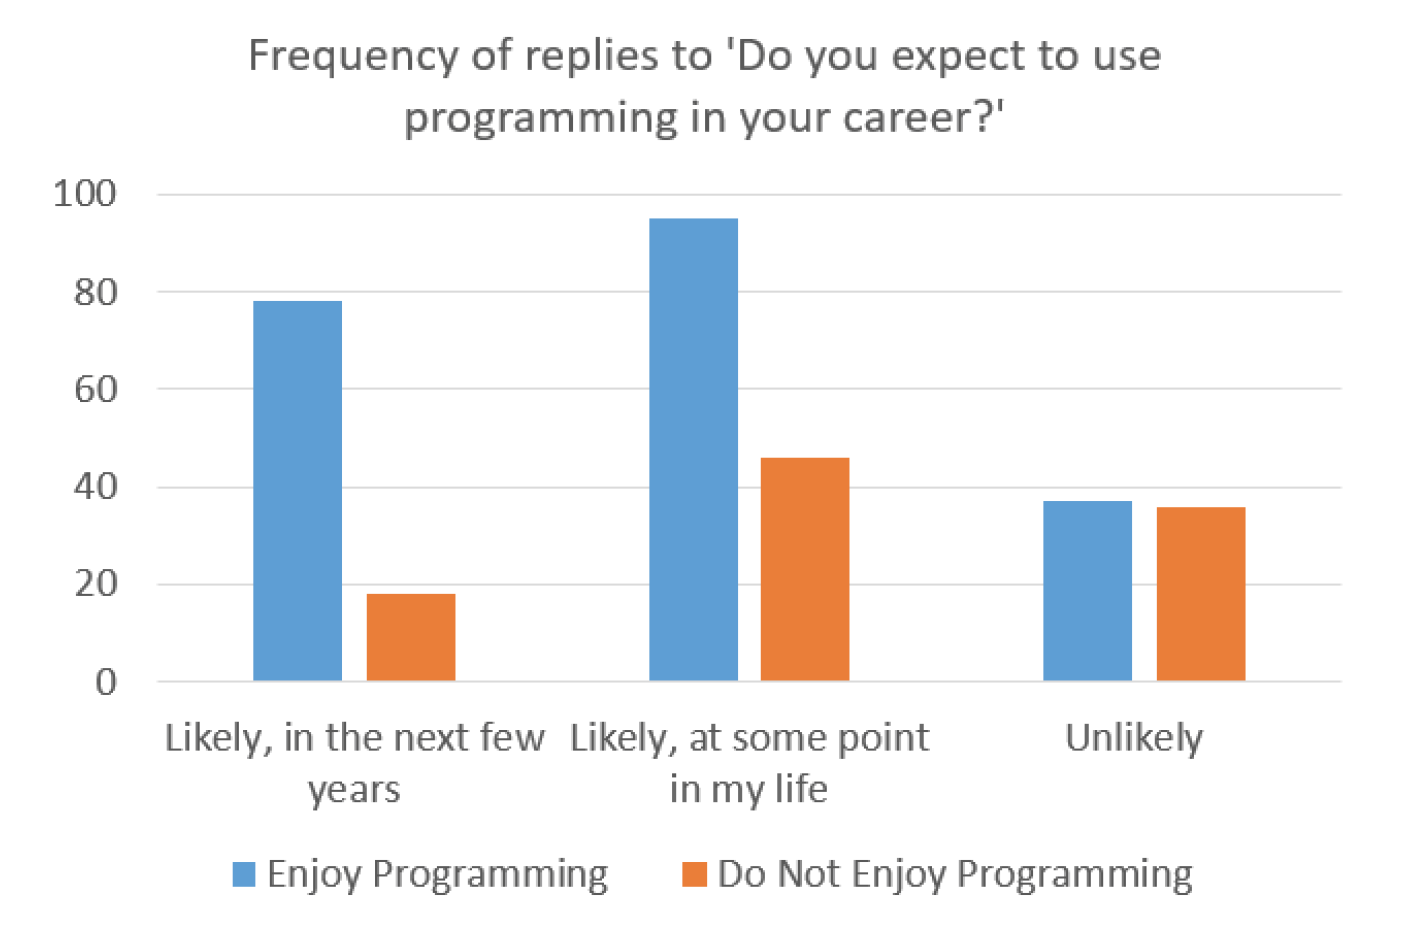
There is clear evidence that enjoyment of programming influences behavior in the experiment. Responses about future career plans indicates that this factor has validity outside of the experiment. People who enjoy programming are also much more likely to say that they envision themselves using programming in their careers, as shown in figure A1. We show results for the larger initial experiment in this section, and all of these patterns replicated in High Stakes at a different university.
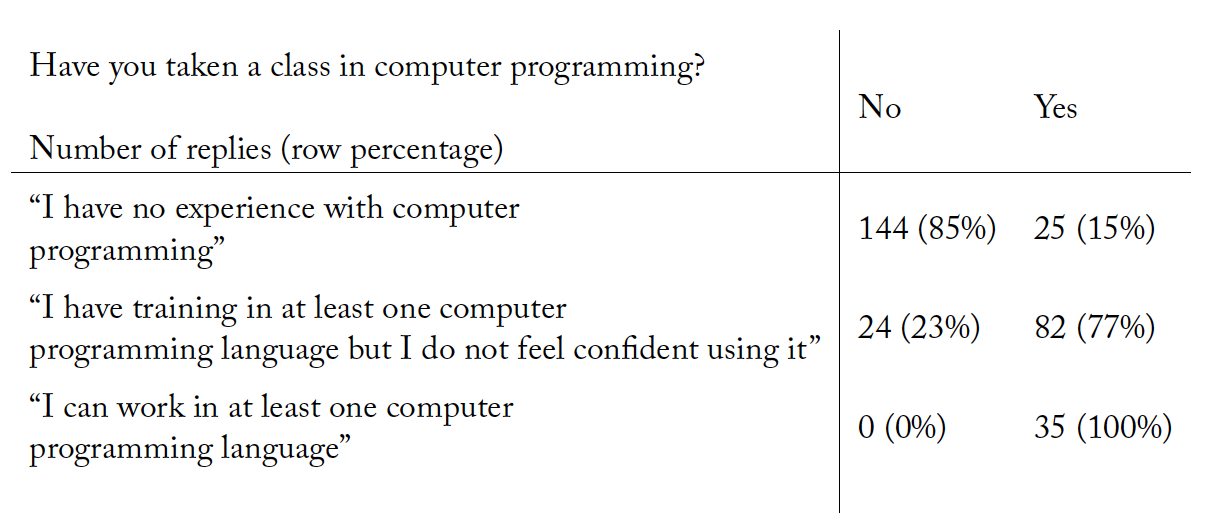
Another interesting relationship between self-reported answers is how classes affect the level of proficiency reported by subjects. Classes seem to have no effect on behavior in the experiment, but subjects who claim that they can already program have all taken at least one class in Table A3.
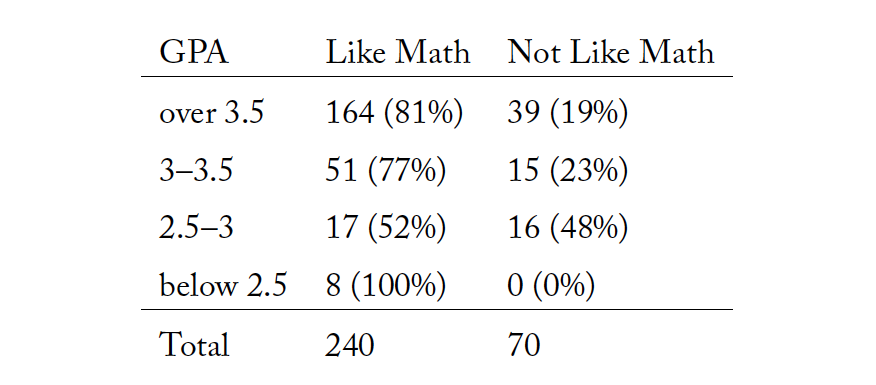
The strong relationship between liking math and confidence to pass the quiz raises a question about the direction of causality. People may like math because they have a history of positive reinforcement from good grades on tests. Table A4, shows that people who have high GPA’s tend to like math.
The increased confidence from liking math did not translate to a lower reservation wage to program. Talented people have lots of good opportunities, and this experiment has an opportunity cost.
The connection between GPA and liking math is highly significant (chi square test p-value < 0.01). However the same test for enjoying programming indicates no relationship with GPA. Some people who do poorly in school enjoy programming and some people who do well in school do not like programming.
Encouragement outside of the experiment does not appear to make subjects more confident. Those who report that they were encouraged to study computer science are more likely to have taken a class on computer programming or have attended a camp (correlation significant at 1% level, both initial and High Stakes experiments). Thus, the encouragement from family and friends translated to some action previously, even though it has no effect in this experiment.
Figure A1. Relation of enjoyment of programming with expectations for future use, initial experiment
Table A3. Classes on programming by self-reported level of expertise, initial experiment
Table A4. Relationship between liking math and college GPA
A.3 Rates of participation for invited subjects and quiz outcomes
The results rely on the assumption that asking for an invitation to program is a good proxy for willingness to follow through if invited. After the survey, subjects were randomly assigned a wage. To be eligible to return to the lab, the randomly assigned wage had to be equal to or higher than the subject’s reservation wage. A subset of eligible subjects received invitations at the email address they had provided.
In the initial experiment, the 76 subjects who were invited had many time slots over several days in which they could return to the lab. Half of the subjects who were invited returned. Some students who were invited back to the lab for counting did not show up either, even though they were guaranteed money with no risk. In the initial experiment, there were 3 days available to return to the lab and subjects were sent emails about the opportunity a few days in advance. If more time slots had been offered, it is likely that there would have been less of what seems like attrition.
Importantly, the likelihood of returning did not depend on the wage offer. Subjects who said they would return for a low wage did return for a low wage. Using a logit model to predict the likelihood of showing up to program, conditional on being invited, the level of the wage offer does not have a significant effect.
In the initial experiment, subjects who had predicted that they would get all 10 questions right on the quiz were slightly more likely to show up to train, even though they did not in fact do better on the quiz than other students.
In the High Stakes experiment, subjects were assigned a wage and then 77 eligible subjects were invited to complete the training on their own computers. Subjects who stated a low reservation wage in the survey were willing to participate in the experiment if they were assigned a low wage.
Female subjects are equally likely to show up to train, in both experiments. The equal confidence level between males and females seems well-founded. Most subjects who attempt the quiz pass it.
Appendix B
B.1 Initial Survey
This survey will take about 15 minutes to complete. After you have answered every question, you will be paid $7. Thank you for participating.
The first question is about whether you would like to return to the lab on another day to earn additional money. Here is the entire process that you need to understand to make your decision:
- Complete this Indicate at what payment levels you would like to be invited back for a one-hour computer programming task. Your decisions will not affect the actual payment level that you are assigned. You receive $7 for completing this survey today.
- You are randomly assigned a payment level for the programming task between $15 and $85.
- Some people will receive invitations to return to the lab via If you indicate that you do not want an invitation at your payment level, then you will not receive an email.
- If you received an email, return to the lab for a 1-hour training session. You will receive $5 for staying in the lab for the training session. At the end of the training, there is a short quiz on what you
- If you pass the quiz, you will receive one more invitation. Return to the lab for a 1-hour actual computer programming task. At the end of the task, you get paid the wage from $15-$85, depending on what wage you were
You will need to make your choice about whether you want to participate before you learn which payment level you will draw. Some of the people who indicate that they want to participate will receive a follow up email with an invitation. There will be multiple dates and times that those people can choose from to do the task. The one-hour session will be offered at several different times between 9am and 5pm on weekdays.
Before doing the programming task, participants come to the lab for a one-hour training session. In the training session you will learn how to write basic code in a commonly-used computer programming language. At the end there is a short quiz on what you learned in the training. You must pass the quiz to get invited to the second one-hour work session for the larger payment. The quiz will have 10 questions. You pass the quiz if you get 8 or more questions correct. These questions will ask you to apply what you learned in the training to answer questions about code. You will have access to all of the training materials while you take the quiz.
For completing the one-hour training session, you will earn $5. So, in total, someone who does the task that pays $15 will earn $20 for coming to the lab twice. A person who draws a task payment of $35 can earn $40, and the highest payment level can result in a total earnings of $90 for doing both 1-hour sessions.
Check your understanding. In a hypothetical case, assume that you have been assigned a task wage of $45 and you are invited to participate because you indicated that you wanted to be invited for $45.
If I complete the training session for $5 and the task for $45, then altogether (not including the survey today) I would earn:
- $5
- $45
- $50
There are several options for you to choose from. Please choose the option you prefer most. After this survey is over, you may receive an invitation to the training session if you indicate that you want to participate. You will not receive an invitation to the programming task if you indicate that you do not want one.
The payments here are listed for the programming task for the second one-hour session. Recall that everyone who does the task will earn an additional $5 for the training session. Your answer to this questions or any questions in this survey will not affect your payment today of $7.
Question 1. Select one option below to indicate if you would like an invitation for the computer programming task.
- I would like an invitation to do the programming task if I will be paid $15, $25, $35, $45, $55, $65, $75 or $85.
- I would like an invitation to do the programming task if I will be paid $25, $35, $45, $55, $65, $75 or $85. If I draw a $15, then I will not receive an
- I would like an invitation to do the programming task if I will be paid $35, $45, $55, $65, $75 or $85. If I draw a $15 or $25, then I will not receive an invitation.
- I would like an invitation to do the programming task if I will be paid $45, $55, $65, $75 or $85. If I draw a $15, $25 or $35, then I will not receive an
- I would like an invitation to do the programming task if I will be paid $55, $65, $75 or $85. If I draw a $15, $25, $35 or $45, then I will not receive an
- I would like an invitation to do the programming task if I will be paid $65, $75 or $85. If I draw a $15, $25, $35, $45 or $55, then I will not receive an invitation.
- I would like an invitation to do the programming task if I will be paid $75 or $85. If I draw a $15, $25, $35, $45, $55 or $65, then I will not receive an invitation.
- I would like an invitation to do the programming task if I will be paid $85. If I draw a $15, $25, $35, $45, $55, $65 or $75, then I will not receive an invitation.
- I would not like to receive an invitation for the programming
If you would like to be able to receive an invitation, provide us with your school email address so that we can send you an invitation
page break, unable to alter their choice after moving forward
The second question is similar to the first question, but the task is different. In the second question, decide whether you would like to be paid to participate in a counting task in this computer lab. The possible payment levels are the same as the programming task.
You will need to make your choice about whether you want to participate before you learn which wage you have been assigned. Some of the people who indicate that they want an invitation will receive a follow up email and several dates they can choose from to do the task.
Before you can do the counting task, you will come to the lab to do another one-hour counting task for $5. There is no quiz.
The counting task screen will look somewhat like this:
the table appeared here in the instructions
The counting task is to count the number of zeros in the table and enter the number into the computer. You can go as slowly or as quickly as you like. After you have counted and entered your answer, another counting screen will appear.
The total compensation includes a $5 payment for showing up for the first hour. Thus, if you are invited to do the task for $35, you will earn $40, total including the training hour.
Question 2. Select one option to indicate if you would like an invitation for the counting task.
choices for counting represented just as they were for programming page break, unable to alter their choice after moving forward
The next question is about the quiz at the end of the one-hour training session. There are 10 questions on that training quiz. Everyone who completes the training will earn $5 for participating.
We will also compare you prediction in the next question to the number of quiz problems that you answer correctly, during the training session. If your prediction today matches the actual number of correct answers on your quiz, then you will earn an extra $1, meaning you would get paid $6 instead of $5.
Question 3. If you do the one-hour programming training session and take the quiz, how many questions do you think you will get right on the 10-question quiz?
- 10 correct answers
- 9 correct answers
- 8 correct answers
- …
page break, unable to alter their choice after moving forward
Question 4. For the following question, consider your parents’ careers. Does either your father or mother (or both) have an occupation that involves computer programming? [Yes/No]
Question 5. Please state your sex
- Male
- Female
Question 6. Please state your age Free response, integers only
Question 7. What is your experience level with computer programming?
- I can work in at least one computer programming language
- I have training in at least one computer programming language but I do not feel confident using it
- I have no experience with computer programming
Question 8. In school, have you had a class that taught computer programming? [Yes/No]
Question 9. Outside of school, have you had opportunities to learn programming, such as a club or camp or online course? [Yes/No]
Question 10. Do you enjoy working with computers? [Yes/No]
Question 11. Do you feel confident working with computers? [Yes/No]
Question 12. Has someone encouraged you to study computer science or computer programming? [Yes/No]
Question 13. Which option describes your high school experience?
- I went to a public high school in the S.
- I went to a private high school in the S.
- Other
Question 14. What is your college GPA?
- over 5
- 3 – 5
- 5 – 3
- Below 5
Question 15. Are you a student in the business school? [Yes/No] Question 16. Do you like math? [Yes/No]
Question 17. Do you expect that you will use computer programming in your career?
- Likely, in the next few years
- Likely, at some point in my life
- Unlikely
Question 18. Which of the following best describes you?
- I believe that I can have a successful career that involves computer programming if I want
- I do not believe that I can have a successful career that involves computer
Question 19. Which of the following best describes you?
- I enjoy computer programming
- I do not enjoy computer programming
- I have no experience with computer programming, but I believe I would enjoy
- I have no experience with computer programming, but I believe I would not enjoy
Question 20. If you were to take a job in a tech field, do you expect that you would face discrimination or harassment? [Yes/No]
Question 21. Did you take Calculus in high school?
- Yes
- No
- Calculus was not offered at my high school
Question 22. Have you taken a class on statistics or data analysis in college? [Yes/No]
Question 23. Do you expect that you will start or direct a tech company?
Question 24. Do you expect that you will start or direct a company in any industry?
Question 25. Are you a college athlete? [Yes/No]
Question 26. Do you like puzzles and problem-solving? [Yes/No]
Question 27. Did you take AP Computer Science in high school?
- Yes
- No, but it was offered at my high school
- It was not offered at my high school
Question 29. Please indicate your race:
White, Black, American Indian or Alaska Native, Hispanic, Asian, Other
Consider your reason for your decision about the one-hour task that involves computer programming. Please answer the following questions in reference to your decision about the programming task that you could be invited back to do.
R1. I am motivated by the opportunity to make money. [Yes/No]
R2. I am motivated by the opportunity to improve my computer skills. [Yes/No] R3. The programming job sounds fun to me. [Yes/No]
R4. I am busy right now and it is difficult to add more commitments to my schedule. [Yes/No] R5. The programming job sounds unpleasant to me. [Yes/No]
R6. I am not confident that I would be able to pass the quiz at the end of the programming training session. [Yes/No]
R7. I am not confident that I would be able to do the programming job. [Yes/No] R8. I have already learned computer programming. [Yes/No]
Question 31. Answer this question. Suppose that x=a/b, or x equals a divided by b. Then if x=4 and b=2, solve for a.
[1/2, 2, 4, 8, 16]
B.2 Sample of Questions from the Quiz after the Training Session
In the following quiz, choose what R output you would expect from running the code in the question.
Q1. 3 + 10
- 3+10
- 3
- 10
- 13
Q2. beta <- “Hello” class(beta)
- numeric
- character
- logical
Q3. vect <- c(1, 1, 3, 3)
mean(vect)
- 1
- 2
- 3
B.3 Wording Used in Email Invitation to Return for the Programming Task, with Variable Wage Inserted
Dear participant,
You are receiving this invitation because you indicated in a recent survey that you would like to be invited back to the TIDE lab for a programming task. You will earn $5 for attending a one-hour training session, with a short quiz at the end. If you return again for a second one-hour programming session, you will be paid $.
Please register for your training session by selecting one of the available times:
References
Abeler J, Falk A, Goette L, Huffman D (2011) Reference points and effort provision. American Economic Review 101(2):470–492.
Apicella CL, Demiral EE, Mollerstrom J (2020) Compete with others? No, thanks. With myself? Yes, please! Economics Letters 187:108878, DOI 10.1016/j.econlet.2019.108878, URL http://www.sciencedirect.com/science/article/pii/S0165176519304434.
Ariely D, Gneezy U, Loewenstein G, Mazar N (2009) Large stakes and big mistakes. Review of Economic Studies 76(2):451–469, DOI 10.1111/j.1467-937X.2009.00534.x, URL https://academic.oup.com/restud/article-lookup/doi/10.1111/j.1467-937X.2009.00534.x.
Bartling B, Engl F, Weber RA (2015) Game form misconceptions are not necessary for a willingness-to-pay vs. willingness-to-accept gap. Journal of the Economic Science Association 1(1):72–85, DOI 10.1007/s40881-015-0008-0, URL https://doi.org/10.1007/s40881-015-0008-0.
Borjas GJ (1987) Self-selection and the earnings of immigrants. American Economic Review 77(4):531–553, URL https://www.jstor.org/stable/1814529.
Borjas GJ, Kauppinen I, Poutvaara P (2018) Self-selection of emigrants: Theory and evidence on stochastic dominance in observable and unobservable characteristics. Economic Journal 129(617):143–171.
Buchanan JA, Wilson BJ (2014) An experiment on protecting intellectual property. Experimental Economics 17(4):691–716, DOI 10.1007/s10683-013-9390-8, URL http://link.springer.com/article/10.1007/s10683-013-9390-8.
Buchanan JA, Kronk H, Leatham N (2020) The slow adjustment of the American technology labor force URL https://papers.ssrn.com/sol3/papers.cfm?abstract_id=3470417.
Buhnova B, Prikrylova D (2019) Women want to learn tech: Lessons from the Czechitas education project. pp 25–28, DOI 10.1109/GE.2019.00013.
Cappelli PH (2015) Skill gaps, skill shortages, and skill mismatches: Evidence and arguments for the United States. ILR Review 68(2):251–290, DOI 10.1177/0019793914564961, URL https://doi.org/10.1177/0019793914564961.
Cason TN, Plott CR (2014) Misconceptions and game form recognition: Challenges to theories of revealed preference and framing. Journal of Political Economy 122(6):1235–1270.
Charness G, Grieco D (2019) Creativity and incentives. Journal of the European Economic Association 17(2):454–496, DOI 10.1093/jeea/jvx055, URL https://academic.oup.com/jeea/article/17/2/454/4931135.
Charness G, Kuhn P (2011) Lab labor: What can labor economists learn from the lab? In: Handbook of Labor Economics, vol 4, Elsevier, pp 229–330.
Chipidza W, Green G, Riemenschneider C (2019) Choosing technology majors: What you don’t know can influence you. Journal of Computer Information Systems 59:1–14, DOI 10.1080/08874417.2016.1230726, URL https://doi.org/10.1080/08874417.2016.1230726.
Civil (2014) Civil rights data collection data snapshot: College and career readiness. Tech. Rep. Issue Brief No. 3, U.S. Department of Education Office for Civil Rights, URL https://www2.ed.gov/about/offices/list/ocr/docs/crdc-college-and-career-readiness-snapshot.pdf.
Corgnet B, Hernán-González R, Schniter E (2015) Why real leisure really matters: Incentive effects on real effort in the laboratory. Experimental Economics 18(2):284–301.
Cowen T (2013) Average is over: Powering America beyond the age of the great stagnation. Penguin Del Carpio L, Guadalupe M (2018) More women in tech? evidence from a field experiment addressing social identity.
Deming DJ, Noray KL (2018) STEM careers and technological change. Working Paper 25065, National Bureau of Economic Research, DOI 10.3386/w25065, URL http://www.nber.org/papers/w25065.
Dustan A, Koutout K, Leo G (2019) Beliefs about beliefs about gender. Working Paper.
Fehr E, Klein A, Schmidt KM (2007) Fairness and contract design. Econometrica 75(1):121–154 Flory JA, Leibbrandt A, List JA (2014) Do competitive workplaces deter female workers? A large-scale natural field experiment on job entry decisions. Review of Economic Studies 82(1):122–155 Google (2014) Women who choose computer science—What really matters. Tech. rep., URL https://static.googleusercontent.com/media/edu.google.com/en//pdfs/women-who-choose-what-really.pdf.
Hao W, Abeles F (1981) Popular lectures on mathematical logic. Physics Today 34:82.
Leswing K (2019) Here’s how big tech companies like Google and Facebook set salaries for software engineers. URL https://www.cnbc.com/2019/06/14/how-much-google-facebook-other-tech-giants-pay-software-engineers.html.
Levy DM, Padgitt K, Peart SJ, Houser D, Xiao E (2011) Leadership, cheap talk and really cheap talk. Journal of Economic Behavior & Organization 77(1):40–52.
Niederle M, Vesterlund L (2007) Do women shy away from competition? Do men compete too much? Quarterly Journal of Economics 122(3):1067–1101.
Olson S, Riordan DG (2012) Engage to excel: Producing one million additional college graduates with degrees in science, technology, engineering, and mathematics. report to the president. Tech. rep.
Restuccia D, Taska B, Bittle S (2018) Different skills, different gaps: Measuring and closing the skills gap. Tech. rep., Burning Glass Technologies.
Roy AD (1951) Some thoughts on the distribution of earnings. Oxford Economic Papers 3(2):135–146.
Saifuddin SM, Dyke L, Rasouli M (2019) Applying a gender lens to the predictors of high-tech career intentions among engineering students in Bangladesh. International Journal of Gender, Science and Technology 11(2):258–285, URL http://genderandset.open.ac.uk/index.php/genderandset/article/view/569, number: 2.
Samek A (2019) Gender differences in job entry decisions: A university-wide field experiment. Management Science.
Sax LJ, Lehman KJ, Jacobs JA, Kanny MA, Lim G, Monje-Paulson L, Zimmerman HB (2017) Anatomy of an enduring gender gap: The evolution of women’s participation in computer science. Journal of Higher Education 88(2):258–293.
Singer N (2019) The hard part of computer science? Getting into class. New York Times URL https://www.nytimes.com/2019/01/24/technology/computer-science-courses-college.html.
Speer J (2019) Bye bye Ms. American Sci: Women and the leaky STEM pipeline. Working Paper Stoet G, Geary DC (2018) The gender-equality paradox in science, technology, engineering, and mathematics education. Psychological Science 29(4):581–593, DOI 10.1177/0956797617741719, URL http://journals.sagepub.com/doi/10.1177/0956797617741719.
Weaver A (2021) Who has trouble hiring? Evidence from a national IT survey. ILR.


 Politico