


Introduction
The share of the federal budget spent on research is lower than it has been in over four decades (Hourihan and Parkes, 2019). Given this funding slowdown, policymakers and university administrators are increasingly interested in commercializing the basic research coming out of universities. From the university perspective, commercialization, whether through licensing to large corporations or building new startups with the potential for growth, is seen as a potential route to recouping the costs of funding research and protecting intellectual property (IP) related to basic-research findings. From policymakers’ perspective, interest in tangible results from federally funded research has increased as budgets available to support basic research have decreased. Policymakers are increasingly asking where and how a dollar of federal research funding can be most effective in generating new commercial products.
However, the frequency, extent, and quality of commercialization varies significantly across universities. In this paper, we examine how the commercialization of university findings depends on features of the local ecosystem beyond the research itself. In particular, we ask how and to what extent commercialization of university-based research and IP stems from the university’s campus setting. In other words, does being in a city increase commercialization? Is proximity to local markets, including private equity, critical to the commercialization production function? Do these markets serve to enhance the commercialization of research findings and technology transfer out of the university and into the economy at large, or is commercialization agnostic to the location where the research is produced?
To answer these questions, we utilize data from the Association of University Technology Managers (AUTM), which provides an unbalanced panel over time with detailed data on university disclosures, patenting, licensing, spinouts, and revenues. The AUTM database hosts a wealth of information, including data on startups, funding, staff size, legal fees, patent applications filed, and royalties earned.
In this paper, we relate these measures of commercialization to features of the local economy, including cityhood, by merging the AUTM database with population information on student and faculty size as well as city and county population and other demographic variables related to features of the city or region in which the university sits. These variables include industry mix and clustering, firm-size distribution, availability of entrepreneurial finance, and other entrepreneurial infrastructure. In doing so, we describe the heterogeneity of commercialization outcomes by a variety of parameters of policy interest. We find that being in a city significantly and substantially increases commercialization outcomes by a variety of metrics. This finding is robust to a wide variety of specifications.
To assess whether market proximity has a real effect on commercialization, we must first disentangle the complication that cities and the universities located in them have undoubtedly influenced each other and evolved together. Features of a university, such as a large medical center, might affect the development of the city and the choice of industries within it. Thus, a city in which a university with a large medical school is located likely has different industries and features from a city in which a similar-quality university with no medical school is located. To that end, we address the potential endogeneity inherent in our research question in three main ways.
First, we control for potential confounds using several county-level covariates that potentially influence commercialization. These covariates include GDP per capita, local educational attainment, and industry cluster strength (described in section 4). While it is true that universities in wealthier counties have stronger patterns of commercialization, city status remains an important factor even after controlling for these conditions.
Second and similarly, we repeat this approach with university-level covariates. Importantly, these covariates control for both contemporary university characteristics, such as whether there is a medical school, and characteristics related to the university’s founding, such as a land-grant indicator. This strategy further speaks to the idea that universities and their locales evolve together. Notably, the concept of land-grant institutions originated during the Industrial Revolution, when engineering was emerging as an academic field. The original mission of land-grant institutions was to teach agriculture, mechanical arts, and military tactics—departments we might think of as more closely associated with contemporary patenting, R&D, and licensing (relative to the arts and humanities). Most land-grant colleges became large public universities, which tended to be located in rural settings rather than downtown campuses. Additionally, we combine both county- and university-level covariates in a “kitchen-sink” approach and obtain similar results.
Finally, we examine specifically how the local market for entrepreneurial finance impacts commercialization by evaluating the supply and presence of venture capital within a city using a standard approach in the literature: whether local funds had recently closed when the NASDAQ crashed in 2000 (Hochberg, Serrano and Ziedonis, 2018). Since venture capitalists (VCs) have heterogeneous fundraising cycles, the extent to which local funds were cash constrained following the crash is essentially random. By exploring the commercialization of university IP when investors are otherwise and coincidentally cash constrained, we can comment on the mechanisms through which cityhood impacts commercialization.
We find that city-based universities experience more commercialization of their research and IP, even after controlling for local and university-specific factors. Further, from our difference-in-differences estimates, we posit that an important mechanism behind this increased commercialization is access to new deal flow. This finding is important because one pattern that continues to emerge from the data is the uneven nature of university commercialization, with a small number of “superstar” universities comprising a great deal of the commercial activity.
Moreover, given that much university placement can be viewed as “historical accident,” we are able to provide convincing estimates on the extent of this commercialization, using our three preferred outcome variables: licenses and options executed, gross licensing income, and new startups initiated.1To ease exposition, we interchangeably refer to university-initiated startups and spinoffs. Our most conservative estimate suggests that being in a city is not only statistically significant, but economically significant as well, netting the university an additional $2.6 million annually in licensing revenue. We discuss this economic impact further in section 7.
University inventions are an important way of transmitting knowledge into the economy (Jaffe, 1989) and understanding the different mechanisms by which transmission occurs is important to understanding technology creation and economic growth. Understanding how regional factors affect the ability to commercialize has the potential to inform interventions aimed at increasing commercialization of basic-research findings. Henderson, Jaffe and Trajtenberg (1998) note a dramatic increase (15x) in university patenting in the years 1965–92. Yet the extent to which this shift in patenting strategy has led to increased commercialization remains an open question. Our study hopes to bring new insights in this space that explore the trade-off inherent in the commercialization of university properties. In doing so, we further comment on the extent of agglomeration benefits to universities.2While not a complete welfare analysis, in this sense our paper is complementary to Boldrin and Levine (2002), which argues the potential downsides of intellectual property rights.
To that end, our study is not limited to the mere impact of cityhood. Instead, we view it through the lens of Krugman (1998), who reviews the modeling approach of “the new economic geography.” Krugman notes that a “large local market creates both ‘backward linkages’—sites with good access to large markets are preferred locations for the production of goods subject to economies of scale—and ‘forward linkages’—a large local market supports the local production of intermediate goods, lowering costs for downstream producers.” Here, we suggest that the combination of research university and local markets key to the production of commercialization is critical to developing basic-research findings and university IP into salable goods and, in turn, economic welfare. Krugman further notes how “historical accident” can shape economic geography—such as the placement of research universities, often through the land-grant process. Accordingly, this work has implications not only for theory, but also urban policy and its role in higher education.
This paper proceeds as follows: Sections 2 and 3 present a literature review and institutional context, section 4 describes the data, sections 5 and 6 present methods and results, section 7 discusses the policy implications, and a final section concludes.
Literature Review
Developing new knowledge brings to bear questions of industry mix, agglomeration, and the contention between localization and urbanization economies of scale. Localization economies are external to the firm but internal to its industry, while urbanization economies are external to the firm and industry but internal to the city (Lee and Hwang, 2014). While the agglomeration literature is vast, the implications for the knowledge economy are not so straightforward, having not only theoretical importance, but also the ability to speak to urban policy directly. For example, Hollar (2006) notes that “findings of substantial localization economies suggest that policies which raise industrial diversity increase congestion costs without increasing productivity, thereby limiting growth.”
Early work on agglomeration found localization to be much more significant in “heavy” industries, such as steel and iron production (Nakamura, 1985). Henderson (1986) also finds general evidence of localization economies in heavy industry, but notes the limitations of these scale effects and posits that specialization will exist primarily in small to medium-sized economies.
This limitation presents an opportunity for significant urbanization economies to exist, particularly with regard to university-based IP, which is typically situated in younger industries. Accordingly, the supporting evidence for these economies is necessarily more dynamic. Henderson et al. (1995) find that specialization does not encourage positive growth with technology industries. Duranton and Puga (2001) generalize this result, stating that new industries form in diverse cities, but move to specialized cities after they mature. This finding is consistent with the high industrial diversity found in Silicon Valley, which is also a close home to many top universities and research labs and exhibits significant technology transfer.
But how do these agglomeration results drive the knowledge economy generally, and specifically how do they spur knowledge being commercialized out of universities? Broadly speaking, we know universities are economically important (Valero and Van Reenen, 2019, inter alia). Universities foment innovation and increases in human capital, and regions with universities are likely to experience increased economic growth. However, there are heterogeneous effects which bear further exploration. Put differently, while universities produce knowledge, there is an inherent trade-off in how this production (and subsequent commercialization of the product) agglomerates. On the one hand, universities often require large open spaces to build labs and industrial parks and to advance science more generally. On the other hand, universities require access to local factor markets to commercialize the knowledge they produce. This trade-off is further complicated by recent advances in web services that make both cloud computing and telecommuting cheaper and more accessible.
With an eye toward this trade-off, Rafferty (2008) examines university R&D in relation to the Bayh-Dole Act of 1980. The Bayh-Dole Act allows for the results of federally funded work to be patented. Since its passage, university commercialization and technology transfer have become more prominent, not only in the public eye, but also in the eyes of university administrations, as universities have increasingly sought out patenting and other commercial ends as ultimate results of their research output. Rafferty notes that although at first blush the act may seem to incentivize universities to alter research activities from basic to applied research, any changes to research input ultimately took place before the act’s passage, suggesting the act followed the zeitgeist and not the other way around. Thursby and Thursby (2002) support this result by noting the growth in licensing is driven not uniquely by administrator behavior, but rather by a complex interplay of administration, faculty, and staff.
Regardless, commercialization of university IP remains important for at least four reasons. First, to reiterate: university inventions are an important source of knowledge spillovers (Jaffe, 1989), and understanding the different mechanisms by which knowledge from different universities spills over is important to understanding technology creation and economic growth. Next, technology-transferred startups tend to locate nearby the institutions that spawn them, underscoring their importance for agglomeration benefits and local economic development (Zucker et al., 1998). To that end, technology-transferred startups also generate significant wealth through initial public offerings, and university inventors and provosts are interested in capturing this wealth (Di Gregorio and Shane, 2003).
Simply put, commercialization and technology transfer are important because (among other reasons) they spur private sector growth. However, the geographic factors that influence such growth are largely underexplored. Whereas other scholars have focused on the unique aspects of the university, we instead choose to focus on the features of the local economy and more broadly, placement therein. This is important to the extent that placement of a university is likely the result of historical accident. To the extent that university development and local economies are closely tied together, the question of where to put support dollars and other programmatic interventions is important to local policymakers.
Institutional Context
To better understand these questions, however, we must first understand the context in which university commercialization takes place and how it works. The University of Texas Office of Technology Commercialization (OTC) describes the process in eight steps, but perhaps even more broadly, we can think of two subsequent processes: the development of research-based IP and bringing this IP to market.3Those eight steps are: Research, Disclosure, Assessment, Patenting, Prospecting, Negotiation, Licensing, Revenue and Commercialization (OTC, 2016)
Research in university labs and offices can (and often does) lead to discoveries with potential commercial applications. To develop these applications, a lab or scientist must first reveal their discovery in a confidential invention disclosure form (the number of disclosures is reported to AUTM at year’s end, as discussed further in section 4). After disclosure, Offices of Technology Transfer evaluate the potential of these inventions and discoveries and attempt to patent and further commercialize the viable ones.
Meanwhile, to bring inventions and discoveries to market, Offices of Technology Transfer identify possible companies, entrepreneurs, and investors as potential partners in commercialization. Licensing agreements are negotiated with the interested parties. Importantly, these agreements delineate the level of involvement from both the university and respective inventors moving forward. As a final step, the IP is commercialized, including (but not necessarily limited to) terms of distribution, compensation, royalties, and equity. Colyvas et al. (2002) present compelling case studies of the technology-transfer process across a variety of industries.
Competing models of this process of university commercialization motivate our question on the role and relative importance of collocating within a city. Some view the process more as a formal progression from idea generation to patenting to rights transfer, while others view it more as an informal sequence of networking arrangements (Harmon et al., 1997). The former model, described by Parker and Zilberman (1993) as “unshielded innovation,” emphasizes the foundational role of basic research. Thus, to spur commercialization, this model would seem to support policy interventions such as increased lab space and place less emphasis the role of the city, where lab space is expensive. Indeed, evidence exists for knowledge spillovers across universities, stressing the role for dispersion. Meanwhile there is little support for early entrants having improved patenting outcomes (Mowery, Sampat, and Ziedonis, 2002). The latter model of networking is less about the basic research and instead underscores long-term relationships. Similar networking models (e.g., Arzaghi and Henderson, 2008) note the strong agglomeration benefits to productivity and thus underscore the importance of cityhood.
However, evidence on the benefits of agglomeration for university-based IP is inconclusive. On the one hand, science parks and incubators seem to have underperformed in terms of producing innovation in recent years (Phan et al., 2005; Lerner 2012). On the other hand, while university interactions with science parks may be more limited than it might seem, university-affiliated technology firms seem to have growth and employment advantages relative to other developing firms (Lindelöff and Löfsten, 2004). Regardless, the interactions are complex and further research is required, and while there is some evidence that cities support innovation (broadly defined), and more specifically that industrial diversity supports innovation (Feldman and Audretsch, 1999), the impact of city-based colleges and universities (relative to their suburban and rural counterparts) remains underexplored.
Data
Since the early 1990s, university commercialization has been increasing, including (but not limited to) the number of startups established (figure 1A) and the number of patents applied for (figure 1B).
Figure 1. Growth in University Commercialization (1995-2014)
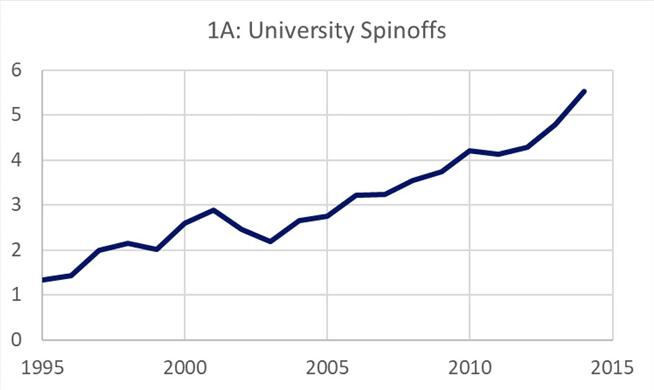
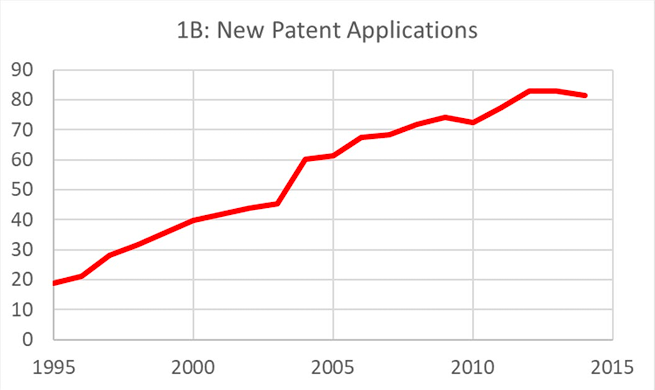
Note: These figures plot commercialization over time averaged across all Association of University Technology Managers respondent surveys. The data come from the Association of University Technology Managers. Each observation corresponds to the mean commercialization from a particular year. The outcome variable in panel A is university spinoffs, or companies that were dependent upon licensing the institution’s technology for initiation, evaluated at 1.33 in 1995 and 5.53 in 2014. The outcome variable in panel B is new patents applied for and represents the first filing of the patentable subject matter in a given year, evaluated at 18.83 in 1995 and in 81.40 in 2014.
To explore these changes in the commercialization landscape, we utilize a panel data set from the AUTM Statistics Access for Technology Transfer Database. The database tracks university and research-institute licensing activity and income. In addition, the database has information on founded startups, research funding, staff size, legal fees, patent applications filed, and royalties earned. Our data cover 1991–2014 and comprise AUTM surveys from 335 universities.4We note that these universities comprise those actively involved in research commercialization and with an active technology-transfer manager on staff. This sample is likely different from the universe of institutes of higher education overall. We discuss this important distinction further in our section 5, and we thank an anonymous referee for pointing this out.
While the data are strongly unbalanced as not every institution responds in every survey year, we view this as a feature, not a bug, as it provides an interesting comment on the variable nature of university patenting, licensing, and startup behavior. We merge these data with population information on student and faculty size as well as city and county population and demographic variables. The average university in our sample has 930 members on its research faculty and over 15,000 students. Of the universities in our sample, 74 percent reside in cities, as defined by the Integrated Postsecondary Education Data System (IPEDS) as university territory inside both an urbanized area and principal city as outlined by the US Census Bureau. We further explore cities based on their size (large and medium). Summary statistics on the universities in our sample are presented in table 1.
Table 1. Summary Statistics: Universities and Commercialization
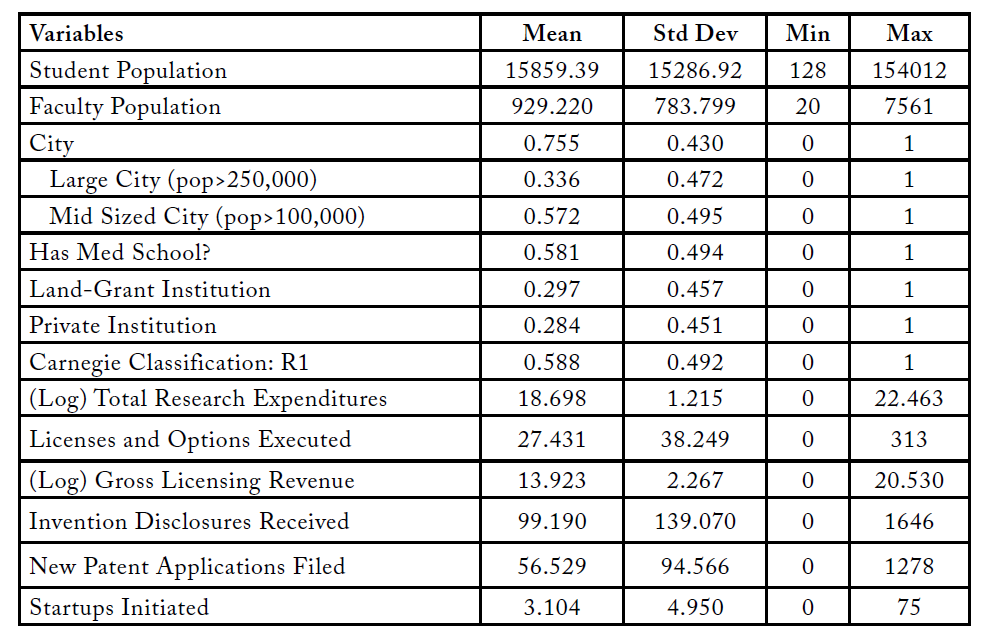
Included in these summary statistics are our measures of commercialization that bear further discussion.
The measure total research expenditures is defined as the expenditures made by the institution in support of its research activities. This total includes expenditures funded by the federal government, local government, industry, foundations, voluntary health organizations (such as the American Heart Association and the American Cancer Society), and other nonprofit organizations. The average university has a (log) total expenditure of 18.7 or about $132 million.
The measure total licenses executed is the number of license or option agreements implemented in a given year for all university technologies. Each agreement, whether exclusive or non-exclusive or with or without equity, is counted separately. The average university in our sample executed 27.43 licenses. That number is highly skewed with 25 percent of the sample issuing four or fewer licenses, while the top percentile issued 196 or more.
Gross licensing income is the licensing income received, including issue fees, payments under options, annual minimums, and running royalties less the licensing income paid to other institutions to avoid double-counting. The average university has a (log) gross income of 13.92 or about $1.1 million.
The measure invention disclosures includes the number of disclosures, no matter how comprehensive, that are made in a given year and are counted by the university. According to the University of Texas OTC:
An invention disclosure is a confidential description of an invention submitted by the inventors to OTC to initiate the commercialization process. The invention disclosure addresses technical aspects of the technology, such as the science behind the invention, its advantages over prior art, its potential drawbacks, and its scope of use. In addition, the invention disclosure addresses legal matters (such as IP ownership and encumbrances). By submitting a disclosure, the inventor enables OTC to offer assistance and support throughout the commercialization process if the university asserts its interest in the technology. (OTC, 2016)
Importantly, while invention disclosures are a key first step in commercialization, they do not provide IP protection in and of themselves. To that end, we track patents applied for in a given year.5Given the considerable lag time in issuing patents (around 25 months, USPTO), we eschew using patents granted as either an independent or outcome variable. However, one can reasonably assume patents granted is highly collinear with patents applied for.
Finally, startups formed tracks companies that were dependent upon licensing the institution’s technology for initiation. On average, a university in our sample will form 3.1 startups annually, with the majority forming two or fewer, and the top percentile forming 21 or more.
These commercialization variables each tell their own story, but understandably, are also highly correlated with one another. To that end, in our regression framework, we focus on three main measures of commercialization as outcome variables: licensing, revenue, and startups initiated. Not only do these three outcomes in particular help to span the extent of the technology-transfer process, but also any potential differences among these outcomes help us to distinguish the agglomeration economies at play.
We merge these data with county-level data exploring a university county’s population and demography, including data on industry concentration and “cluster strength” from the Cluster Mapping Project. The Cluster Mapping Project defines clusters as geographic concentrations of related industries and defines cluster strength as specialization in “an array of related industries . . . conceptually similar to the notion of related variety” (Delgado, Porter, Stern, 2016). Broadly speaking we treat cluster strength as a county-level effect that soaks up industrial variance. The average university county has a cluster strength of 0.5. By means of example, the average university county is similar in cluster strength to Douglas County, Kansas, where the University of Kansas sits. Its strongest industry by employment is business services and has six clusters in the top 300 US counties. As a comparison, one of the weakest university-county clusters in our sample is University of North Texas in Denton County, Texas (average cluster strength=0.27), and one of the strongest is the Catholic University of America in the District of Columbia (average cluster strength=0.82).
The average university county in our data has a population of about 940,000 with a per capita GDP of $58,215 and an $19.07 average hourly wage. University counties have an average high school diploma rate of 87 percent, an average bachelor’s-degree rate of 35 percent, and $17,930 active VC assets under management. Further university-county summary statistics can be found in table 2.
Table 2. Summary Statistics: University Counties
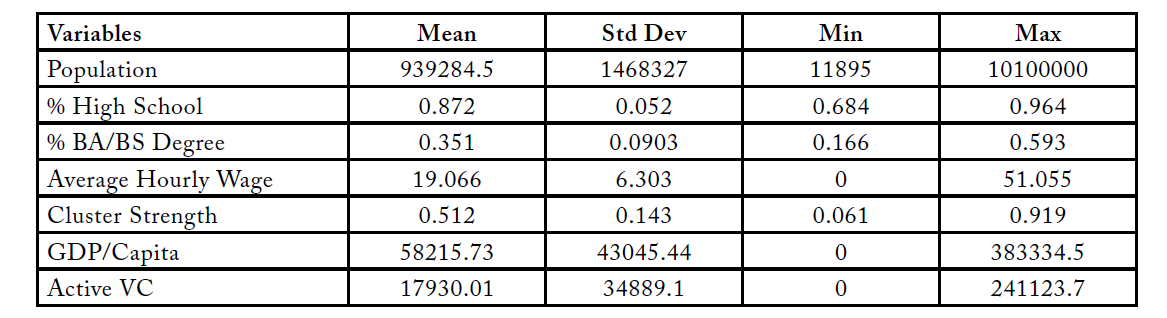
Note: VC=venture capitalists
Methods and Results
In table 3, we begin by assessing basic patterns in the data and how various characteristics relate to our three commercialization-outcome variables: licensing, spinoffs, and licensing dollars. Specifically, for each explanatory variable, we divide our subject universities along median splits and compare commercialization above and below each split. Table 3 compares commercialization for universities lying above that split (high) to universities lying below that split (low). For example, the median university in our data sits in a county that has a per capita GDP of $51,471. Universities that sit in counties above that median spawn (on average) 2.49 additional companies a year. Panel A of table 3 examines splits for county-level variables: cluster strength, per capita GDP, and average wages in the county. Across all three variables, universities lying above the split are significantly more likely to have increased commercialization in licensing, spinoffs, and licensing dollars (t-tests). That is, universities in wealthier counties with interrelated industrial structures have stronger patterns of commercialization, providing initial support for the hypothesis that cities matter.
Table 3. Basic Patterns in the Data
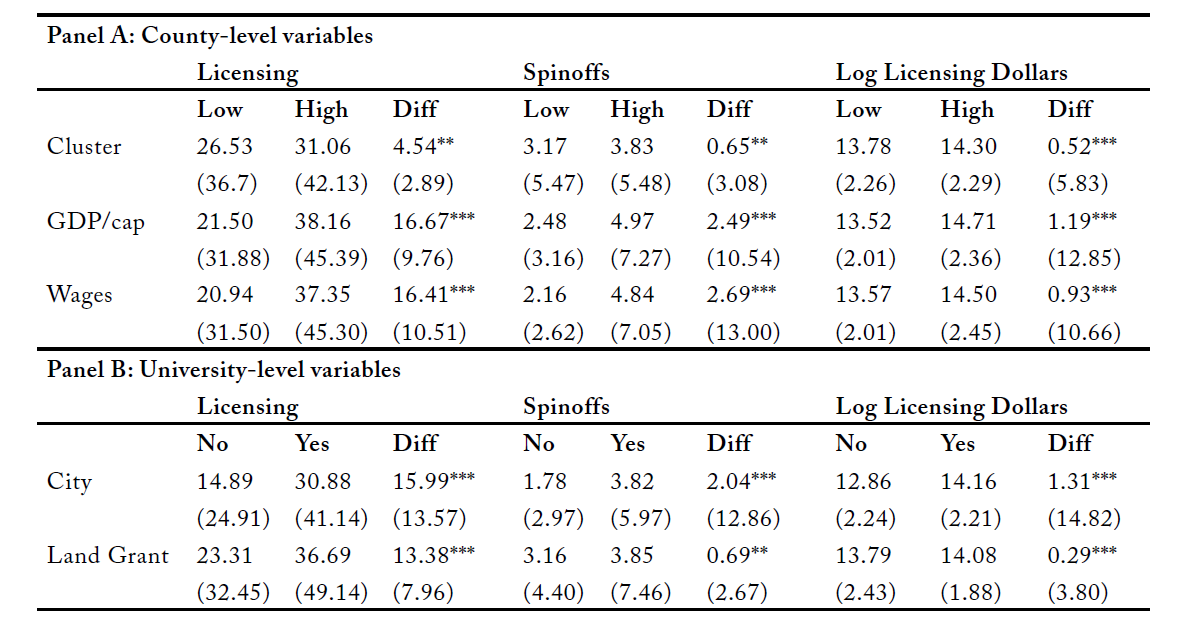
Note: This table represents average differences in commercialization for universities above and below the median for selected covariates. The data come from the Association of University Technology Managers. Differences are assessed using t-tests from high to low or from yes to no, respectively. *** p<0.01, ** p<0.05, * p<0.1
Similarly, panel B of table 3 examines university-level variables: whether the university has an urban campus, and whether the university is a land-grant institution. Importantly, these are binary explanatory variables, so we just examine yes/no rather than median splits. Again, both urban universities and land-grant universities (which house many research labs and offices) are significantly more likely to have increased commercialization across all three outcome measures.
While neither pattern in panel B may be surprising, put together, we are presented with an interesting trade-off since cityhood and land-grant status are negatively correlated. Given the initial support for the cityhood hypothesis in panel A, we further explore urban commercialization by means of regression analysis, by estimating the following model:
(1) 
 represents one of our commercialization outcomes (licensing, revenue, or spinoffs) in a given university-year.
  is a time-invariant indicator set to 1 if the university sits in a city as defined by IPEDS.
  is a vector of university-specific controls, including Carnegie classification, land-grant status, and public control.
  is a vector of university-county characteristics, including population, GDP per capita, and cluster strength, with
  representing state fixed effects and
  representing year fixed effects. In all estimations of model (1), standard errors are clustered at the university level.
Table 4 presents the results of estimating model (1), when the outcome variable, , is licenses and options executed. We see that being in a city significantly increases the number of licenses a university executes in a given year, with coefficients ranging from 8.65 to 25.35. Further, this significance holds in column (2) when controlling for local characteristics: the amount of local venture capital, industrial cluster strength of the county, the local GDP per capita, and the percent of the population holding (at least) a bachelor’s degree. This also holds in column (3) when controlling for the university’s research activity, land-grant status, public or private status, and the presence of a medical school.
These university-level covariates are interesting in their own right, but they also serve as important proxies for cityhood and thus one of our identification strategies. For instance, we use the allocation of land-grant colleges to control for initial conditions of college campuses. In the United States, land-grant institutions originate with the Morrill Land-Grant Act of 1862, wherein public land was given to several states and territories to enable them to build industrial, agricultural, and mechanical colleges. To wit, land-grant colleges pioneered education and research in many of the applied sciences and engineering—academic departments we often associate with patenting and commercial potential. Importantly, land-grant colleges tend to have campuses in rural and suburban communities, and they accordingly serve as a possible alternative explanation in our estimations. Further, proximity to a land-grant institution has previously been used to instrument for various forms of human capital (e.g., Shapiro, 2006; Moretti, 2004). Inclusion of the land-grant covariate does not alter the significance of the cityhood result.
If we think that each license is worth (on average) $235,000 to a university, a back-of-the-envelope calculation with our most conservative estimate suggests that being in a city nets each university an additional $2.6 million annually in licensing revenue, or roughly twice the average revenue in our sample.
Table 4. Panel Regressions: Licenses and Options Executed
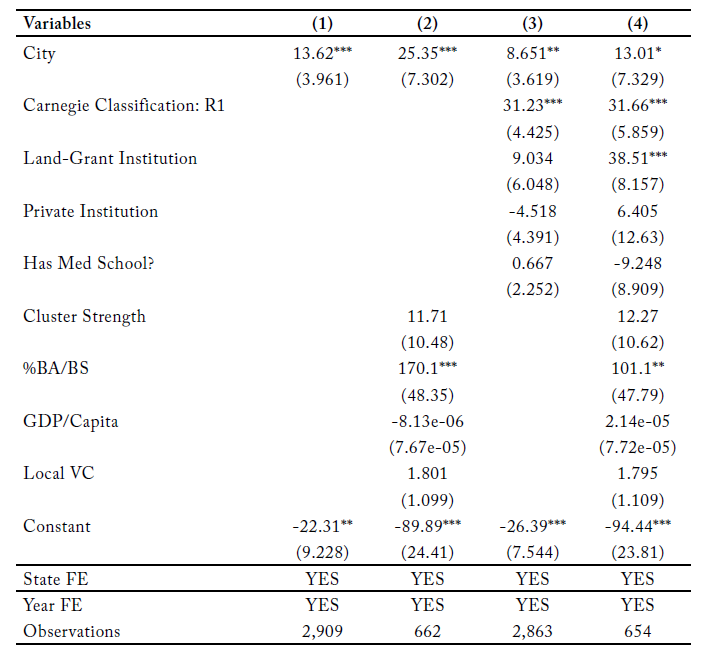
Note: This table represents panel regressions described in section 4. The data come from the Association of University Technology Managers. Each observation corresponds to a university-year. The outcome variable is total licenses and options executed in a given university-year. Both state and year fixed effects (FEs) are included in each regression, and standard errors in all regressions are clustered at the university level. Robust standard errors in parentheses. VC=venture capitalists. *** p<0.01, ** p<0.05, * p<0.1
We further explore the impact of cityhood on commercialization in table 5, where we re-estimate model (1) with (log) gross licensing income as the outcome variable. Being in a city significantly increases income in the sparse model in column (1) as well as in the model controlling for university factors in column (3) and when controlling for licenses executed in column (5), further underscoring the interrelatedness of these two outcome variables (ρ=0.33). However, the coefficient on Cityi loses significance in the local specification in column (2) and the full specification in column (4), suggesting that gross licensing income is somewhat removed from whether a university is in a city and instead the relevant mechanism by which cityhood operates is increased deal flow. Further, these specifications may simply be underpowered. We discuss this deal-flow mechanism more in section 6 below.
Table 5. Panel Regressions: Log Licensing Dollars
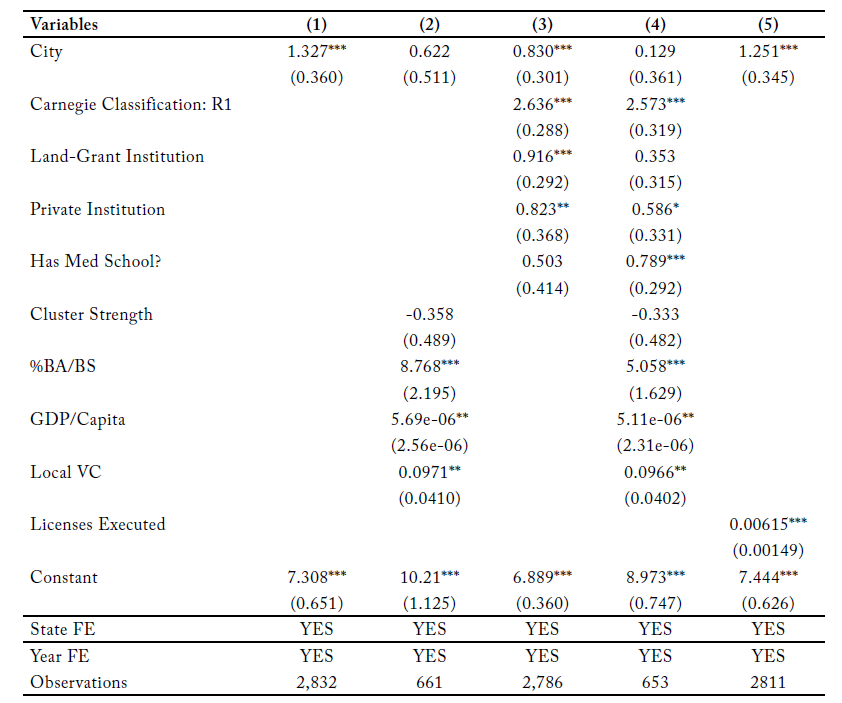
Note: This table represents panel regressions described in section 4. The data come from the Association of University Technology Managers. Each observation corresponds to a university-year. The outcome variable is log gross licensing income in a given university-year. Both state and year fixed effects (FEs) are included in each regression, and standard errors in all regressions are clustered at the university level. Robust standard errors in parentheses. VC=venture capitalists. *** p<0.01, ** p<0.05, * p<0.1
Given the connection between licensing and licensing income, we also explore the number of established startups in a given year. While startups are certainly an important element of commercialization, they are also epistemologically distinct from licensing in that licensing separates an inventor from the product whereas spinning out affords the inventor an entrepreneurial identity, thus uniting the inventor with the ideals of their company.
In table 6, we estimate panel Poisson regressions, otherwise structured the same as model (1), with the outcome variable being the number (count) of startups a university establishes in a given year. Since established startups are registered as count data, Poisson is the appropriate methodological approach. Further, the number of startups a university spins off is highly skewed, with most spinning off 2 or fewer, and very few spinning off more than 20, which speaks to the zero-inflated properties of the Poisson distribution. We find that being in a city significantly increases startup establishment. Our most fully specified model, (4), has a coefficient of 0.567, suggesting that all else equal, sitting in a city enables a university to establish an additional 1.76 startups a year.
Table 6. Panel Poisson Regressions: Startups Initiated
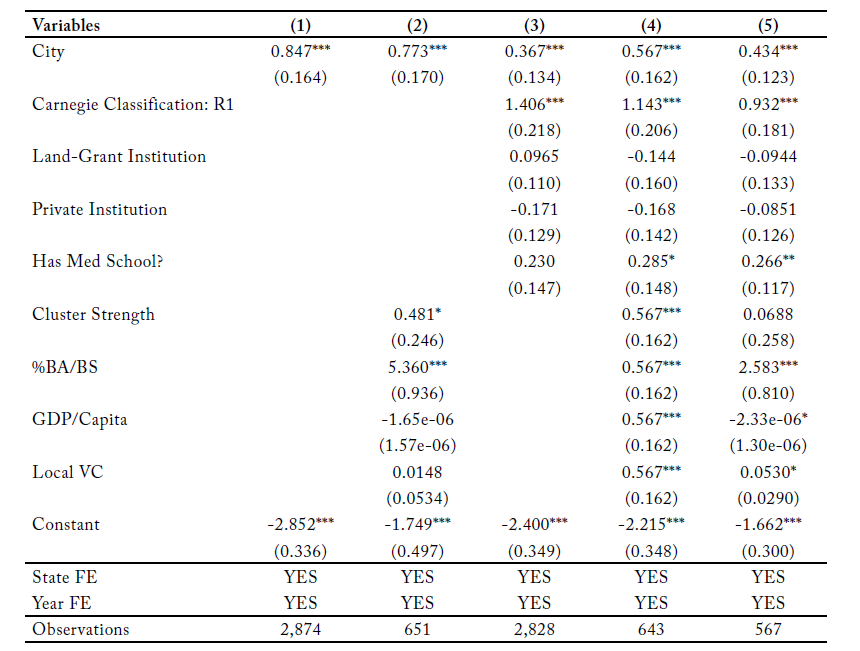
Note: This table represents panel regressions described in section 4. The data come from the Association of University Technology Managers. Each observation corresponds to a university-year. The outcome variable is spinoff companies in a given university-year. Both state and year fixed effects (FEs) are included in each regression, and standard errors in all regressions are clustered at the university level. Column 5 restricts the data set to universities establishing no more than 10 startups. VC=venture capitalists. Robust standard errors in parentheses. *** p<0.01, ** p<0.05, * p<0.1.
However, the powerhouse universities that spin off a great deal more startups, such as MIT and Caltech, tend to be in cities, which may bias our results. As a robustness check, we estimate the same panel Poisson regression with the full set of controls but restrict the sample to universities that established 10 or fewer startups (up to the 95th percentile). Being in a city remains robust to this exclusion criterion and, even fully specified, is still associated with significantly more spinoffs, at a predicted rate of an additional 1.54 per year ( ).
).
In the online appendix, we restrict our definition of city to only those large cities that have populations of at least 100,000, and our uninstrumented results are robust to this modified definition. Indeed, if anything, these appendix results are stronger than the standard definition of university-city as a campus inside an urbanized area. We also include long-difference regressions in an attempt to demonstrate the importance of cityhood with respect to university evolution.6The online appendix can be accessed at https://bit.ly/3g7jkZE.
Difference-in-difference framework and results
In order to assess whether and how proximity to local markets affects commercialization, we must first disentangle the complication that cities and the universities located within them have not only evolved together, but also have undoubtedly influenced each other. Thus, a city in which a university with a large medical school is located may today have different industries and features from a city in which a similar-quality university with no medical school is located, in part because the presence of a large medical center affects the development of the city and the choice of industries within it.
Since this co-development also influences local factor-market availability, addressing it can help to explore the mechanisms that cause cities to matter in terms of commercialization. Our identification strategy follows the approach of Hochberg et al. (2018), and it explores the impact of locally available venture capital using a difference-in-differences regression on whether local VCs had recently fundraised when the NASDAQ crashed in 2000.
Importantly, the NASDAQ crash (and the crash of the technology bubble more generally) was both unexpected and strongly negative. As such, it imposed binding constraints on the ability of local VCs to raise additional funds. Since VCs raise money in a cycle, those who had not recently closed a fund were the most cash constrained immediately following the crash.
In addition to stifling commercialization by limiting the ability of local entrepreneurs to access debt financing (Holmstrom and Tirole, 1997), the crash of 2000 also created tangible and significant search frictions in finding avenues for commercializing research and IP (Lerner and Tåg, 2013, inter alia). Using this crash as a source of plausible exogeneity, we estimate a difference-in-differences model with the specification described in equation (2):
(2) 
represents one of our commercialization outcomes (licensing, revenue, or spinoffs) in a given university-year.  is an indicator set to 1 if the recent funds raised by the active VCs in the university county are less than two years old on average in early 2000 and 0 if the funds are between two and four years old.
  indicates university-year observations in the three-year window following the bubble’s collapse, with
  representing the coefficient on the relevant difference-in-differences interaction term.
  represents a collection of observable university and university-county characteristics, with representing state fixed effects and representing year fixed effects. In all estimations of model (2), standard errors are clustered at the university level.
In doing so, we are able to further comment on the mechanisms through which cityhood impacts commercialization. We see in table 7 that after the crash, universities in cash-constrained counties inked significantly fewer licensing deals. This result holds even when controlling for university factors in column (2), further underscoring the importance of robust factor markets to which city-based universities have access.
Table 7. Difference-in-Differences Estimates
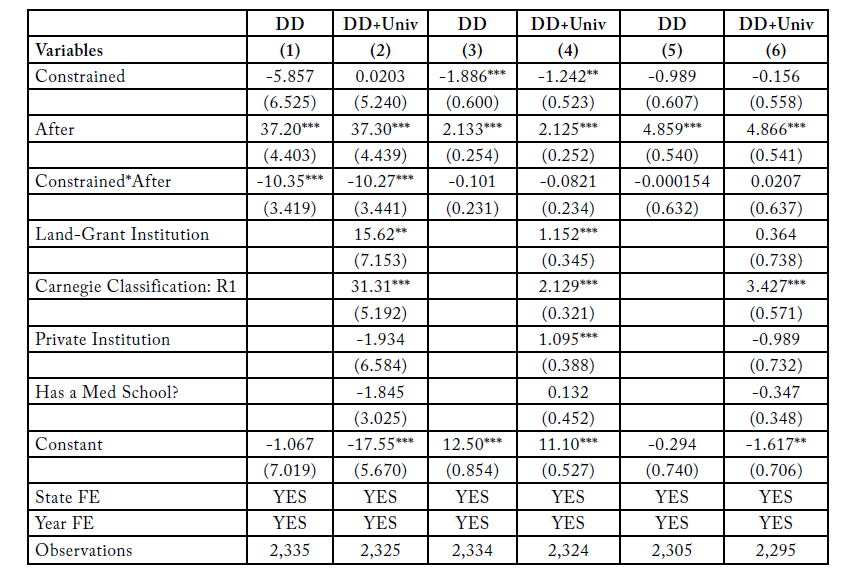
Note: Following Hochberg, Serrano, and Ziedonis (2018), this table reports results of the difference-in-differences (DD) estimator of changes (before and after the technology-bubble collapse) in university commercialization based on the fundraising cycles of venture capital at the time of the crash. The unit of analysis is a university-year estimated in the six-year window surrounding the technology-bubble collapse. Columns (1), (3), and (5) present the DD main results across our three measures of commercialization, and columns (2), (4), and (6) include university-level control variables. The DD coefficient (Constrained*After) estimates the change in the annual university commercialization rate before versus after the technology-bubble collapse in early 2000. The outcome variables in columns (1)–(2), (3)–(4), and (5)–(6) are licenses executed, licensing income, and startups initiated, respectively. Year fixed effects (FEs) are included in each regression, and standard errors in all regressions are clustered at the university level. Robust standard errors in parentheses. *** p<0.01, ** p<0.05, * p<0.1
However, these results are not robust to the alternative outcome variables of licensing income (columns 3–4) and startups initiated (columns 5–6). Constrained university counties execute fewer licenses but do not experience a similar drop in licensing income. This fact suggests that the mechanism through which universities in cities experience increased commercialization is in terms of inking new deals and perhaps less so with the stock of existing deals or, more broadly, the marketplace of ideas. We view these results as consistent with the uninstrumented regressions in tables 4–6, and in particular table 5, where we note that increased licensing income will undoubtedly stem from more deals, but unexpected business cycle downturns limit future commercialization prospects rather than current ones.
In the online appendix we utilize an instrumental-variable approach to address any lingering endogeneity concerns.
Discussion
Universities play a crucial role in the knowledge economy, further supporting innovation and regional economic development, with technology-transfer offices sitting in the middle of this support structure. These university systems are often supported by state and local governments that aim to spur investment, migration, and economic activity to their respective regions with limited resources.
Technology transfer is one such competitive avenue in this space, particularly given the state-level funding of universities. Indeed, the pace of university commercialization has been increasing since the passage of the Bayh-Dole Act of 1980 (Mowery et al., 2002). However, relatively little work has examined how historical placement of the university impacts this commercialization. This open question has grown in importance as policymakers look to grow their local economies while colleges and universities fight over a shrinking pie of research funding. By exploring the local impact cityhood and university placement have on the commercialization of university IP, this study provides insight into three major policy concerns: the impact of agglomeration on innovation, the development of new technologies, and the growth of the knowledge economy more generally.
Our findings suggest that cityhood significantly and meaningfully increases university commercialization. Universities that sit in cities exhibit more licensing and entrepreneurial spawning, even when controlling for features of the university itself as well as those of the local economy.
Interestingly enough, a city-based location of a university likely only tells part of the story. Indeed, access to local markets in general ignores the subtler question of which kinds of research require access to which sort of market. Our results suggest that the importance of cityhood for commercialization rests in new deal formation. From these results, we might posit that while city universities have access to greater capital markets, rural universities are perhaps more likely to commercialize agricultural IP, wherein labor markets might prove more valuable. Regardless, at a time when telecommuting is becoming easier and more common, the impact of cityhood suggests an important policy proposal of suburban and rural campuses installing urban satellites.
We see these findings reflected in “real world” policy insights at both the university and government levels. Take for instance, the recent development of the Cornell University Technology Campus on Roosevelt Island in Manhattan. Cornell Tech’s stated premise is that the “rapid pace of innovation in the digital age calls for new approaches to commercializing university technology, new levels of strategic collaboration between companies and universities.” In other words, in building an urban campus 220 miles from rural Ithaca, New York, Cornell seeks to tie together its history of Ivy League research generation with the financial and commercialization capacities of New York City.
At first blush, policymakers would do well to follow suit. Estimates from 2011 of the potential economic impacts of Cornell Tech are to the tune of “up to 8,000 permanent jobs, hundreds of spinoff companies and more than $23 billion in economic activity over a period of 35 years” (Tsuboyama and Treen, 2011).
Our results are somewhat more circumspect. Indeed, we find our most conservative estimates suggest the impact of an urban campus setting at an additional $2.6 million annually in licensing revenue. On the one hand, this might pale in comparison to a typical university’s operating revenue. For example, the University of Delaware has annual operating revenues of roughly 500 times that ($1.033 billion in 2020). On the other hand, however, this number is perhaps better viewed in the context of new construction, where lab space tends to cost $750 per square foot and recent estimates of new campuses have placed building costs between $30 million and $2 billion (Scalisi, 2002).
Conclusion
This paper studied the regional effects of university technology transfer in a sample of over 3,000 university-years. In it, we see that universities in cities have significantly higher rates of technology commercialization. Results are robust to the inclusion of various controls (such as the university status and local effects) and to the use of various proxies for the existence of the city and presence of local venture capital. We conclude this paper by examining the policy implications of increased commercialization and noting that future research will examine both the sorts of ideas which are commercialized and who is doing the commercialization.
References
Arzaghi, Mohammad, and J. Vernon Henderson. “Networking off Madison Avenue.” Review of Economic Studies 75, no. 4 (2008): 1011–38.
Boldrin, Michele, and David Levine. “The Case against Intellectual Property.” American Economic Review 92, no. 2 (2002): 209–12.
Colyvas, Jeannette, Michael Crow, Annetine Gelijns, Roberto Mazzoleni, Richard R. Nelson, Nathan Rosenberg, and Bhaven N. Sampat. “How Do University Inventions Get into Practice?” Management Science 48, no. 1 (2002): 61–72.
Delgado, Mercedes, Michael E. Porter, and Scott Stern. “Defining Clusters of Related Industries.” Journal of Economic Geography 16, no. 1 (2016): 1–38.
Di Gregorio, Dante, and Scott Shane. “Why Do Some Universities Generate More Start-Ups than Others?” Research Policy 32, no. 2 (2003): 209–27.
Duranton, Gilles, and Diego Puga. “Nursery Cities: Urban Diversity, Process Innovation, and the Life Cycle of Products.” American Economic Review 91, no. 5 (2001): 1454–77.
Feldman, Maryann P., and David B. Audretsch. “Innovation in Cities: Science-Based Diversity, Specialization and Localized Competition.” European Economic Review 43, no. 2 (1999): 409–29.
Harmon, Brian, Alexander Ardishvili, Richard Cardozo, Tait Elder, John Leuthold, John Parshall, Michael Raghian, and Donald Smith. “Mapping the University Technology Transfer Process.” Journal of Business Venturing 12, no. 6 (1997): 423–34.
Henderson, J. Vernon. “Efficiency of Resource Usage and City Size.” Journal of Urban Economics 19, no. 1 (1986): 47–70.
Henderson, Rebecca, Adam B. Jaffe, and Manuel Trajtenberg. “Universities as a Source of Commercial Technology: A Detailed Analysis of University Patenting, 1965–1988.” Review of Economics and Statistics 80, no. 1 (1998): 119–27.
Henderson, Vernon, Ari Kuncoro, and Matt Turner. “Industrial Development in Cities.” Journal of Political Economy 103, no. 5 (1995): 1067–1090.
Hochberg, Yael V., Carlos J. Serrano, and Rosemarie H. Ziedonis. “Patent Collateral, Investor Commitment, and the Market for Venture Lending.” Journal of Financial Economics 130, no. 1 (2018): 74–94.
Hollar, Michael. “Industrial Diversity and Agglomeration Economies.” US Department of Housing and Urban Development Working Paper 06–03 (2006).
Holmstrom, Bengt, and Jean Tirole. “Financial Intermediation, Loanable Funds, and the Real Sector.” Quarterly Journal of Economics 112, no. 3 (1997): 663–91.
Hourihan, Matt, and David Parkes. “Guide to the President’s Budget.” Research and Development FY (2019).
Jaffe, Adam B. “Real Effects of Academic Research.” American Economic Review (1989): 957–70.
Krugman, Paul. “What’s New about the New Economic Geography?” Oxford Review of Economic Policy 14, no. 2 (1998): 7–17.
Lee, Ki-Dong, and Seok-Joon Hwang. “Regional heterogeneity and location choice of FDI in Korea via agglomeration and linkage relationships.” Journal of the Asia Pacific Economy 19.3 (2014): 464-487.
Lerner, Josh. Boulevard of Broken Dreams: Why Public Efforts to Boost Entrepreneurship and Venture Capital Have Failed—and What to Do about It. Princeton University Press, 2012.
Lerner, Josh, and Joacim Tåg. “Institutions and venture capital.” Industrial and Corporate Change 22.1 (2013): 153-182.
Lindelöf, Peter, and Hans Löfsten. “Proximity as a Resource Base for Competitive Advantage: University–Industry Links for Technology Transfer.” Journal of Technology Transfer 29, no. 3 (2004): 311–26.
Moretti, Enrico. “Workers’ Education, Spillovers, and Productivity: Evidence from Plant-Level Production Functions.” American Economic Review 94, no. 3 (2004): 656–90.
Mowery, David C., Bhaven N. Sampat, and Arvids A. Ziedonis. “Learning to Patent: Institutional Experience, Learning, and the Characteristics of US University Patents after the Bayh-Dole Act, 1981–1992.” Management Science 48, no. 1 (2002): 73–89.
Nakamura, Ryohei. “Agglomeration Economies in Urban Manufacturing Industries: A Case of Japanese Cities.” Journal of Urban Economics 17, no. 1 (1985): 108–24.
Office of Technology Commercialization. (2016). The 8 steps of technology commercialization. Retrieved May 11, 2022, from https://research.utexas.edu/wp-content/uploads/sites/6/2015/10/8StepsOfTechCommercialization.pdf.
Parker, Douglas D. and David Zilberman. “University Technology Transfers: Impacts on Local and U.S. Economies.” Contemporary Economic Policy 11.2 (1993): 87-99.
Phan, Phillip H., Donald S. Siegel, and Mike Wright. “Science Parks and Incubators: Observations, Synthesis and Future Research.” Journal of Business Venturing 20, no. 2 (2005): 165–82.
Rafferty, Matthew. “The Bayh–Dole Act and University Research and Development.” Research Policy 37, no. 1 (2008): 29–40.
Scalisi, Tom. “How Much Does It Cost to Build a School?” Levelset, 24 January 2022, https://www.levelset.com/blog/cost-to-build-a-school/.
Shapiro, Jesse M. “Smart Cities: Quality of Life, Productivity, and the Growth Effects of Human Capital.” Review of Economics and Statistics 88, no. 2 (2006): 324–35.
Thursby, Jerry G., and Marie C. Thursby. “Who Is Selling the Ivory Tower? Sources of Growth in University Licensing.” Management Science 48, no. 1 (2002): 90–104.
Tsuboyama, Lauren, and Kate Treen. “Cornell Tech Campus Opens on Roosevelt Island, Marking Transformational Milestone for Tech in NYC.” Cornell Tech (2011), https://tech.cornell.edu/press/.
Valero, Anna, and John Van Reenen. “The Economic Impact of Universities: Evidence from across the Globe.” Economics of Education Review 68 (2019): 53–67.
Zucker, Lynne G., Michael R. Darby, and Marilynn B. Brewer. “Intellectual Human Capital and the Birth of US Biotechnology Enterprises.” American Economic Review 88, no. 1 (1998): 290–306.