


 Journal of Accounting Research
1 Introduction
Many employees have creative ideas about how to innovate within their organization because of their day-to-day involvement in the firm’s operations. However, they often do not share their ideas because doing so requires time and effort (Morrison and Wilhelm Jr. 2004; Garicano and Rayo 2017; Sandvik et al. 2020). Managers therefore need to design incentive structures that reward employees for idea-sharing. In this study, we focus on one type of incentive structure, a contest, which rewards a subset of employees for sharing the best ideas. Contests—specifically, innovation and creativity contests—are commonly seen in practice and span everything from internal firm hack-a-thons, used by companies like Facebook to develop new features, to the Nobel Prizes (Chang 2012). While such contests are common, much is still unknown about how changes in their design can affect the amount and type of creative ideas elicited from participants (Adamczyk et al. 2012). This study contributes to the literature by examining the impact of two critical design choices, the number of prizes that participants compete for, and the identity of the contest’s evaluator, on employees’ idea-sharing. Insights into how to design a creativity contest that motivates idea-sharing are important because long-term firm value can significantly increase if organizations can harness employees’ creative ideas.
The contest literature, which is also widely referred to in economics and accounting as the tournament literature, shows that contests do elicit increased effort from individuals (Lazear and Rosen 1981; Green and Stokey 1983). Most of these studies consider settings in which a participant’s total output increases with effort and can be objectively measured. For creative output, however, the relation between effort and output is not necessarily linear, and the quality of the total output often cannot be objectively measured (Amabile 1982; Unsworth 2001; Kachelmeier et al. 2008). As a result, the findings in the literature do not readily extend to creativity contests in which the outputs are evaluated subjectively. Considering the growing importance of creative efforts in modern businesses, it is important to extend the tournament literature by examining how contest design elements affect subjectively measured creative output.
In studies of tournaments, the number of prizes has been shown to have little effect on participant behavior when the expected value of winning is held constant (Cohen et al. 2008). In contrast, we posit that the number of awards will affect participant behavior in a subjectively evaluated creativity contest. Subjective evaluation of creative output increases participants’ uncertainty regarding their likelihood of winning and consequently reduces their willingness to enter the contest. Unlike in a race where the fastest time wins and participants can estimate what their time will be based on their ability and effort, in a contest with subjective evaluation, it is very difficult to estimate one’s win-likelihood. This difficulty is due to participants’ uncertainty about what the evaluator will value and the effort needed to improve their chances of winning. For example, in a footrace with subjective evaluation, the winner might not be the fastest person but the one who looks the best while running (via an appealing running posture or an attractive outfit). Who is evaluated as the best-looking will depend on the evaluator’s tastes, which are not necessarily known to contestants beforehand. As such, participants may feel that entering a subjectively evaluated winner-take-all creativity contest is not worth their effort, because there is too much uncertainty surrounding the likelihood of winning. However, we predict that offering multiple prizes in a subjectively evaluated creativity contest, even if the prizes are smaller, will increase participation because participants will feel that some of the uncertainty has been mitigated. Instead of needing to submit the one idea that best fits the evaluator’s tastes, the idea only needs to land in the top group, which is an easier threshold to clear, reducing the perceived uncertainty around winning.
We also predict that an employee’s willingness to participate in a creativity contest with subjective evaluation will be influenced by who is designated as the contest’s evaluator. Before deciding to enter a contest, the prospective participants will use perspective-taking to assess the likelihood of their ideas winning, given their perceptions of the evaluator’s tastes. Perspective-taking is an act in which a person tries to imagine the motivations and actions of another person (Batson et al. 1997). We posit that employees will believe that they can more accurately estimate the perspective, that is, the tastes, of the contest’s evaluator when the evaluator has a job more similar to theirs (Parker and Axtell 2001; Epley et al. 2004). As a result, we predict that employees will be more likely to participate in a creativity contest when the evaluator is a workplace peer. We also predict that contest participants will adjust the qualities of their submissions to match what they perceive to be more important to the evaluator (Grant and Berry 2011; Grabner 2014). The literature states that an idea’s overall creativity is measured based on an evaluator’s subjective judgments of its novelty and usefulness within the context of the particular firm or situation (Amabile 1983). We predict that employees will adjust their idea’s attributes, specifically making the idea more useful or novel, depending on what they believe the evaluator will value more (Ostermaier and Uhl 2020).
We conducted a two-stage experiment among online labor market participants to examine how the quantity and quality of creative idea-sharing in a contest is influenced by the number of prizes that participants compete for and the identity of the evaluator. In the first stage, participants completed a screening survey. After that, those who indicated a willingness to return for a second task and who had extensive enough experience on the labor market platform were invited to participate in one of four creativity contests (i.e., the second stage). Participants were randomized into contests following a
two-by-two design. The first treatment varied the number of prizes while holding fixed the total amount of prize money. We manipulated this by having half of the participants compete for one $100 prize and the other half compete for ten $10 prizes. The second treatment, the identity of the evaluator, was manipulated by assigning a panel of online labor market participants (i.e., the peers of the contest participants) as the evaluators of the ideas for half of the participants, while a panel of individuals who regularly conduct surveys among online labor market participants (i.e., the managers of the contest participants) were assigned as evaluators for the other half.
The contests varied in these two design parameters, but the task was the same across all four contests: we asked participants to share their most creative ideas for a survey attention check question that could be used to engender better participation from future survey-takers. Participants were informed of their contest’s prize structure and the identity of their evaluator, and then they were asked to submit their ideas for attention checks. Due to the two-stage nature of our design, we can study the impact of contest design on both participation rates and the quality of the ideas. Our setting creates an environment similar to an actual workplace, where employees would be asked, but not forced, to participate in a creativity contest. Before entering the contest, employees can assess whether their likelihood of winning is sufficient to merit their effort, allowing us to measure participation rates. We also asked participants to submit ideas related to their job, so they were not required to think about something new to them. Our study therefore focuses on the sharing of job-related creative ideas in a professional, field experiment setting (List 2011; Bloomfield et al. 2016).
In line with our predictions, we find that when participants are asked to share their ideas in a creativity contest, the number of prizes and evaluator type significantly affects their behavior. Our results show that both the quantity and quality of the submitted ideas are significantly influenced by these contest design choices. More prizes lead to higher participation. We also find higher participation when the evaluators have the same job role as the contestants (i.e., peer evaluators rather than manager evaluators), indicating that participants feel they have a better chance of winning in this situation. However, higher participation rates appear to come at the expense of the average quality of the submitted ideas. Specifically, we find that the average novelty and creativity scores of the ideas decrease by about 8 percent when multiple small prizes are offered, instead of a single large prize. Using multiple proxies of effort exertion, we also find that participants reduce their average effort when competing for multiple small prizes, rather than one large prize. This suggests that the observed reduction in average idea quality is not just due to an increased participation of individuals with low quality ideas but also due to decreased effort among participants.
In addition, we predict and find evidence that participants adjust the novelty and usefulness of their ideas, depending on the identity of their assigned evaluator. In particular, they submit ideas that are more useful when being evaluated by management. We attribute this to the fact that managers will implement these ideas in practice, so they will emphasize usefulness more than will peer evaluators, who do not bear any of the implementation costs. We confirm this heterogeneity in the focus of manager and peer evaluations by showing that managers place 2.7–4.2 times more weight on usefulness when determining an idea’s overall creativity, relative to peers. These findings suggest that managers can influence the types of creative ideas they elicit by changing the identity of the evaluators of the ideas.
Our study makes several contributions to the literature on creativity and innovation. First, our findings suggest that managers can influence the quantity and quality of the creative ideas shared by their employees through a contest used to elicit idea-sharing. The literature has focused on idea origination and, in general, shows that it is hard to incentivize the generation of creative ideas (Kachelmeier et al. 2008; Gneezy et al. 2011). Although it might be difficult to incentivize “the light bulb moment” with traditional incentive systems, our results suggest that this conclusion does not extend to the further development and dissemination of creative ideas. Our results show that changes to the design of the contest can impact the quality and quantity of employees’ ideas, therefore showing the manageability of this step through incentive structures. Furthermore, we complement the literature on incentivizing creativity by showing that even if employees are motivated to be creative, if they are not appropriately incentivized to share their ideas, valuable ideas may be lost.
Our study also shows that subjective versus objective evaluation plays an important role in contest design and that some of the findings in the tournament literature do not extend to settings with subjectively evaluated outcomes. Subjective evaluation increases uncertainty, reducing participants’ ability to estimate their own chances of winning. Contest designers can alleviate some of this increased uncertainty and improve participation rates by increasing the number of prizes or by designating someone similar to the participants to evaluate the submissions. Importantly, this decision must be made with an awareness that increased participation may result in a reduction in the average quality of the submitted ideas.
Our study has clear implications for managers who want to elicit innovative ideas from their employees. We show that contests can incentivize creative idea-sharing, even when creativity must be subjectively evaluated. We do not propose a one-size-fits-all approach to contest design but instead highlight important trade-offs that managers should consider when designing their own creativity contests. Managers must determine whether they are seeking many good ideas or a single groundbreaking innovation, and they should design their contest accordingly. For example, firms that want to incentivize employees to undertake continuous improvement projects—or other creative endeavors that may not be seen as groundbreaking—should encourage employees to believe they can win even with small ideas. If the only rewards for these activities are promotions or other types of winner-take-all tournaments, many employees may choose not to participate, and the firm may lose out on profit-maximizing ideas. At the other extreme, if every idea is rewarded through a piece-rate system, average idea quality may fall dramatically because employees will not put forth additional effort to improve their ideas. Thus, managers should design contests according to the amount and type of ideas they hope to receive.
2 Motivation
Creative ideas are defined as those that are novel, meaning new or previously unknown, as well as useful, meaning they provide a clear benefit to the firm (Amabile 1983; Runco and Jaeger 2012). Firm managers want to elicit employees’ creative ideas because they are the “fuzzy front end” of innovation—the process by which firms turn creative ideas into increased profits (Reid and De Brentani 2004). For firms to elicit employees’ creative ideas, two things must happen: 1) the employees must have initial ideas, that is, a “light bulb moment,” and 2) the employees must develop their ideas and share them with management (Van Dijk and Van Den Ende 2002). In this study, we focus on the second step—the development and sharing of creative ideas. We assume that some portion of employees will naturally think of creative ideas that can potentially benefit the firm during their day-to-day jobs, but without the proper incentive systems, these employees may not further develop and share their ideas because doing so is costly (Fairbank and Williams 2001; Fairbank et al. 2003). Organizations should therefore implement systems (e.g., monetary incentives, recognition, promotions, etc.) that motivate employees to develop and share their creative ideas (Menzel 2017).
Organizations can motivate creative idea-sharing in a number of ways, such as implicit rewards like promotions or explicit ones like paying an employee for each idea submitted. While each system has merits, in this study we focus on contests as a means of eliciting creative idea-sharing. Contests can be effective motivators. Employees will exert effort based on their belief that they may be rewarded with a prize. Contests direct effort by providing a clear set of rules and instructions concerning the timing and format by which ideas should be shared. The motivating and directing elements of contests have made them popular methods for collecting creative ideas for hundreds of years, from Napoleon’s contests, which yielded important advances in military readiness, such as canning and margarine, which make food easier to transport, to Facebook’s famous annual hack-a-thon, which is cited as one of the most important innovation drivers of the firm, leading to features like chat and calendars (Adamczyk et al. 2012; Chang 2012). Importantly, nearly every company can stage a creative idea-sharing contest to complement its existing compensation structure without overhauling that system (Bradler et al. 2019).
Contest design has been broadly studied in the accounting, management, and economics literatures in the context of motivating effort (Lazear and Rosen 1981; Connelly et al. 2014). In most of these studies, performance linearly increases with effort, and performance outcomes are objectively measured. This is frequently the case even when studying innovation. For example, participants may be asked to solve an unsolved math problem (Kiersz 2008). While it takes creativity to solve the problem, contest evaluators can objectively tell which solutions solve the problem. As another example of a research study of innovation, Dean and Image (2008) examine participants who have been asked to share ideas about how to clean up oil spills in Arctic areas; the winner is the individual who manages to prevent oil from freezing while being collected. This task requires creativity, but the output of the solution was objectively evaluated based on efficacy rates and cost. In our study, however, we focus on the common situation where the value of a proposed idea or solution cannot be objectively measured. For example, when Apple had the idea to make a portable digital music player, the iPod, the value of the idea was uncertain, because its success depended on the success of an online music store, iTunes, where customers could purchase digital songs (Kahney 2004). While portable music players were popular, those players used physical media, like CDs and cassettes, not digital media. This inhibited projecting sales for the iPod, as digital music had not been widely sold before (Edwards 2011). While many critics mocked the device, leaders at Apple subjectively determined it was worth the investment and profited heavily from this assessment (Rossignol 2019).
When the value of a creative idea is assessed subjectively by an evaluator, it matters who the evaluator is, as individuals all have unique tastes and will potentially value creative ideas differently. Subjectivity therefore creates additional uncertainty for employees who are invited to share their ideas in a contest. Not only is there uncertainty about the amount of effort needed to win when performance does not necessarily linearly increase with effort, but there is also uncertainty about how employee output will be valued. This increased uncertainty influences the perceived trade-offs of entering the contest. It is therefore important to study design elements of creativity contests that influence perceived uncertainty and, ultimately, participation rates. In this research, we focus on two important contest design elements: the number of prizes and the type of evaluator. While there may be other critical design elements, we focus on these two because they capture two fundamental choices that managers must make when holding a contest.
2.1 Number of Prizes
In a contest where the total dollar value of the rewards is held constant, the prize structure can still vary greatly. Contests can vary from winner-take-all models to participation-award models. In a winner-take-all contest, a single participant wins the entire prize pool. With participation awards, everyone receives a (usually small) reward for participating. Research on contests with objectively determined winners finds that, in a contest for which potential participants must expend effort to participate, only the expected value of the prize affects their behavior (Cohen et al. 2008).1The type of contest in Cohen et al. (2008) is also known as an all-pay contest, in which all effort is expended before the winner is announced. Examples of all-pay contests are races, art shows, and basketball games. This type of contest is different than, for example, a contest for the best building design (Siegel 2009). This analytical result depends on allowing participants to select into and out of the contest, where prizes with higher expected values will attract more participants.2The contest literature is quite large, and many studies examine optimal prize structures. One of the most famous of these,
Moldovanu and Sela (2001), finds that the optimal number of prizes can be one or more than one, depending on whether participants’ cost functions are linear, concave, or convex. Their result is particularly difficult to translate to the setting of creativity, where effort does not have such a direct relationship with output, making the cost function impossible to estimate. As a result, variations in the number of prizes offered has little effect on behavior, so long as the expected value of the prizes is held constant. However, we predict that in a subjectively evaluated contest the number of prizes that participants compete for will change behaviors.
In a contest where higher effort directly leads to higher performance, only top performers are likely to believe they have a higher likelihood of winning a prize when the number of prizes increases. This is because when evaluation is objective, participants can accurately assess what their output is likely to be, given their level of exertion and ability. Low performers may know that even though the number of winners has increased, their output will still likely fall below the threshold for a prize, so the increase in the number of prizes won’t influence their participation decision. In a contest with subjective evaluation, however, where uncertainty about the evaluator’s tastes obscures who the top performers might be, all performers are likely to believe they have a higher likelihood of winning a prize when the number of prizes increases. If there are multiple prizes awarded instead of a winner-take-all format, more employees will feel the probability of winning a prize is high enough to enter the contest. As a result, we predict that a subjectively evaluated creativity contest using multiple small prizes rather than one large one will increase participation rates.
Moreover, we argue not only that the number of prizes affects participation rates but also that there is a trade-off between the number of ideas shared and the average quality of those ideas. When there is only one large reward, participants will evaluate their chances of winning as lower. Employees who believe that their ideas are potentially of high enough quality to win the single, large reward will exert increased effort to develop and submit their ideas to win. However, employees who feel there is too much uncertainty around their win-likelihood will likely choose not to participate, resulting in fewer low-quality ideas overall. Because of this trade-off between quality and quantity, a high number of prizes, which invites increased participation from individuals with marginally creative ideas, will decrease the average quality of the submitted ideas. That is, we predict that in a subjectively evaluated creativity contest, having participants compete for multiple prizes rather than for one large prize will decrease average idea quality.
2.2 Evaluator Type
In a contest with subjective evaluations, someone or a group of people must be designated to evaluate the quality of each submission. We argue that the type of evaluator affects employee participation in creative idea-sharing contests. We specifically examine the impact of the two most readily accessible and common types of evaluators: 1) the employees at the firm, that is, the peers of the participants, who have relatively similar jobs, and 2) the managers of the firm, that is, the bosses of the participants, who have relatively dissimilar jobs. We posit that the employees invited to participate in the contest will use perspective-taking to predict the tastes of the designated evaluator of the creative ideas (Mead 1934; Ostermaier and Uhl 2020). Several studies show that individuals feel they better understand the perspectives of those they resemble, which increases their confidence in their estimations of how those individuals will behave (Parker and Axtell 2001; Epley et al. 2004). Hence, employees will likely believe it is easier to imagine what their peers will consider creative, versus their managers, because they and their peers have similar knowledge, experiences, and problems at work. Consequently, we predict that evaluator type will influence contest participation rates because the evaluator’s identity influences employees’ estimations of their chances of winning. Specifically, we predict that in a subjectively evaluated creativity contest, using peer evaluators rather than manager evaluators will increase participation.
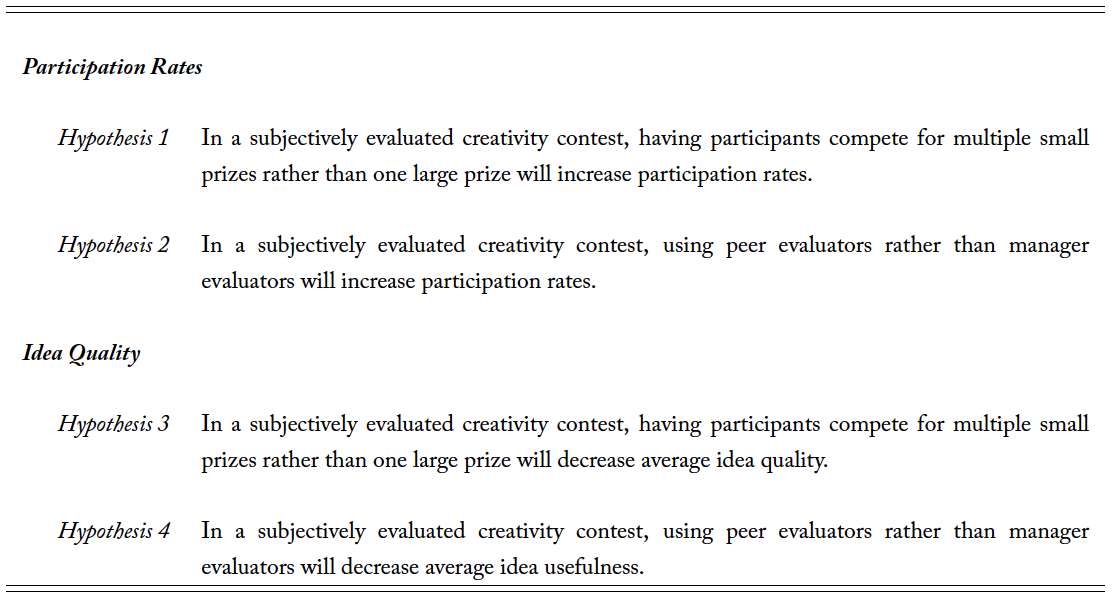
We also argue that the type of evaluator influences the quality of the ideas submitted. As discussed earlier, we follow Amabile (1983) in defining creative ideas as being both novel and useful, and evaluators are to judge the creativity of an idea based on these two dimensions.3Note that novelty and usefulness are not mutually exclusive characteristics of creativity. The most creative ideas are those that are both highly novel and highly useful. We do not, however, expect that every evaluator puts the same weights on these two components of creativity. We predict that manager evaluators, who are in charge of implementing and funding these ideas to increase firm value and who are held accountable for the profits gained or lost, will emphasize the usefulness of the idea rather than its novelty. Peer evaluators, on the other hand, are not likely to be in charge of implementing and funding the ideas and thus are likely to be less concerned about usefulness. We predict that employees will, through perspective-taking, anticipate this difference in focus between evaluators and submit ideas that are more (less) useful when evaluated by their managers (peers). In the table below, we organize and formalize our hypotheses.
Table 1. Hypotheses
3 Experimental Design
To test our hypotheses, we designed a two-by-two experiment on Amazon’s Mechanical Turk (M’turk) (Kittur et al. 2008; Paolacci et al. 2010), which is an online labor market meant for crowd sourcing workers to complete tasks like translations, research experiments, and changing pictures into machine-readable data sources. The experiment took the form of a contest in which participants were offered monetary incentives to submit their most creative ideas as to how researchers could improve the surveys conducted on Mechanical Turk. We incentivized participants to help solve a problem directly related to their everyday job on M’turk—developing a creative attention check question to improve the quality of completed surveys—just as a manager would provide incentives for solving job-specific problems in organizations (Harrison and List 2004; List 2011; Bloomfield et al. 2016).4This study was approved by the IRB at the university the study was conducted at (Study Number 2020-011) and was pre-registered with the American Economic Association (AEARCTR-0005443). This design choice allows participants to use their knowledge and experiences to develop and share creative ideas or to share creative ideas that they conceived during the course of their job. Adding in this level of realism makes this study a strong test of our theory because we can measure real workplace creativity and real workplace contest participation rates. This setting also differentiates our experiment from those in which 1) participants are asked to complete creative tasks that are likely new to them, 2) those that do not give participants extended amounts of time to consider their ideas, and 3) those that do not allow researchers to capture organic participation rates (Kachelmeier et al. 2008; Gneezy et al. 2011; Kachelmeier et al. 2019; Ostermaier and Uhl 2020). The experiment was conducted in three sequential stages: participant screening, idea collection, and idea evaluation, which occurred over the course of four months. Each stage is detailed below in the order that it occurred.
3.1 Participant Screening
We developed a screening survey to identify online labor-market participants who had the necessary technological and tacit knowledge of M’turk to provide creative ideas about surveys conducted on the platform. We used Cloud Research, a third-party website not owned by Amazon, which allowed us to first invite participants to complete the screening survey and then identify and invite only those who provided satisfactory responses to participate in the idea collection part of the experiment. We only invited participants with a task approval rate of 75 percent or above, who had completed over 1,000
human-intelligence tasks (hereafter just “tasks”), and who were not on the Cloud Research Universal Exclude List, a list of IP addresses and Mechanical Turk IDs that have been marked as suspect in other tasks done on Cloud Research. The expected time to complete the screening survey was 10 minutes, and participants were paid $1.33. This resulted in an hourly wage of approximately $8.00, a rate that is above the federal and local minimum wages in the country, state, and city in which this experiment was run. In addition, these wages comport with other research-based surveys done on Mechanical Turk (Farrell et al. 2017; Bentley 2018; LaViers 2019).
Participants answered questions related to their demographic characteristics and their knowledge of and experience with Mechanical Turk. All potential participants saw the same survey. Approximately 1,000 subjects completed the screening survey. Individuals were excluded from participating in the contest if they did not include their M’turk identification number in the appropriate response box on the initial survey, if they did not indicate that they wanted to be contacted for a future task, or if they did not answer every pre-screening question. Screening resulted in 941 participants, who were invited by email and via the Mechanical Turk platform to participate in the idea collection stage of our experiment. Mechanical Turk samples are nationally representative, making them a reasonable proxy for American employees, more so than student samples used in other research (Ross et al. 2010; Berinsky et al. 2012). In addition, it has been shown that Mechanical Turk workers are willing to put forth as much effort as other traditionally used sample populations, meaning we can expect their ideas to be of high enough quality to run this experiment (Farrell et al. 2017). We provide more information about the individuals who were invited to participate in our contests in section 4.
3.2 Idea Collection
In the idea collection stage of our experiment, we asked participants to share with us their most creative ideas for attention checks that researchers could use in the future to improve M’turk surveys.5See appendix A for the exact wording of the materials presented to the participants. An attention check is a question that tests survey takers’ level of focus, often by quizzing them on what they just read or what response they just provided or by asking them to do a quick, sometimes entertaining, engagement task to reduce the monotony of the survey. All of our participants reported in the pre-survey that they were familiar with attention checks, which is not surprising since they had each completed at least 1,000 tasks. We randomly allocated each participant into one of four treatment cells (i.e., contests), in a two-by-two design, which varied 1) the number of prizes that participants competed for and 2) the identity of the evaluator. To vary the number of prizes, half of the participants were told that the person who submitted the most creative idea would receive $100, and the other half were told that the contributors of the 10 most creative ideas would each receive $10. We refer to the former $100 × 1 incentive scheme as “single-prize” and the latter as “multiple-prize.” To vary the identity of the evaluator, half of the participants (specifically, half in each of the two incentive prize structure treatment groups) were told that the creativity of their ideas would be evaluated by a panel of fellow M’turkers, that is, peers in the same job role as them, and the other half were told that the creativity of their ideas would be evaluated by a panel of M’turk task requesters, that is, managers in charge of implementing tasks on the platform. Accordingly, we refer to these treatment cells as “peer evaluator” and “manager evaluator.”
Participants were allowed to submit multiple ideas, with a max of five per day, over the course of seven days. No participant hit the limit of 35 ideas, indicating that this was more than enough entries for each participant. Ideas needed to be less than 750 characters, and each idea needed to be submitted as its own entry, so multiple ideas could not be submitted within a single submission. Participants were told that the creativity of each idea would be judged on two factors: “How novel (i.e., new) and how useful (i.e., realistic)” the idea is. After participants submitted each idea, they were asked two questions: “How long did you spend thinking about or working on this idea?” and “How difficult or easy was it for you to think of this idea?” Contestants were invited to participate in the contest each morning for a week. Importantly, due to the multi-stage nature of our design, we can study the impact of contest design on both participation rates and the quality of the ideas submitted. Our setting creates an environment similar to an actual workplace, where participation is voluntary. Before entering the contest, prospective participants could assess whether the likelihood of winning the contest justified their effort.
3.3 Idea Evaluation
After seven days of idea collection, the idea submission surveys closed, and the idea evaluation began. Peer evaluators were selected from Mechanical Turk, using the same screening survey with the same participant restrictions as was used for the experimental participants. The only change made to the screening survey was the addition of a free response question: “In 500 characters or less, explain why you would be a good judge for an M’turk based contest?” Fifty-two potential evaluators completed the screening survey, 46 of whom said they would be interested in participating in another task. Of these, all three coauthors on this project independently rated the responses to the free response question on a scale of 1 to 10. Participants who earned an average score of 4 or above were invited to evaluate the ideas.6Evaluating the quality of the prospective evaluators’ written responses allowed us to screen for language skills and ensured that a person, not a bot, was responding. It also allowed us to determine which participants were willing and able to judge effectively. This resulted in 25 M’turk evaluators (i.e., peer evaluators).
Following other work on creativity, each idea’s novelty, usefulness, and overall creativity was judged on a scale from 0 to 100 points (Amabile 1983; Sethi et al. 2001; Amabile 2012). To reduce the evaluators’ decision fatigue, we randomly organized the ideas into 27 different surveys that evaluators could complete over time, with approximately 20 ideas per survey (Li and Sandino 2018). M’turk evaluators were paid a flat fee of $2 for each survey they completed (i.e., each batch of approximately 20 ideas they evaluated). In addition, each survey had an attention check question at the end. Participants earned $1 if they correctly answered this question, resulting in a total pay of $3 per survey. Each survey took approximately 15 minutes to complete, resulting in a total pay of $12 per hour. This is notably high pay for an M’turk task, which was meant to incentivize high effort among evaluators. Participants who completed all 27 evaluation surveys made $81 total. To ensure high evaluation quality, participants were told that if they did not answer the attention check questions correctly, they would not be invited back to complete additional evaluations. Participants were sent three surveys on the first day. Their data were checked, their bonuses were paid, and then they were sent five more surveys the next day. This process repeated until participants completed all 27 surveys or were not invited back, due to either a lack of survey completion or poor evaluation quality. To help with order effects, the evaluators were sent the surveys in three different orders.7Subsequent analysis shows that the order in which ideas were evaluated did not significantly affect evaluation scores. Not every evaluator judged each idea, but all ideas were evaluated by at least 12 peer evaluators.
The manager evaluators were seven M’turk task requesters who had experience designing research surveys and experiments on the platform. All of these task requesters had training in research methods from doctoral programs in North America and Europe. These manager evaluators were each paid $10 for completing the initial screening survey, and they had the same fixed plus variable pay ratio as the peer evaluators but at a higher rate. Their pay was set at $15 an hour, resulting in a total payment of $145 if they completed all 27 surveys. They were sent a slightly modified screening survey, which did not ask for their experience as an M’turk participant. These evaluators were shown the same evaluation surveys as the peer evaluators, also in the same three patterns. Once again, not everyone judged every idea, but every idea was judged by at least six manager evaluators. This number of evaluators, while smaller than the number of peer evaluators, still exceeds or comports with other creativity judging panels from prior literature (Kachelmeier et al. 2008; Amabile 2018; Li and Sandino 2018; Cardinaels et al. 2020).
3.4 Score Aggregation
An important consideration was how best to aggregate the various scores given to a single idea, considering the quantity and variety of evaluators. To ensure that evaluations by peers and those by managers were given similar weights in the aggregation, we began by identifying the evaluators in each group who evaluated the highest percentage of total ideas. Among the M’turkers and task requesters who participated as evaluators, five in each group completed 26 or more of the 27 evaluation surveys. We label them “core evaluators.” We then create average novelty, usefulness, and creativity scores for each idea by taking the equal-weighted average score in each category given by these core evaluators. (We refer to this aggregation approach as Core Evaluators.)
To ensure our results are insensitive to the method chosen to aggregate scores, we consider several other methods of aggregation. The simplest is to take the equal-weighted average of all evaluations given to a particular idea along a single-idea quality dimension. As at least 12 peer evaluators and 6 manager evaluators judged each idea, we have at least 18 evaluations for each idea. We call this approach All Evaluators. One downside to this approach is that it overweights peer evaluations, as there are at least double the number of peer evaluators for each idea. We therefore also aggregate scores using only evaluations from peer evaluations and using only evaluations from manager evaluators, and we refer to these approaches as Peer Evaluators and Manager Evaluators, respectively. Finally, to capture the possibility that contest participants may adjust the qualitative characteristics of their ideas to appeal to their assigned evaluators, we also aggregate scores by equally weighting each evaluation from only the idea evaluators that we assigned to participants, either peers or managers. We call this approach Assigned Evaluators.8We show in table A.1 that our idea quality results, which we discuss in section 4.2, are robust to the use of each of these different measures. In appendix B, we list the three most useful, novel, and creative ideas from each of the four treatment cells. Winning participants were paid immediately after all of the ideas were evaluated.
4 Results
Table 2 reports descriptive statistics about the ideas shared in panel A, the participants of the experiment in panel B, and the overall participation rates in panel C. Among the 527 ideas shared, the average novelty score was 46.49, with the least novel idea receiving a novelty score of 3.70 and the most novel idea receiving a novelty score of 77.56. The average usefulness score was 49.41, with a low of 4.40 and a high of 76.20, and the average creativity score was 44.45, with a low of 4.00 and a high of 72.30. Though we told the evaluators that “creative ideas are those that are both useful and novel,” we left it up to them to determine how much weight to give each of these components as they compiled an overall creativity score. Table 3 shows the correlations between the different idea attributes. The correlation between overall idea creativity and novelty, 0.96, is over twice as large as the correlation between idea creativity and usefulness, 0.43. This suggests that evaluators, in general, placed more weight on novelty as a determinant of creativity. We revisit this further in section 4.4.
Panel A of table 2 also shows that the average idea length was about 308 characters (including spaces). In addition, the average idea took 11.33 minutes to develop and share, and the average difficulty response value was 2.51, which is below the midpoint of the 1 to 5 response scale in which 1 denotes “extremely easy,” 3 denotes “neither easy nor difficult,” and 5 denotes “extremely difficult.” We consider these proxies for effort exertion in greater detail in section 4.3.
Panel B of table 2 reports the demographic characteristics of the participants across each of the four treatment cells. This information was gathered during the screening survey. The average participant in our experiment is approximately 38 years old and has completed some college, and about 58 percent of the participants are men. The average participant has completed over 5,000 tasks, suggesting that the sample was composed of highly experienced M’turkers. The variation in demographics among our participants is analogous to what one would expect to find in a large, modern-day firm: 65 percent of the individuals are between 30 and 50 years old, with a larger number of people ages 20 to 40 than over 60. Nearly all participants are high school graduates, and over 90 percent have attended some college. In addition, the gender composition resembles averages reported by the US Bureau of Labor Statistics.9See US Bureau of Labor Statistics, “Labor Force Statistics from the Current Population Survey,” January 22, 2021, https://www.bls.gov/cps/cpsaat11.htm. The far-right column reports p-values from tests of the hypothesis that the averages across the four cells are jointly equal. Along all demographic characteristics, we find no significant differences between conditions.
4.1 Participation Rates
Our first hypotheses concern the effect of contest design on the participation rates of the participants. Panel C of table 2 provides a first glimpse into these effects. Among the multiple-prize incentive ($10 × 10) treatment cells, 276 ideas were shared by 123 unique participants, compared to 251 ideas shared by 105 unique participants in the single-prize incentive ($100 × 1) treatment cells. This provides initial support for hypothesis 1, which predicts that multiple-prize incentives will lead to greater participation than will single-prize incentives. Similarly, within the peer evaluator treatment cells, 308 ideas were shared by 117 unique participants, compared to 219 ideas shared by 111 unique participants in the manager evaluator treatment cells. This provides initial support for hypothesis 2, which predicts that evaluation by peers will lead to greater participation than evaluation by managers.
To formally test these two hypotheses, we use ordinary least squares regressions, which allow us to control for the demographic characteristics of the participants and draw inferences as to the significance of the effects of contest design on participation. To do this, we use a sample of 940 individuals who were invited to participate in the contest;10We remove one extreme outlier from this estimation, as this individual submitted 26 ideas, which is over nine standard deviations above the mean number of ideas shared among contributing participants. The results are qualitatively similar if this individual remains in the sample, albeit the standard errors on Peer Evaluators decrease and the standard errors on Multiple- Prize increase. This individual and the ideas this person shared are included in all other tests and summary statistics. the dependent variable in our regression specification equals the number of ideas each participant shared. The value of this dependent variable equals zero for individuals who were invited to compete in the contest but who chose not to participate.11We find similar results if we use a binary indicator that equals one if an individual submitted at least one idea, and zero otherwise, rather than a discrete variable that captures the number of ideas submitted, albeit the standard errors increase. We regress the number of ideas shared by each individual on an indicator variable to capture the number of prizes participants competed for, Multiple-Prize, an indicator variable to capture evaluator type, Peer Evaluators, and on control variables for each participant’s age, education, gender, and number of tasks completed. Table 4 shows the results of these estimations.
The positive point estimate on Multiple-Prize in column (1) suggests that a multiple-prize contest design leads to greater participation than does a single-prize contest design in a setting with subjectively evaluated outcomes. The results in column (2) show that evaluation by peers, rather than by managers, leads to significantly more ideas shared per participant. This result indicates that employees are more willing to participate in a contest with subjective evaluation when the evaluators are their peers. These positive, significant relations between contest design features and participation rates are robust when including both indicators into the regression model simultaneously, as shown in column (3), and imply that a change in either design feature leads to one additional idea submission per every 6–8 participating employees. Taken together, the raw participation rates in panel C of table 2 and the regression estimations reported in table 4 provide evidence in support of hypotheses 1 and 2.
4.1.1 Are These Design Elements Complements or Substitutes?
The results in columns (1)–(3) of table 4 indicate that both an increase in the number of prizes and the use of peer evaluators improves participation rates in a subjectively evaluated contest. A natural next question is whether these two design elements have complementarities that lead to an interaction effect that is greater than the sum of the two level effects. On the other hand, it could be the case that one effect crowds out the other, leading to an interaction effect that is smaller than the sum of the two level effects.
Panel C of table 2 shows that the greatest participation, in idea submission counts and the unique number of participants, comes from the treatment cell that uses multiple prizes and peer evaluators simultaneously. This suggests that the two effects are unlikely to crowd each other out. To test whether the two design elements actually complement each other, we include the interaction term between Multiple-Prize and Peer Evaluators into the model used to populate column (3) of table 4. In column (4), we show evidence of a marginally significant interaction effect on (Multiple-Prize × Peer). We then compare the sum of the level effects in column (3), 0.273, with the interaction effect in column (4), 0.258. That the interaction effect is smaller than the sum of the level effects suggests that these two design elements are unlikely to be complements in driving participation rates. Our results do suggest, however, that managers who would like to increase participation rates as much as possible can manipulate both of these design elements without either negating the other.
4.2 Idea Novelty, Usefulness, and Creativity
Next we test our hypotheses concerning the effect of contest design on the quality of the ideas shared by participants. To do this, we compile a dataset consisting of all 527 unique ideas shared by the contest participants. We then perform ordinary least squares regressions to estimate the effects of contest design on the three different dimensions of idea quality: novelty, usefulness, and creativity. We control for participant demographics in all of the specifications, as we did in the participation rate analysis. This allows us to control for possible selection effects based on observable characteristics, as not all individuals chose to participate in the contest.
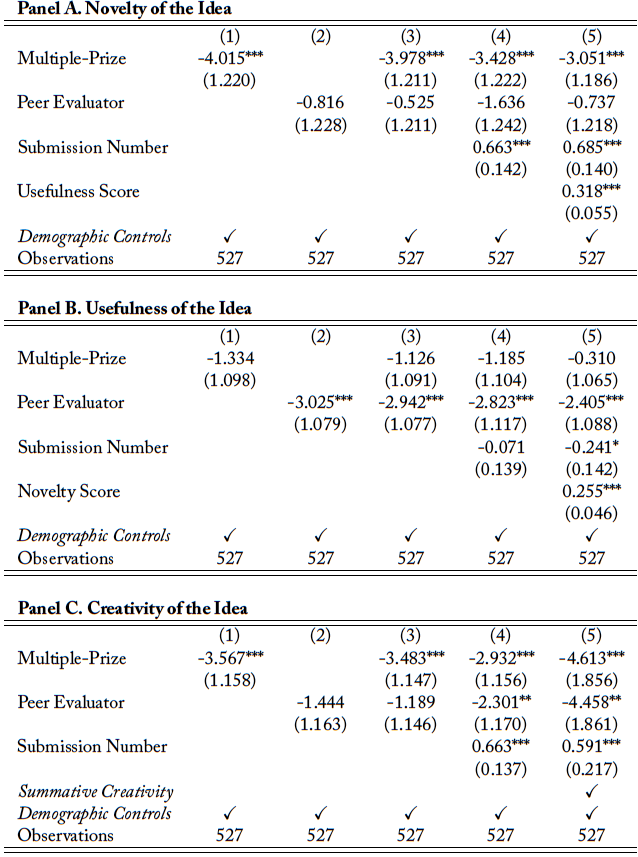
4.2.1 Number of Prizes and Idea Quality
In hypotheses 3, we predict that having participants compete for multiple prizes, rather than a single winner-take-all prize, will lead to decreased average idea quality. To test this prediction, we run separate regressions of idea novelty, usefulness, and creativity on an indicator variable that equals one if the participant is in a treatment cell with more than one prize, Multiple-Prize, and zero otherwise. The results of these estimations are reported in column (1) of table 5. In panel A, we estimate a negative and statistically significant effect of having multiple prizes on the average novelty of the ideas. In panel B, we estimate a small, negative effect on usefulness, but the effect is not statistically significant. In panel C, we estimate a negative and statistically significant effect of multiple-prize incentives on the average creativity of the ideas. These estimated effects of Multiple-Prize on idea quality are robust when controlling for evaluator type in column (3) and imply a reduction in quality of about 8 percent. This suggests that designing a subjectively evaluated contest with multiple winners of small prizes, rather than a single winner of a large prize, leads to reduced average idea quality, regardless of whether employees submit ideas to peers or managers. This reduction in average idea quality may be attributed to the increased participation of individuals with only marginally creative ideas, who might have opted out of participating in a
winner-take-all contest.
One might be concerned that the relation between contest design and idea quality is driven by individuals submitting progressively better or worse ideas, as we allowed them to submit multiple ideas and we find that our design elements impact participation rates. For instance, a participant may submit their best idea first and then only be able to submit low quality subsequent ideas. On the other hand, participants may learn from their previous submissions, leading to incrementally better later submissions.12There was no intermittent feedback provided on any of the submitted ideas, meaning all ideas were collected before evaluation began and winners were chosen. So learning would have occurred as the result of participants developing and sharing ideas, which may have sparked creative thought leading to another idea. In column (4), we add an additional control for the submission number of the idea (i.e., capturing whether it was the participant’s first, second, third, etc., submission). The point estimate on Multiple-Prize is fairly stable between columns (3) and (4), which relieves concerns that the idea quality results are driven by the fact that treatment affects participation rates (shown in table 4) and the possibility that participation rates may impact idea quality (e.g., better idea generation may stem from conceiving multiple ideas). We also observe that the point estimate on Submission Number is positive and statistically significant in panels A and C, suggesting that later submissions were more novel and creative, respectively, than earlier ones.
Finally, in column (5) of panel A (panel B), we control for the idea’s usefulness (novelty) score, and the negative effect of Multiple-Prize on idea novelty (usefulness) continues to hold. This suggests that, holding other aspects of idea quality constant, incentive prize structure meaningfully affects idea novelty. In column (5) of panel C, we replace the evaluator-given creativity score with the sum of an idea’s evaluator-given novelty and usefulness scores. The effect of Multiple-Prize on idea creativity is even more negative under this approach. Taken together, these results provide strong evidence, in support of hypothesis 3, that contests with more prizes lead to decreased average idea quality.
4.2.2 Evaluator Type and Idea Quality
Next we turn to the effect of evaluator type on idea quality. We predict in hypothesis 4 that using peers to evaluate the ideas will lead to ideas that are less useful, on average, than when using manager evaluators. To test this hypothesis, we run separate regressions of idea usefulness on an indicator variable, Peer Evaluators, that equals one if the participant is in a treatment cell with peer evaluators, and zero otherwise. The results of these estimations are reported in column (2) of table 5. In panel B, we estimate a large, negative effect on usefulness, and the effect is statistically significant at the 1 percent level. These effects are robust when controlling for incentive prize structure in column (3), the idea submission number in column (4), and the other components of idea creativity in column (5).13In table 5, we present robust standard errors. If we cluster standard errors by participant, our inference is very similar, and our main results are still significant at the 5 percent level. Over half of the contributing participants submitted only a single idea, so without multiple observations for each participant, we do not report our main results using clustered standard errors. These results provide strong support for hypothesis 4, and they suggest that, if managers design a contest in search of realistic ideas with a clear benefit to the firm, they should designate themselves as the evaluators of the ideas.
While we have a formal hypothesis regarding the effect of evaluator type on idea usefulness, the impact on idea novelty is more ambiguous. We posit that both peers and managers value novel ideas and that managers’ extra appreciation for useful ideas does not necessarily mean participants will submit less novel ideas to managers (i.e., novelty and usefulness are not necessarily mutually exclusive). In panel A of table 5, we show that evaluator type has no effect on idea novelty. The point estimate on Peer Evaluator is small and statistically insignificant in all columns. As discussed previously and as shown in table 3, overall creativity scores appear to be more highly correlated with novelty scores than with usefulness scores. As such, it is unclear whether evaluator type will meaningfully affect the overall creativity of an idea, as evaluator type seems to affect idea usefulness but not idea novelty. The coefficients on Peer Evaluators in panel C of table 5 provide somewhat mixed results in this regard. The point estimates in columns (2) and (3) are not statistically significant, but once we control for the idea submission number in columns (4) and (5), we estimate a negative effect of Peer Evaluators on idea creativity that is statistically significant at the 5 percent level. This finding suggests that participants of creativity contests submit ideas that are, on average, less creative when the ideas are judged by their peers and that this effect is driven by a reduction in the usefulness of the ideas, as their novelty is stable.
4.3 Matching Contest Design to Organizational Objectives
In the previous section, we showed how changes in contest design affect the novelty, usefulness, and creativity of the ideas shared by participants. These analyses identified average treatment effects, providing evidence as to how managers can impact the average quality of the elicited ideas by manipulating contest structure and evaluator type. While an assessment of means provides first-order tests of treatment effects, nonparametric tests can provide additional insights regarding the effects that contest design elements have on idea creativity outcomes. In this section, we examine the idea quality distribution to provide insights into which design elements match the objectives of an organization’s creativity contest. That is, should managers make different design choices if they aim to elicit more good ideas, rather than one or two breakthrough ideas? In addition, we consider the impact that these contest design elements have on the amount of effort exerted by participating employees, providing valuable insights for contest designers.
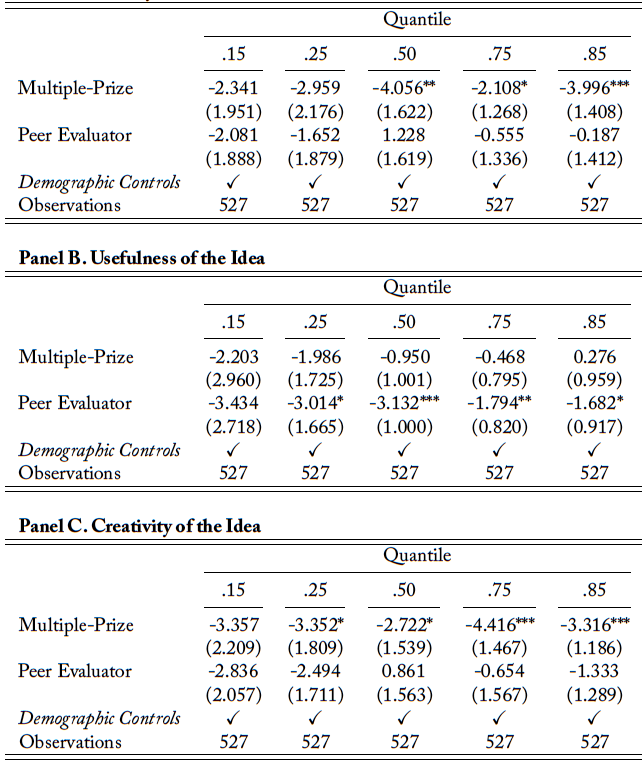
To illuminate these important questions, we first test whether the effects of contest design on idea quality exist across the entire quality distribution or just part of it. To do this, we run quantile regressions using the same specification employed in column (3) of table 5. We separately consider the effects of prize numbers and evaluator type on idea novelty, usefulness, and creativity at the 15th, 25th, 50th, 75th, and 85th percentiles of the corresponding idea quality dimension. These tests compute the differences in idea quality based on our contest design elements at different points in the distribution, with the 50th percentile being a comparison of medians. These results are displayed in table 6, with panels A, B, and C reporting the effects on novelty, usefulness, and creativity, respectively. The coefficients on Multiple-Prize in panel A (panel C) show that the negative effect of multiple-prize incentives on idea novelty (creativity) is most pronounced among the ideas in the upper half of the novelty (creativity) distribution. This suggests that the number of prizes that participants compete for impacts the novelty (creativity) of the most novel (creative) ideas, but it does not have as significant of an impact on the quality of ideas in the left tail of the distribution. Said another way, single-prize incentives help make the best ideas better but don’t necessarily impact the quality of the worst ideas.
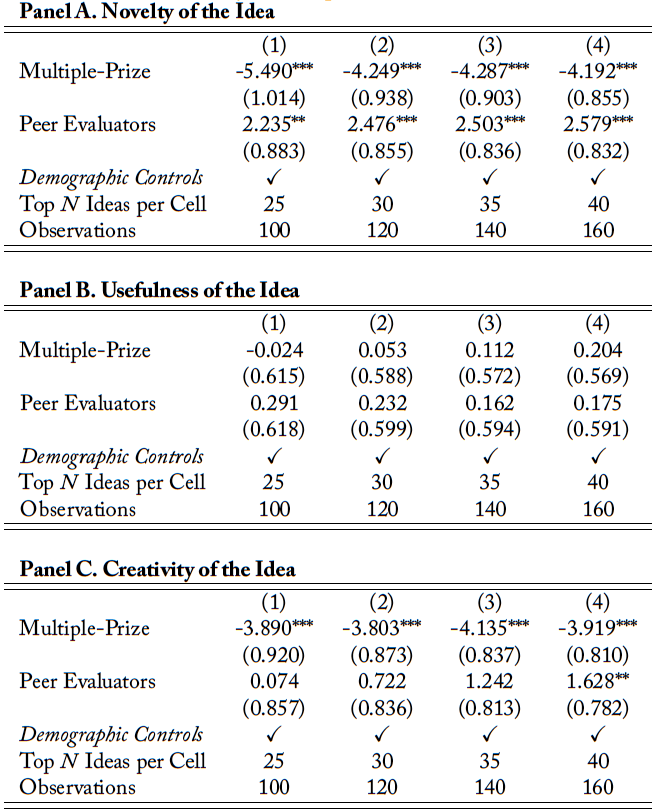
In panel B, we consider the impact of contest design on idea usefulness at several different points along the usefulness distribution. In table 5, we identified a strong negative relation between Peer Evaluators and idea usefulness. The coefficients on Peer Evaluators in panel B of table 6 suggest that this negative relation is more significant among the most useful ideas. While the point estimate in the left-most column is large, it is not precisely estimated. However, given the near monotonic decrease in effect size as we move from left to right in the table, it may be the case that the effect of evaluator type on idea usefulness is actually less pronounced in the right tail of the distribution. To investigate this further, we consider the treatment effects among only the most highly rated ideas. If managers’ main objective is to solicit several outstanding ideas, then they should design their contest in a way that positively impacts the right tail of the quality distribution of ideas. To test this in our setting, we run the same regression specifications used to populate column (3) of table 5, but rather than using the entire sample of ideas, we only use the top ideas along a particular dimension from each of the four treatment cells. The results of these subsample estimations are presented in table 7, where columns (1), (2), (3), and (4) consider the top 25, 30, 35, and 40 ideas from each treatment cell, respectively.
If the only effect that changes in incentive prize structure have on idea quality is through discouraging low-quality submissions, then we would not expect the right tail of the quality distribution to be impacted by changes in incentive prize structure. If, however, single-prize incentives, relative to multiple-prize incentives, prompt creative thinkers to exert additional effort in an attempt to submit the single most creative idea, then we should see a significant effect of incentive prize structure on idea quality among the top ideas. Panels A and C show that the negative effect of Multiple-Prize on idea novelty and creativity, respectively, is large in magnitude and highly significant when focusing on only the top ideas in each category. The point estimate on Multiple-Prize in column (1) is 38 percent (12 percent) larger than the corresponding point estimate in table 5 when considering idea novelty (creativity). These findings are consistent with and aid in the interpretation of the results of the quantile regression estimations.14Similarly, in panel B of table 7, we do not find a significant relation between evaluator type and idea usefulness in the right tail of the idea usefulness distribution. This finding provides clarity into the somewhat mixed findings from panel B of table 6, where the magnitude of the effect decreased along the idea usefulness distribution, though the statistical significance persisted. This evidence suggests that single-prize incentives do not only crowd out poor idea submissions, but they may also lead participants with high quality ideas to exert extra effort in turning their good ideas into great ideas.
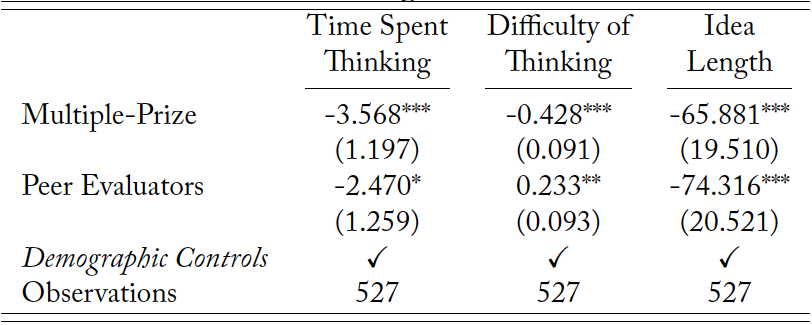
To provide additional support for the notion that contest design affects effort exertion, we consider several additional proxies of participant effort. Each time a participant submitted an idea, they were asked two questions about that idea: 1) “Approximately how long did you spend thinking about or working on this idea?” and 2) “How difficult or easy was it for you to think of this idea?”15Answer options for the first question were as follows: “I did not spend any time at all,” “Less than 5 minutes,” “More than 5 minutes, less than 15 minutes,” “More than 15 minutes, less than 30 minutes,” “More than 30 minutes, less than 1 hour,” and “More than 1 hour.” Answer options for the second question were as follows: “Extremely easy,” “Somewhat easy,” “Neither easy nor difficult,” “Somewhat difficult,” and “Extremely difficult.” Participants responded to each of these questions immediately after submitting an idea, and these responses proxy for the effort exerted by each participant. As mentioned earlier, the average idea took over 11 minutes to submit, and the average reported difficulty response was between “Somewhat easy” and “Neither easy nor difficult.” As a third proxy for effort exertion, we consider the length of the submitted idea, as—all else equal—longer ideas require greater effort to share.
To estimate the impact of contest design on effort exertion, we adopt a similar specification to that used in table 5, but we set the dependent variable to be one of our three effort proxies. Table 8 displays the results. In column (1), we regress Time Spent Thinking on indicator variables for Multiple-Prize and Peer Evaluators and on the participant’s demographic controls. In column (2), we consider Difficulty of Thinking, and in column (3), we consider Idea Length. Across all three effort proxies, we estimate a negative and statistically significant relation between Multiple-Prize and effort exertion. Specifically, when participants competed for several smaller prizes, as opposed to one large prize, they spent about 3.5 fewer minutes thinking of the idea, felt the idea was easier to conceive, and submitted an idea that was 66 characters shorter. These results are consistent with our earlier findings and provide meaningful insights for managers. If a manager’s goal is to increase employee participation or push for continuous improvement, where every idea matters, then designing a contest with multiple-prize incentives may be the better approach, as this increases low-effort—that is, low-cost—participation (Van Dijk and Van Den Ende 2002). If, however, the manager wants participants to exert high effort to devise high quality ideas, then higher powered incentives are likely warranted.
4.4 Creativity as a Function of Novelty and Usefulness
As we discussed previously, creative ideas are those that are both novel and useful (Amabile 1983). When ideas are evaluated subjectively, the evaluator likely also decides how much weight to place on each element when making an overall creativity assessment. We argue that evaluators’ roles within an organization are likely to influence the weight they place on novelty and usefulness. We posit that manager evaluators place greater emphasis on usefulness as a driver of overall creativity because they have to bear the costs of implementing the ideas, so they will place additional value on realistic ideas with a clear benefit to the firm. As discussed above, we predict and find evidence in support of the belief that participants anticipate this and adjust their submissions accordingly.
Here we empirically test whether managers actually place more emphasis on usefulness by regressing an idea’s overall creativity score on its novelty and usefulness scores. We do this in two separate regressions, with the first considering the scores given by peer evaluators and the second considering the scores given by manager evaluators. We then compare the relation between peer usefulness scores and peer creativity scores to the relation between manager usefulness scores and manager creativity scores.
Panel A of table 9 considers the scores given by peer evaluators. In column (1), we use the main sample of unique ideas and regress the average peer creativity score given to each idea on the average novelty score and average usefulness score given to each idea. In column (2), instead of using average scores for each idea, we expand the sample to include each individual score given to each idea. There were 8,961 unique idea-evaluator scores given by peer evaluators and 3,314 unique idea-evaluator scores given by manager evaluators. In column (3) we include evaluator fixed effects, and in column (4), we include idea fixed effects to ensure our results are not heavily influenced by the scores given by a single evaluator or by the scores received by a single idea. Panel B is analogous to panel A, but it considers the scores given by manager evaluators.
Table 9 shows that novelty and usefulness each relate positively and significantly to creativity among both peer and manager evaluators. To test the notion that manager evaluators emphasize usefulness more than do peer evaluators, we compare the magnitude of the point estimates on Peer Usefulness Score and Manager Usefulness Score. The coefficients on Manager Usefulness Score are 2.7–4.2 times larger than the coefficients on Peer Usefulness Score. The differences between the coefficients are statistically significant at the 1 percent level across all columns, suggesting that manager evaluators place significantly more weight on usefulness as a component of creativity than do peer evaluators. The differences between the point estimates on Peer Novelty Score and Manager Novelty Score are also statistically significant, suggesting that peer evaluators place more weight on idea novelty when judging the overall creativity of an idea than do manager evaluators. This empirical evidence aligns with our earlier propositions and supports our idea quality results discussed in section 4.2.
5 Conclusion
We conduct an experiment to examine employees’ willingness to develop and share their value-enhancing ideas when motivated by a contest that rewards creativity. We hypothesize and find that the quantity and quality of the creative ideas that are developed and shared can be substantially influenced by changes in the number of prizes that participants compete for and the identity of the contest’s evaluators (contestants’ peers versus their manager). We find that the number of awards has a significant impact on participation rates and idea quality. When the number is high, we find more employee participation and decreased average idea quality. We also find that the identity of the individual who evaluates each idea meaningfully affects participation rates and idea quality. Specifically, employee participation rates are higher when their peers evaluate their ideas. We define creative ideas as those that are both novel and useful, and we find that employees adjust the content of their ideas based on who judges their ideas’ creativity (Amabile 1983). In particular, employees share ideas that are significantly more useful when the ideas are evaluated by a manager.
Although our findings suggest that managers should carefully consider the design of their contests as the design elements we study affect employees’ participation and creative focus, we do not find any single contest design that is universally better when it comes to the quantity and quality of the creative ideas shared. As such, managers should consider whether they need many good-enough ideas or one or two breakthrough ideas. If managers are interested in engaging many employees and gathering many ideas, they should help employees feel that they are more likely to win a prize by using peer evaluators, more prizes, or both. If managers are interested in only the highest quality ideas, they should evaluate the ideas themselves, offer a large winner-take-all prize, or both. Future research could extend our study by examining other ways in which management can reduce the win-likelihood uncertainty that reduces employees’ willingness to develop and share creative ideas or other subjectively valued outcomes.
Our setting has limitations that provide opportunities for future research. In discussions about creativity, there is often a distinction made between the “light bulb moment,” when an employee first conceives a creative idea, and the further development and sharing of the idea. This distinction is important because, although it might be hard to incentivize the light bulb moment, our findings show that participants’ willingness to develop and share their ideas is predictably influenced by contest design elements. As a result, organizations should recognize that incentives can drive creative effort and output, even if it is not clear whether incentives can spark original creative thought. In our setting, it very well may be true that the contest incentives enhanced the inception of creative ideas, but our experimental design does not allow us to precisely delineate between ideas that originated before or after the onset of the contest. We leave it to future research to examine the impact of creativity contests on the initial stage of creative idea development: the light bulb, or “ideation,” moment.
Our experimental design varies the level of similarity between idea contributors and evaluators based on whether the two perform the same role within the organization. There are other similarities between contributors and evaluators along other dimensions, which also can influence employees’ perspective-taking strategies. For example, similarity can come from the two groups having overlap in their information, experiences, demographic characteristics, and so on. Future research could consider how similarities and dissimilarities between the contributors and evaluators along these other dimensions affect the quantity and quality of creative output. For example, if managers want ideas that they can sell to a new market segment, they may want to assign employees who are more similar to consumers in that market segment to evaluate the ideas. This may increase perspective-taking actions from employees to share ideas that better fit that new customer group.
Lastly, our work considers two different prize structures, a single prize or multiple prizes, all with the same expected value. These two structures are two of many interesting prize structures documented in the objective tournament literature. Future research should consider other prize structures, such as a mixture of small and large prizes, prizes of different magnitudes that vary by participant rank, or contests with participation fees. Our finding suggest that contest designers may be able to get the best of both worlds, high quantity and high quality ideas, through a particular mixture of prize characteristics.
Tables
Table 2. Descriptive Statistics for the Main Variables of Interest
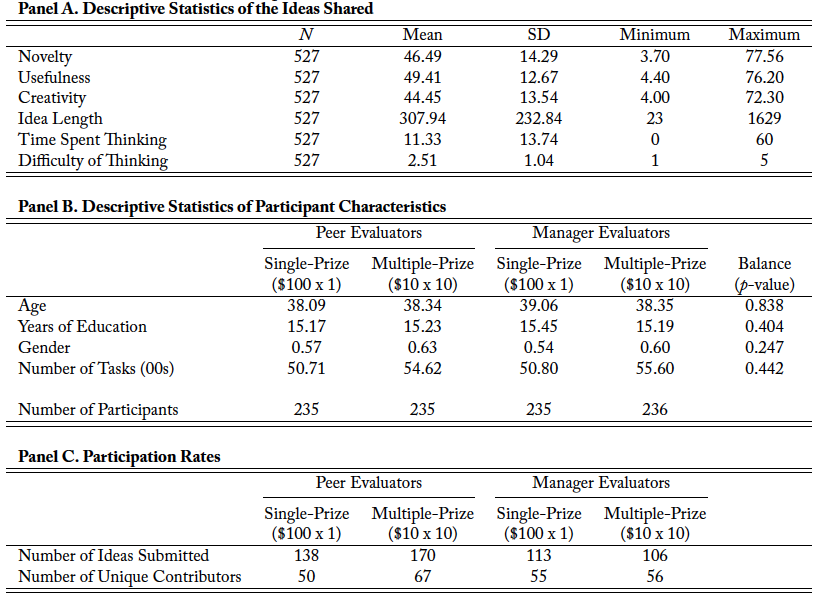
Notes: Panel A is based on the sample of 527 unique ideas. Panel B is based on the sample of 941 individuals who were invited to participate in the contest after completing the screening survey and indicating their interest in being invited back to complete another task. Panel C reports the number of unique ideas and unique contributors in each treatment cell.
Table 3. Correlation Table
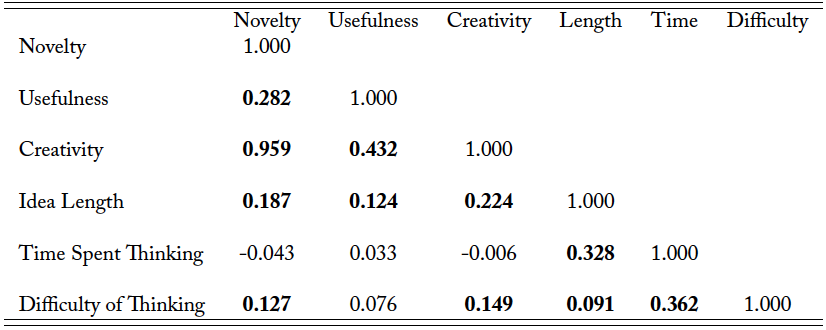
Notes: Correlations across the sample of 527 unique ideas. Bold font indicates that the correlation is statistically significant (p-value < 0.05).
Table 4. Effect of Design Elements on Participation Rates
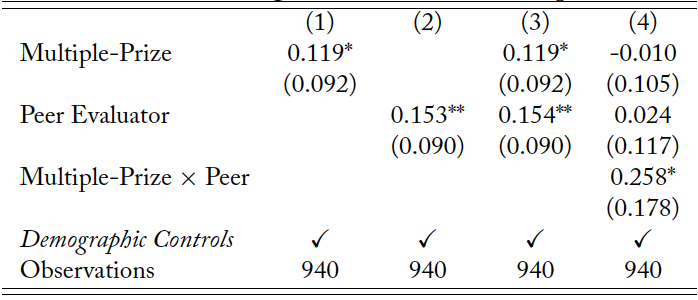
Notes: The dependent variable is equal to the number of ideas submitted by each participant. The value of this dependent variable is set to zero for individuals who were invited to compete in the contest but who chose not to participate. We regress the number of ideas shared on treatment cell indicator variables and demographic control variables. Demographic controls include each participant’s age, education, gender, and number of tasks completed. Regression specifications include a constant, but we do not report the constant for brevity. We remove one extreme outlier from the sample, as this individual submitted 26 ideas, which is over 9 standard deviations above the mean number of ideas shared among contributing participants. The results are qualitatively similar if we leave this individual in the sample, albeit the standard errors on Peer Evaluators decrease and the standard errors on Multiple-Prize increase. Robust standard errors are reported in parentheses. The symbols *, **, and *** denote statistical significance at the 10 percent, 5 percent, and 1 percent levels, respectively, from one-tailed tests when testing a hypothesis and two-tailed tests otherwise.
Table 5. Effect of Design Elements on Idea Novelty, Usefulness, and Creativity
Notes: We use a dataset consisting of all 527 unique ideas shared by the contest participants. We then perform ordinary least squares regressions to estimate the effects of contest design on the three different dimensions of idea quality: novelty, usefulness, and creativity. We control for participant demographics in all of the specifications. Demographic controls include each participant’s age, education, gender, and number of tasks completed. The dependent variable in panels A, B, and C is an idea’s average novelty, usefulness, and creativity score, respectively, using the Core Evaluator aggregation. Regression specifications include a constant, but we do not report the constant for brevity. Robust standard errors are reported in parentheses. The symbols *, **, and *** denote statistical significance at the 10 percent, 5 percent, and 1 percent levels, respectively, from one-tailed tests when testing a hypothesis and two-tailed tests otherwise.
Table 6. Quantile Regression Results
Notes: The results of separate quantile regressions are displayed to compare the idea scores based on incentive prize structure and evaluator type at different percentiles. We control for participant demographics in all of the specifications. Demographic controls include each participant’s age, education, gender, and number of tasks completed. Regression specifications include a constant, but we do not report the constant for brevity. Robust standard errors are reported in parentheses. The symbols *, **, and *** denote statistical significance at the 10 percent, 5 percent, and 1 percent levels, respectively, from one-tailed tests when testing a hypothesis and two-tailed tests otherwise.
Table 7. Focus on Only the Top Ideas in Each Treatment Cell
Notes: For each scoring metric, we select the highest ranked 25, 30, 35, or 40 ideas in each of the four treatment cells based on that metric. We then pool these ideas together to assess how incentive prize structure and evaluator types affect the novelty, usefulness, and creativity among the best ideas. We control for participant demographics in all of the specifications. Demographic controls include each participant’s age, education, gender, and number of tasks completed. Regression specifications include a constant, but we do not report the constant for brevity. Robust standard errors are reported in parentheses. The symbols *, **, and *** denote statistical significance at the 10 percent, 5 percent, and 1 percent levels, respectively, from one-tailed tests when testing a hypothesis and two-tailed tests otherwise.
Table 8. Contest Design and Effort Exertion
Notes: The specifications in this table mirror those in column (3) of table 5, but with different dependent variables that proxy for effort exertion. In column (1), we regress Time Spent Thinking on indicator variables for Multiple-Prize and Peer Evaluators and on the participant’s demographic controls. Demographic controls include each participant’s age, education, gender, and number of tasks completed. In column (2) we consider Difficulty of Thinking, and in column (3) we consider Idea Length. Regression specifications include a constant, but we do not report the constant for brevity. Robust standard errors are reported in parentheses. The symbols *, **, and *** denote statistical significance at the 10 percent, 5 percent, and 1 percent levels, respectively, from one-tailed tests when testing a hypothesis and two-tailed tests otherwise.
Table 9. Creativity as a Function of Novelty and Usefulness
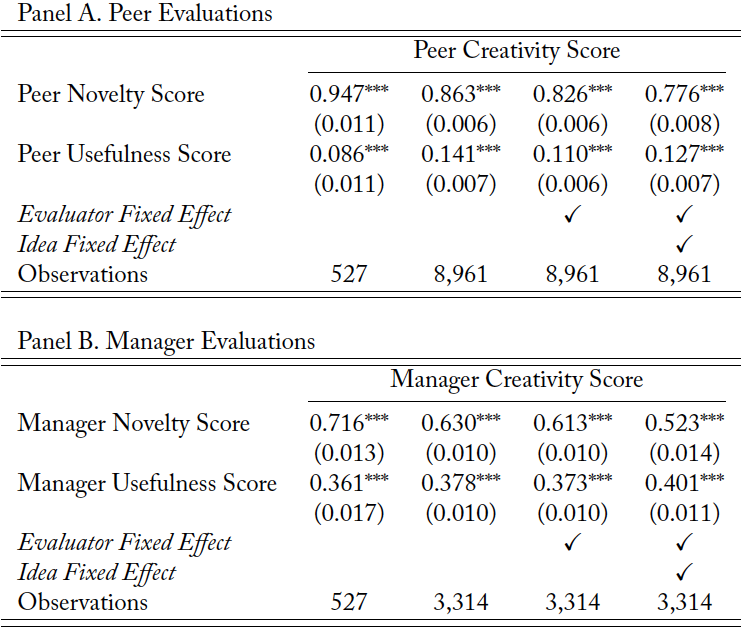
Notes: These results are meant to compare the relation between peer usefulness (novelty) scores and peer creativity scores to the relation between manager usefulness (novelty) scores and manager creativity scores. In column (1), we use the main sample of unique ideas and regress the average peer creativity score given to each idea on the average novelty score and average usefulness score given to each idea. In column (2), instead of using average scores for each idea, we expand the sample to include each individual score given to each idea. There were 8,961 unique idea-evaluator scores given by peer evaluators and 3,314 unique idea-evaluator scores given by manager evaluators. In column (3) we include evaluator fixed effects and in column (4) we include idea fixed effects. Regression specifications include a constant, but we do not report the constant for brevity. Robust standard errors are reported in parentheses. The symbols *, **, and *** denote statistical significance at the 10 percent, 5 percent, and 1 percent levels, respectively, from one-tailed tests when testing a hypothesis and two-tailed tests otherwise.
Appendix A
A. Survey Materials
A.1 Invitation Email:
Welcome to The Creativity Contest! You’ve been selected to be a part of a contest. We’ve selected you based on the knowledge and experience you demonstrated about Mechanical Turk in our screening survey. The goal of the contest is to find the most creative ideas to help us improve our surveys. The ten most creative ideas will each receive a $10 bonus. [or] The most creative idea will receive a $100 bonus. The creativity of each idea will be judged by a panel of M’turk workers. [or] by a panel of M’turk HIT requesters. To find out more open the HIT! Here is the link: http://app.cloudresearch.com/Router/Mturk/233415 Thank you The BLS Research Project Team
A.2 Instructions:
Introduction: We are looking for your creative ideas to help us improve our M’turk based surveys.
One major problem we have is that some participants stop paying attention and don’t give us high quality answers throughout the entire survey. We are seeking your help to fix this problem. We want to know what you think the most creative way to get people to pay attention is. In order to gather the ideas, we are running a contest and inviting you to be a part of it.
Contest Rules: The creativity of each idea will be judged on two factors: how novel (i.e., new) and how useful (i.e., realistic) is the idea? Each idea submitted will be judged anonymously by a panel of M’turk workers. [or] by a panel of M’turk HIT requesters. The 10 most creative ideas will each receive a $10 bonus. [or] The most creative idea will receive a $100 bonus. Take your time to think of your ideas, this survey is open to you until the 23rd of July. It won’t fill up or close. If you have more than one idea, you can submit multiple ideas in one survey or you can submit this survey multiple times. Each idea you submit increases your chances of being a winner! Approximately 240 other M’turkers have been invited to participate in this contest. To submit your ideas and enter the contest, click next!
A.3 Idea Entry:
Researchers want M’turk participants to pay more attention during surveys so that they provide more high-quality answers.
Using 750 characters or less, What is a creative idea that you have for an attention check on M’turk?
Please only enter one idea in this text box. If you have more than one idea, you can enter it on the next page.
A.4 Post Questions:
Approximately how long did you spend thinking about or working on this idea?
• I did not spend any time at all.
• Less than 5 minutes.
• More than 5 minutes, less than 15 minutes.
• More than 15 minutes, less than 30 minutes.
• More than 30 minutes, less than 1 hour.
• More than 1 hour.
How difficult or easy was it for you to think of this idea?
• Extremely difficult
• Somewhat difficult
• Neither easy nor difficult
• Somewhat easy
• Extremely easy
References
Adamczyk, Sabrina, Angelika C. Bullinger, Kathrin M. M.öslein. 2012. Innovation contests: A review, classification and outlook. Creativity and Innovation Management 21(4) 335–360.
Amabile, Teresa M. 1982. Social psychology of creativity: A consensual assessment technique. Journal of Personality and Social Psychology 43(5) 997.
Amabile, Teresa M. 1983. The social psychology of creativity: A componential conceptualization. Journal of Personality and Social Psychology 45(2) 357.
Amabile, Teresa M. 2012. Componential theory of creativity. Harvard Business School 12(96) 1–10. Amabile, Teresa M. 2018. Creativity in Context: Update to the Social Psychology of Creativity. Routledge.
Batson, C. Daniel, Shannon Early, Giovanni Salvarani. 1997. Perspective taking: Imagining how another feels versus imaging how you would feel. Personality and Social Psychology Bulletin 23(7) 751–758.
Bentley, Jeremiah W. 2018. Challenges with amazon mechanical turk research in accounting. Available at SSRN 2924876.
Berinsky, Adam J., Gregory A. Huber, Gabriel S. Lenz. 2012. Evaluating online labor markets for experimental research: Amazon.com’s mechanical turk. Political Analysis 20(3) 351–368.
Bloomfield, Robert, Mark W. Nelson, Eugene Soltes. 2016. Gathering data for archival, field, survey, and experimental accounting research. Journal of Accounting Research 54(2) 341–395.
Bradler, Christiane, Susanne Neckermann, Arne Jonas Warnke. 2019. Incentivizing creativity: A large-scale experiment with performance bonuses and gifts. Journal of Labor Economics 37(3) 793–851.
Cardinaels, Eddy, Bart Dierynck, Wenqian Hu. 2020. Rejection, reward type, and employee creativity: When chocolate is better than cash. Georgia Tech Scheller College of Business Research Paper (17-32).
Chang, Alexandra. 2012. Deep inside a facebook hackathon, where the future of social media begins. Wired . Cohen, Chen, Todd R. Kaplan, Aner Sela. 2008. Optimal rewards in contests. The RAND Journal of Economics 39(2) 434–451.
Connelly, Brian L., Laszlo Tihanyi, T. Russell Crook, K. Ashley Gangloff. 2014. Tournament theory: Thirty years of contests and competitions. Journal of Management 40(1) 16–47.
Dean, Cornelia, E. T. Image. 2008. If you have a problem, ask everyone. New York Times 22.
Edwards, Benj. 2011. The ipod: How apple’s legendary portable music player came to be. MacWorld.Com .
Epley, Nicholas, Boaz Keysar, Leaf Van Boven, Thomas Gilovich. 2004. Perspective taking as egocentric anchoring and adjustment. Journal of Personality and Social Psychology 87(3) 327.
Fairbank, James, William Spangler, Scott David Williams. 2003. Motivating creativity through a computer-mediated employee suggestion management system. Behaviour & Information Technology 22(5) 305–314.
Fairbank, James F., Scott David Williams. 2001. Motivating creativity and enhancing innovation through employee suggestion system technology. Creativity and innovation management 10(2) 68–74.
Farrell, Anne M., Jonathan H. Grenier, Justin Leiby. 2017. Scoundrels or stars? theory and evidence on the quality of workers in online labor markets. The Accounting Review 92(1) 93–114.
Garicano, Luis, Luis Rayo. 2017. Relational knowledge transfers. American Economic Review 107(9) 2695–2730.
Gneezy, Uri, Stephan Meier, Pedro Rey-Biel. 2011. When and why incentives (don’t) work to modify behavior. Journal of Economic Perspectives 25(4) 191–210.
Grabner, Isabella. 2014. Incentive system design in creativity-dependent firms. The Accounting Review 89(5) 1729–1750.
Grant, Adam M., James W. Berry. 2011. The necessity of others is the mother of invention: Intrinsic and prosocial motivations, perspective taking, and creativity. Academy of management journal 54(1) 73–96.
Green, Jerry R., Nancy L. Stokey. 1983. A comparison of tournaments and contracts. Journal of Political Economy 91(3) 349–364.
Harrison, Glenn W., John A. List. 2004. Field experiments. Journal of Economic Literature 42(4) 1009–1055. Kachelmeier, Steven J., Bernhard E. Reichert, Michael G. Williamson. 2008. Measuring and motivating quantity, creativity, or both. Journal of Accounting Research 46(2) 341–373.
Kachelmeier, Steven J., Laura W. Wang, Michael G. Williamson. 2019. Incentivizing the creative process: From initial quantity to eventual creativity. The Accounting Review 94(2) 249–266.
Kahney, Leander. 2004. Inside look at birth of the ipod. Wired.
Kiersz, Andy. 2008. An eminent mathematician claims to have solved one of math’s greatest mysteries — and it’s one of 6 problems with a $1 million prize. Business Insider.
Kittur, Aniket, Ed H. Chi, Bongwon Suh. 2008. Crowdsourcing user studies with mechanical turk. Proceedings of the SIGCHI conference on human factors in computing systems. 453–456.
LaViers, Lisa. 2019. The effect of pay transparency on narcissists: Can personality type predict reciprocity? Available at SSRN 3487157 .
Lazear, Edward P., Sherwin Rosen. 1981. Rank-order tournaments as optimum labor contracts. Journal of political Economy 89(5) 841–864.
Li, Shelley Xin, Tatiana Sandino. 2018. Effects of an information sharing system on employee creativity, engagement, and performance. Journal of Accounting Research 56(2) 713–747.
List, John A. 2011. Why economists should conduct field experiments and 14 tips for pulling one off. Journal of Economic perspectives 25(3) 3–16.
Mead, George Herbert. 1934. Mind, self and society, vol. 111. Chicago University of Chicago Press. Menzel, Andreas. 2017. Knowledge exchange and productivity spill-overs in bangladeshi garment factories. CERGE-EI Working Paper Series (607).
Moldovanu, Benny, Aner Sela. 2001. The optimal allocation of prizes in contests. American Economic Review 91(3) 542–558.
Morrison, Alan D., William J. Wilhelm Jr. 2004. Partnership firms, reputation, and human capital. American Economic Review 94(5) 1682–1692.
Ostermaier, Andreas, Matthias Uhl. 2020. Performance evaluation and creativity: Balancing originality and usefulness. Journal of Behavioral and Experimental Economics 101552.
Paolacci, Gabriele, Jesse Chandler, Panagiotis G. Ipeirotis. 2010. Running experiments on amazon mechanical turk. Judgment and Decision Making 5(5) 411–419.
Parker, Sharon K., Carolyn M. Axtell. 2001. Seeing another viewpoint: Antecedents and outcomes of employee perspective taking. Academy of Management Journal 44(6) 1085–1100.
Reid, Susan E., Ulrike De Brentani. 2004. The fuzzy front end of new product development for discontinuous innovations: A theoretical model. Journal of Product Innovation management 21(3) 170–184.
Ross, Joel, Lilly Irani, M. Six Silberman, Andrew Zaldivar, Bill Tomlinson. 2010. Who are the crowdworkers? shifting demographics in mechanical turk. CHI’10 Extended Abstracts on Human Factors in Computing Systems. 2863–2872.
Rossignol, Joe. 2019. ipod turns 18: Here’s what people thought in 2001. MacRumors.com.
Runco, Mark A., Garrett J. Jaeger. 2012. The standard definition of creativity. Creativity research journal 24(1) 92–96.
Sandvik, Jason J., Richard E. Saouma, Nathan T. Seegert, Christopher T. Stanton. 2020. Workplace knowledge flows. The Quarterly Journal of Economics
Sethi, Rajesh, Daniel C. Smith, C. Whan Park. 2001. Cross-functional product development teams, creativity, and the innovativeness of new consumer products. Journal of Marketing Research 38(1) 73–85.
Siegel, Ron. 2009. All-pay contests. Econometrica 77(1) 71–92.
Unsworth, Kerrie. 2001. Unpacking creativity. Academy of management review 26(2) 289–297.
Van Dijk, Christiaan, Jan Van Den Ende. 2002. Suggestion systems: transferring employee creativity into practicable ideas. R&D Management 32(5) 387–395.