
Introduction
Increasing alarm about the cost of college and the toll of student debt has led a growing chorus of voices to question the viability of the current model for the US higher education system. Some have gone so far as to raise doubts about whether college is still a sound investment. While many Americans continue to benefit from a college education, each year millions of borrowers become delinquent on their student loans, and many more struggle under the financial burden of debt payments to the point that they are unable to purchase a house, start a family, or launch a business venture. 1Federal Reserve Bank of New York, “Press Briefing on Household Debt, with Focus on Student Debt,” April 3, 2017, slide 24. Although attitudes and hiring practices have begun to shift away from treating a bachelor’s degree as an absolute necessity, a four-year degree is still seen by many as a reliable path to economic opportunity, which makes the challenge of rising costs all the more salient.
Three statistics begin to summarize the current state of higher education in America: $1.5 trillion, $20,000, and 70%. The first—$1.5 trillion—reflects the current balance of outstanding student loans, which have surpassed credit cards and auto loans to become the second largest source of household debt, behind mortgages.2Federal Reserve Bank of New York, New York Fed Consumer Credit Panel 2003–2018. Moreover, the growth of this statistic during the past 15 years, at over 300%, has far eclipsed that of any other household liability. 3 Federal Reserve Bank of New York, New York Fed Consumer Credit Panel 2003–2018, inflation-adjusted using the personal consumption expenditure index Part of the spike in student debt reflects increased enrollment, but rapidly rising tuition at four-year colleges plays a front-and-center role. Tuition at such institutions has more than doubled since the late 1980s, and now stands at approximately $20,000 per year on average.4 Integrated Postsecondary Education Data System data from the National Center for Education Statistics The last statistic—70%—represents the average wage premium recipients of a bachelor’s degree receive over people with only a high school diploma. 5Table 9.1 in Robert G. Valletta, “Recent Flattening in the Higher Education Wage Premium: Polarization, Skill Downgrading, or Both?,” in Education, Skills, and Technical Change: Implications for Future US GDP Growth, ed. Charles R. Hulten and Valerie A. Ramey (Chicago and London: University of Chicago Press, 2019). Although college degrees have always conferred a wage advantage, the average premium stood at only 40% in 1980. Thus, while college costs and debt receive disproportionate attention, a more accurate characterization of the current state of US higher education ought to take into account rising costs, debt, and labor market rewards—at least for the average graduate.
Headline statistics tell only part of the story, however, and several key challenges still confront researchers, policy makers, and the public. Perhaps the most critical issue involves determining what forces are most responsible for driving up tuition. At the moment, the relevant research is nascent and researchers have not yet reached a consensus. The extent to which financial aid may be contributing to higher tuition stands out as one of the most important policy quandaries. On one hand, if colleges set tuition independently of students’ ability to pay, then financial aid (in the form of grants, loans, work-study opportunities, or some mix of programs) may be an effective method to expand access to the economic opportunity that college attainment provides. On the other hand, if colleges increase tuition in response to students’ ability to pay, then financial aid may serve more as a subsidy to the institutions than as a bona fide source of assistance to students and their families. Apart from financial aid, others have flagged lagging state support for higher education as another potential culprit behind rising tuition, which, if true, may become more salient over time as states struggle to fund competing priorities such as Medicaid, K-12 education, and infrastructure.
Then there’s the issue of the returns to college enrollment and attainment. Although a simple comparison of college graduates those with only a high school diploma reveals a large wage premium for the former, part of this differential is attributable to higher-ability youth self-selecting into college attendance when they could plausibly have received high pay in any number of occupations that do not require a college degree. Whether the observed financial return to college is an indication that colleges provide marketable skills or whether it is just a credential that signals the graduates’ innate ability matters greatly for deciding optimal policy. That is to say, if college degrees serve only as a signal, then efforts to expand enrollment are counterproductive, whereas if college attendance is a form of investment in valuable human capital, positive spillovers may result from expansion.
Even under optimistic scenarios for the expected return to college, there is still significant uncertainty about the realized rate of return for different students, owing to the presence of risk both during and after college. At the front end, nearly 40% of students who enroll in four-year institutions do not go on to graduate—they drop out, either of their own volition or because they fail academically. Although college attendance provides some economic benefits even without graduation, there is a sizable “sheepskin effect” whereby wages jump upon receipt of the degree.6See James J. Heckman, Lance J. Lochner, and Petra E. Todd, “Earnings Functions and Rates of Return,” Journal of Human Capital 2, no. 1 (2008): 1–31. Students who succeed in obtaining a bachelor’s degree still experience considerable variation in labor market outcomes based on their choices of institution, major, and occupation—and on the state of the economy at the time of their graduation, over which they obviously have no control. Given these considerable sources of risk, students’ reliance on debt to finance college can be problematic, because it saddles graduates and dropouts alike with a stream of payment obligations regardless of their economic fortunes. Uncovering the consequences of student debt for the economy is an ongoing task for researchers, as is developing potential ideas for reforms.
This paper discusses some of the most relevant trends in higher education costs, financing, and returns, as well as research that attempts to explain such trends. It then assesses the likely impact of various reform proposals. Such proposals range from modest changes to the existing policy landscape to more sweeping overhauls aimed at fundamentally altering the structure of the higher education market and the role of government.
2. The Rise in College Tuition: Trends and Perspectives
Statistics for the average costs and benefits of college gloss over the wide range of experiences of students with different family backgrounds, academic preparation, and choices of institution and major. While $20,000 is the average sticker price tuition across all US four-year colleges, tuition varies tremendously by institution. For example, figure 1 shows that, as of 2018, most students at public colleges attend institutions with published tuition and fees that amount to less than $15,000, whereas a large fraction of students at private colleges are charged more than $50,000.
Figure 1. Distribution of Undergraduate Students by Published Tuition and Fees, 2018.
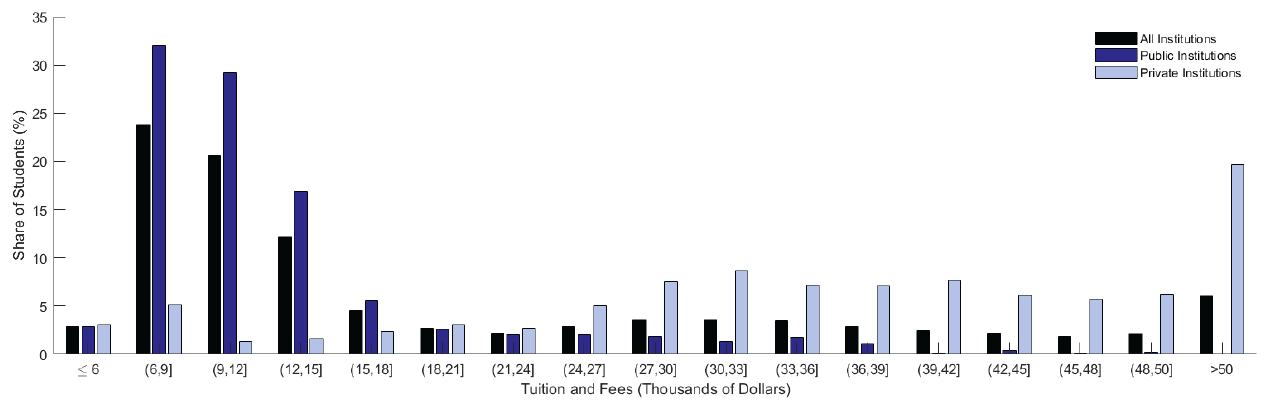
Source: College Board, Trends in College Pricing 2018, Trends in Higher Education Series, 2018.
Figure 2. Tuition at Four-Year Colleges.
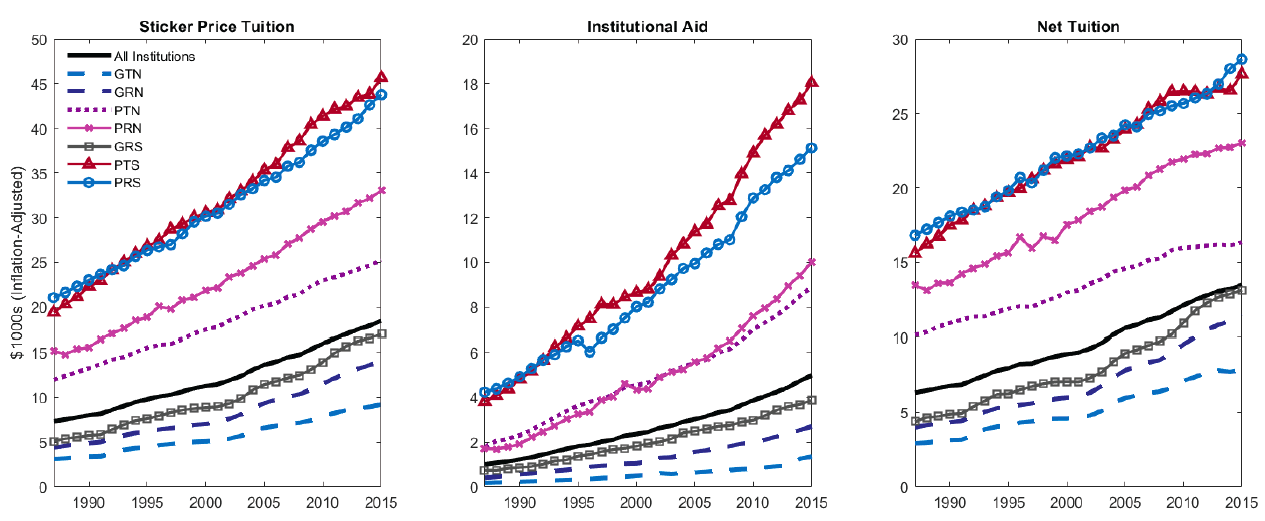
Note: G = public, P = private; T = teaching-focused, R = research-focused; N = nonselective, S = selective.
Source: Integrated Postsecondary Education Data System.
Digging deeper into college pricing, figure 2 shows the behavior of multiple measures of tuition based on whether a college is public or private (G vs. P), teaching-focused or research-focused (T vs. R), and nonselective or selective (N vs. S).7Research-focused universities are designated as such based on their Carnegie classification. Schools are classified as selective if the average SAT (or ACT converted into SAT) score exceeds 1250. Sticker price tuition often garners the most public attention, but it is an inaccurate measure of the financial burden on students, their families, or even taxpayers. Unlike in most other sectors of the economy, where the businesses setting prices have little direct knowledge about the financial well-being of specific customers, thanks to the financial aid application process colleges receive detailed information about the income and assets of each student’s family. This allows colleges to charge different prices to different families based on each family’s estimated ability to pay. Naturally, colleges do not advertise the fact that they set prices this way. Instead, functionally, each college sets a uniform tuition price and then offers institutional need-based and merit-based discounts that lower the effective price for specific individuals. For all intents and purposes, however, this practice is just price discrimination—greatly facilitated by the financial information provided on the standard government FAFSA (Free Application for Federal Student Aid) form. To provide a sense of scale, the middle panel of figure 2 shows that the average amount of institutional discounting is approximately $5,000 per year, though it ranges from less than $2,000 for nonselective, teaching-focused public colleges to nearly $20,000 for selective, teaching-focused private colleges. Thus, on balance, even though sticker price tuition has risen by nearly $25,000 since the late 1980s for selective private schools, the net tuition these schools charge to students has risen by just over $10,000. Although tuition has increased by the most in absolute dollar amounts at private colleges, in-state and out-of-state tuition at flagship public universities has increased substantially in relative terms. However, just as before, in-state and out-of-state sticker price tuition are misleading indicators of the net prices students pay.
The evidence thus far indicates that, even after accounting for price discrimination and differences among states and college types, the rise in net tuition is a broad-based phenomenon. Thus, the natural next question is this: Why has college become so much more expensive? Researchers have not yet reached a consensus about the culprit. Instead, some scholars have made the case that what is occurring in higher education is just a manifestation of rising prices in service sectors more broadly. By contrast, others have proposed explanations that emphasize the unique pathologies present in higher education.
2.1 Baumol’s Cost Disease
In the first camp are economists Robert Archibald and David Feldman, who ascribe to the theory that college tuition is just an example of Baumol’s cost disease.8A comprehensive elucidation of Archibald and Feldman’s position can be found in their book, Why Does College Cost So Much? (New York: Oxford University Press, 2014). Described by William Baumol and William Bowen in the 1960s, cost disease emerges when economic growth drives up wages in the economy as a whole but a certain sector experiences stagnant productivity. In such a scenario, the stagnant sector must still offer competitive wages, but because the higher wages are not offset by greater productivity, the stagnant sector must raise prices. In the words of economists John Jones and Fang Yang, who also subscribe to this rationale for rising tuition, “As college professors and administrators become more productive in other sectors, their wages, and the cost of college education, will rise.”9 Jones, John and Yang, Fang, “Skill-biased Technical Change and the Cost of Higher Education,” 2016, Journal of Labor Economics, Vol. 34(3), pp. 621 – 62. In the context of higher education, faculty-student ratios and administrator-student ratios are potential measures of productivity. However, institution-level data from the Integrated Postsecondary Education Data System do not reveal much of a correlation between net tuition and changes in either ratio. A more direct test of the cost disease mechanism examines the relationship between faculty compensation and net tuition. However, the data from the Integrated Postsecondary Education Data System again show that changes in faculty pay have little predictive power for net tuition, except at some public research universities. Of course, just as correlation does not imply causation, lack of correlation does not necessarily imply an absence of causation. A more extensive empirical analysis is required before researchers can reach stronger conclusions. In sum, while these correlations are far from a comprehensive rebuttal of cost disease as a driver of tuition, they do suggest that other factors may be important for explaining tuition increases.
2.2 Public Subsidies: What the Government Giveth, the Government Taketh Away?
Another prominent explanation for the steep rise in tuition at public colleges blames it on an erosion of direct funding support from state governments over the past three decades. From a theoretical perspective, proponents of this explanation argue that public colleges are forced to “make up” for lost state funding by seeking revenue from other sources—namely, from students and their families in the form of higher tuition. If the typical college were a profit-maximizing entity, this line of thinking would defy basic economic principles, because if a college could increase profits simply by raising prices (i.e., if student demand would not substantially decrease), then the college would not need to use a cut in state funding as an excuse to do so. However, given that the typical student attends a nonprofit college, it is plausible that a college with spending commitments set in the past (i.e., tenured faculty and building construction) might behave in such a manner. Thus, assessing the link between state funding and tuition becomes an empirical matter.
Before delving into the academic literature, it is worth noting that there is little correlation in the data between changes in total state support and net tuition at public colleges over the past few decades. Figure 3 plots changes in both variables from 2002 to 2015. However, the fact that colleges partly substitute out-of-state students for in-state students acts as a confounding factor. In particular, while the relationship between net tuition revenue and state support is almost nonexistent, state funding cuts are predictive of larger hikes to in-state tuition among some public institutions. Declines in state support are associated with more modest changes to out-of-state tuition, indicating that colleges may attempt to recruit students from beyond their state’s borders, who tend to pay a higher price than state residents.
Figure 3. Net Tuition vs. State Appropriations.
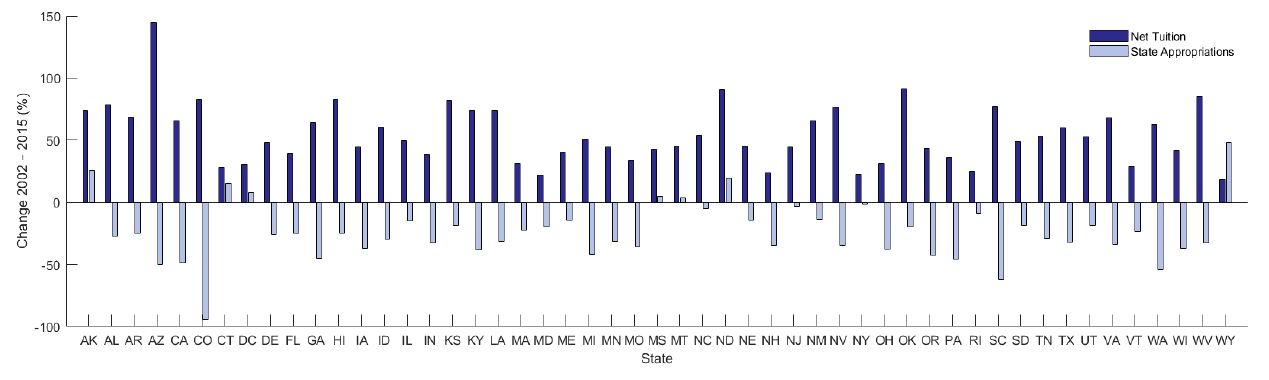
Source: Integrated Postsecondary Education Data System.
One potential dilemma with using total state support to measure the impact of public investment on college tuition is that total support includes earmarked grants and contracts that can only be spent for specific purposes. Shifting attention to unconstrained funding, inflation-adjusted state appropriations have declined since the year 2000 at public institutions, even as grants and contracts have mostly picked up the slack. Arizona, California, Colorado, and a handful of other states stand out for having implemented particularly sharp appropriations cuts, and only a few states chose to go the opposite direction. Even so, the data reveal little relationship between appropriations cuts and rising net tuition.
Despite painstaking efforts to control for confounding factors, the academic literature, too, has delivered a mixed verdict on the relationship between state funding and college tuition. For example, multiple studies find that greater state support is associated with lower tuition paid by students.10 See Donald E. Heller, “The Effects of Tuition and State Financial Aid on Public College Enrollment,” Review of Higher Education 23, no. 1 (1999): 65–89; Rajindar K. Koshal and Manjulika Koshal, “State Appropriation and Higher Education Tuition: What Is the Relationship?,” Education Economics 8, no. 1 (2000); and Alisa F. Cunningham et al., “Study of College Costs and Prices, 1988–89 to 1997–98,” vol. 1 (Report 2002-157, National Center for Education Statistics, 2001). However, other research finds that the relationship holds up only over short time horizons. 11See Marvin A. Titus, Sean Simone, and Anubha Gupta, “Investigating State Appropriations and Net Tuition Revenue for Public Higher Education: A Vector Error Correction Modeling Approach” (working paper, 2010). Other academic work finds support for the conceptual link between less state support and higher tuition but concludes that, overall, total inflation-adjusted state support has proved relatively stable rather than exhibiting a sharp decline.12See Grey Gordon and Aaron Hedlund, “Accounting for the Rise in College Tuition,” in Education, Skills, and Technical Change: Implications for Future US GDP Growth, ed. Charles R. Hulten and Valerie A. Ramey (Chicago and London: University of Chicago Press, 2019).
2.3 Bowen’s Revenue Theory of Costs and Mission Creep
Economist-turned-university-president Howard Bowen put forward his own explanation for why college tuition has tended to persistently outpace inflation. 13 His “revenue theory of costs” posits that colleges pursue fundamentally different objectives than for-profit companies and other nonprofit entities, with four pillars forming the basis for college decision-making: (1) the main goal of higher education institutions is the pursuit of excellence, prestige, and influence; (2) there is no limit to the amount of money an institution can spend to advance this goal; (3) each institution raises all the money it can; and (4) each institution spends all that it raises. As a corollary to Bowen’s hypothesis, colleges may be prone to mission creep whereby they expand the scope of activities over which they seek to establish their preeminence. Some commentators have criticized what they call lavish spending on administrators, athletics, and student amenities that may fall outside the traditional scope or mission of higher education. For example, economist Richard Vedder has criticized universities for shifting away from their core mission of teaching.13See Richard Vedder, Going Broke by Degree: Why College Costs Too Much (Washington, DC: American Enterprise Institute Press, 2004).
Figure 4. Components of Education and General Expenditures.
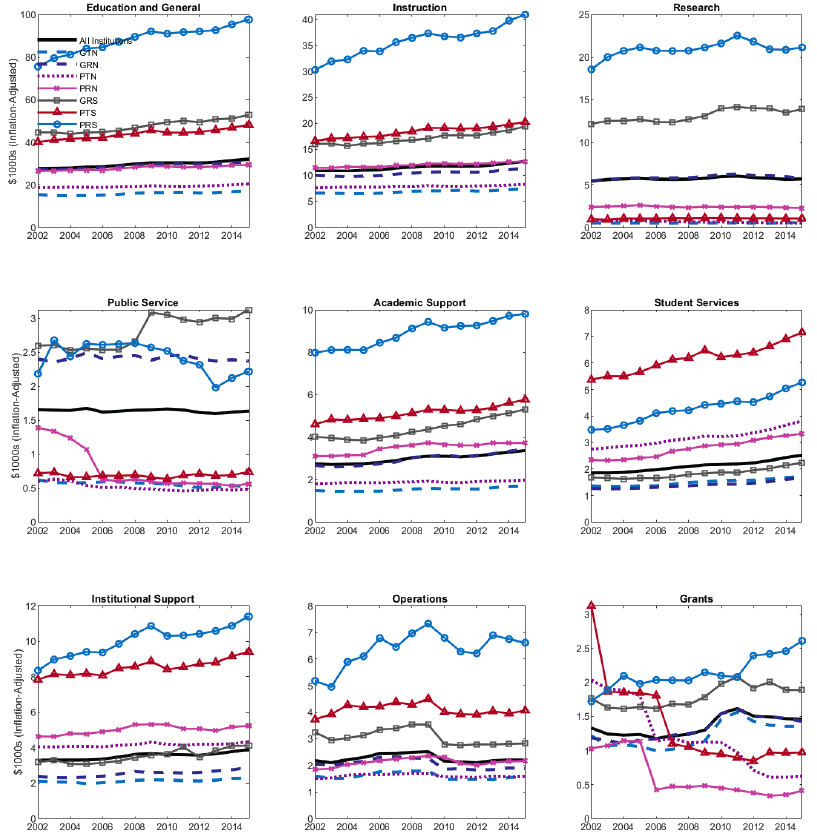
Note: G = public, P = private; T = teaching-focused, R = research-focused; N = nonselective, S = selective.
Source: Integrated Postsecondary Education Data System.
To establish basic facts about what colleges prioritize financially, figure 4 decomposes total education and general expenditures since 2002. 14 Changes in accounting rules make comparisons with earlier years more challenging Across all types of four-year institutions, instruction is easily the largest single spending component, as one might expect. Research is the second-largest source of spending at research-intensive institutions (both private and public), but it accounts for a much smaller fraction of spending at teaching-focused colleges. Most other spending components have generally remained flat or even declined, except at research-focused and selective private colleges, where spending has grown virtually across the board. One notable exception is rising spending on student services, “whose primary purpose is to contribute to students’ emotional and physical well-being and to their intellectual, cultural, and social development outside the context of the formal instructional program.”15 Data dictionary for Delta Cost Project, which is released by the American Institutes for Research Even so, instruction’s share of total education and general spending has remained remarkably stable: figure 5 indicates a 36% share in 2000 and a 38% share in 2015. The overall research share, too, has stayed constant at 17% of spending.
Figure 5. Spending Shares by Type of Four-Year Institution.
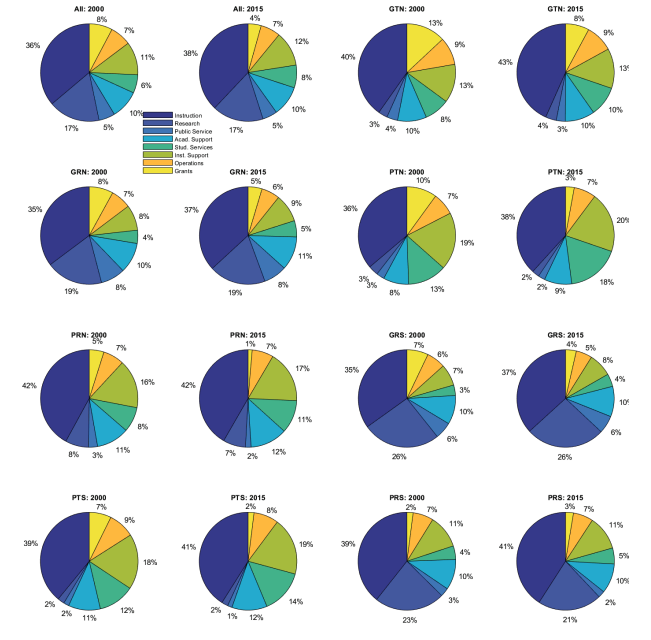 Note: G = public, P = private; T = teaching-focused, R = research-focused; N = nonselective, S = selective.
Source: Integrated Postsecondary Education Data System.
The data reveal a strong correlation between rising tuition and higher total education and general spending since the first few years after 2000. In terms of spending categories, the strongest predictor of tuition hikes is increased spending on instruction, followed by spending on academic support, student services, and institutional support. Expenditures on public service and operations, however, exhibit little relationship with rising net tuition over the past two decades. The data also reveal that growing student services spending exhibits a strong association with tuition increases only at public colleges.
Recent research finds that four-year institutions on average spend nearly $0.51 on consumption amenities for every $1 spent on academics, but that, looking across colleges, this ratio ranges from $0.26 at the 10th percentile and $0.80 at the 90th percentile. 16 Brian Jacob, Brian McCall, and Kevin Stange, “College as Country Club: Do Colleges Cater to Students’ Preferences for Consumption?,” Journal of Labor Economics 36, no. 2 (2018): 309–48. More importantly, the same study investigates the extent to which such increased spending is driven by the perceived necessity to provide amenities to effectively recruit students. The authors find that student preferences vary tremendously based on their academic and family backgrounds: only high-achieving students place a premium on academic quality, while most other students value amenities. In short, the study finds that “higher education institutions do respond to the demand pressure they face along this important non-price dimension.”17Jacob, McCall, and Stange, “College as Country Club,” _p. 311.
These results suggest that, from the institution’s perspective, amenities spending cannot be considered purely “wasteful”—because such spending helps attract students, regardless of whether it improves educational outcomes. Naturally, the willingness of students and families to pay higher tuition to receive amenities depends both on their financial capacity to do so (arising from their income and from their ability to borrow) and on the value they place on such amenities. One view is that such noninstructional spending is purely a form of consumption, although some studies find that this is not the case. In particular, multiple studies find that student services expenditures are a strong determinant of graduation probabilities for students with low college admissions test scores, whereas instructional spending matters more for high-achieving students and for students who major in a STEM field.18See Douglas A. Webber and Ronald G. Ehrenberg, “Do Expenditures Other Than Instructional Expenditures Affect Graduation and Persistence Rates in Higher Education?,” Economics of Education Review 29 (2010): 947–58; and Douglas A. Webber, “Expenditures and Postsecondary Graduation: An Investigation Using Individual-Level Data from the State of Ohio,” Economics of Education Review 31 (2012): 615–18. In other words, some nonacademic spending may not be appropriately labeled as spending for “amenities” but rather as spending for services that complement direct instructional resources.
2.4 Financial Aid and the Bennett Hypothesis
Although financial aid is typically understood as a way to help pay for rising tuition, it may also be contributing to higher prices. This hypothesis was dubbed the “Bennett hypothesis” after then secretary of education William Bennett espoused it in a February 2, 1987 New York Times op-ed titled “Our Greedy Colleges.” It asserts that colleges—perhaps acting in accordance with Bowen’s revenue theory of costs— take advantage of the fact that financial aid enhances students’ ability to pay by raising tuition to capture some of the aid. Indeed, figure 6 shows that total financial aid in the form of grants, loans, and tax benefits has climbed in tandem with tuition over the past three decades.
Figure 6. Financial Aid Trends.
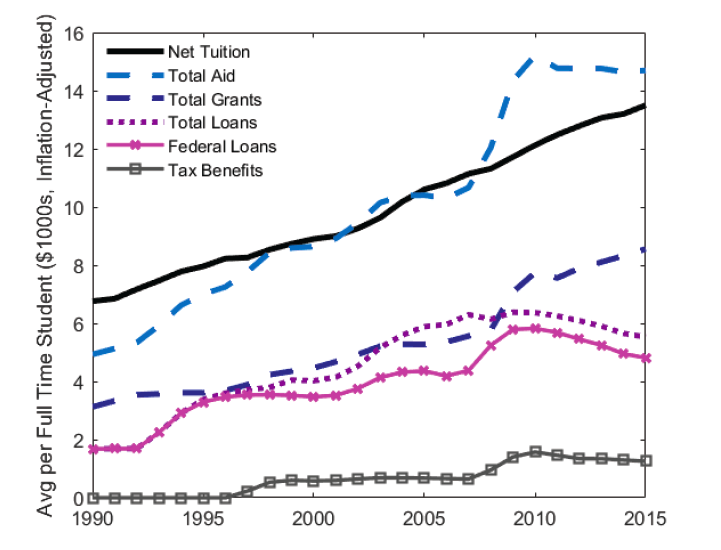
Sources: Integrated Postsecondary Education Data System; College Board, Trends in Student Aid 2018, Trends in Higher Education Series, 2018.
The increase in aid has occurred across all institution types, though not uniformly. For example, the top row of figure 7 reveals that the percentage of students receiving federal grant aid changed little during the decade between 2000 and 2010, but students at public colleges increasingly received state grants and loans. Moreover, the average value of grants increased by more than $2,000 per student during that decade, with student loans increasing by even more.
Figure 7. Financial Aid by Type of Institution.
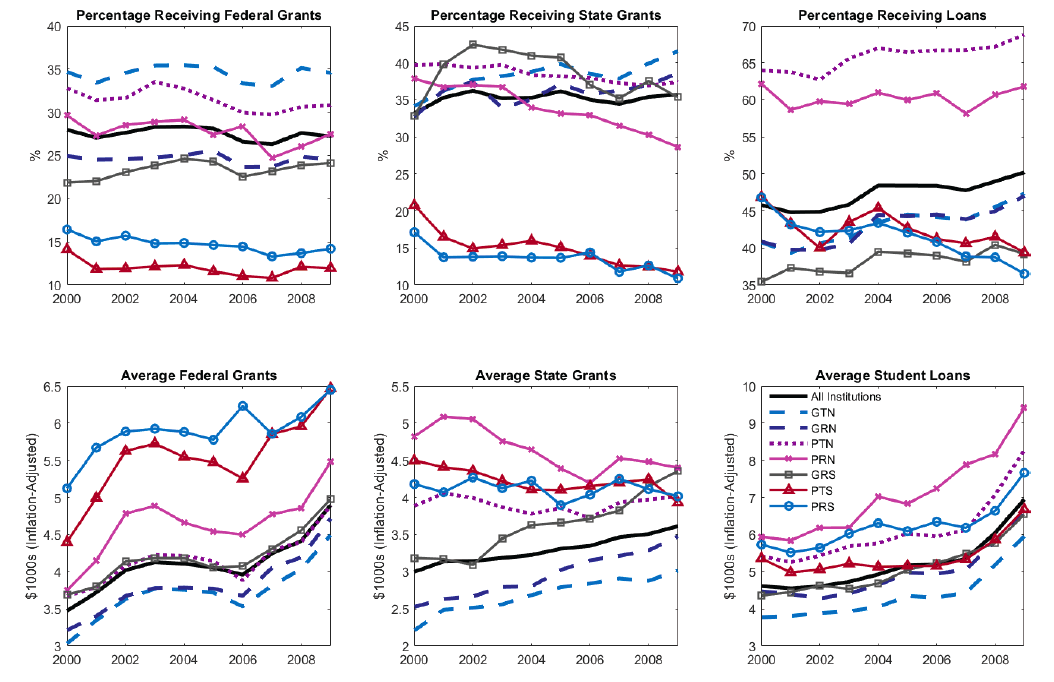
Note: G = public, P = private; T = teaching-focused, R = research-focused; N = nonselective, S = selective.
Source: Integrated Postsecondary Education Data System.
The academic literature thus far has found mixed and at times conflicting effects of financial aid expansions on tuition. For example, one study estimates that a 10% increase in the size of maximum Pell Grants leads institutions to raise in-state tuition by 4.8%, which amounts to tuition that is $58 higher for every $100 in Pell increases.19See Michael J. Rizzo and Ronald G. Ehrenberg, “Resident and Nonresident Tuition and Enrollment at Flagship State Universities,” in College Choices: The Economics of Where to Go, When to Go, and How to Pay for It, ed. Caroline H. Hoxby (Chicago and London: University of Chicago Press, 2004). The study’s authors find that higher maximum Pell Grant awards have no such effect on out-of-state tuition. By contrast, a different study comes to the opposite conclusion, finding that out-of-state tuition rises by $804 per $1,000 increase in the average Pell Grant award, while tuition at private universities rises by $864.20 See Larry D. Singell and Joe A. Stone, “For Whom the Pell Tolls: The Response of University Tuition to Federal Grants-in-Aid,” Economics of Education Review 26, no. 3 (2007): 285–95. Another study finds a nearly $1 increase in net tuition (via reductions in institutional aid) for every additional $1 of tax-based aid.21 See Nicholas Turner, “Who Benefits from Student Aid? The Economic Incidence of Tax-Based Federal Student Aid,” Economics of Education Review 31, no. 4 (2012): 463–81. Multiple recently published studies also find large pass-through of federal student loans to tuition. Quantitatively, one of these studies finds that $0.60 of every $1 in subsidized lending and $0.20 of every $1 in unsubsidized student loans gets passed through into higher tuition.22See David O. Lucca, Taylor Nadauld, and Karen Shen, “Credit Supply and the Rise in College Tuition: Evidence from the Expansion in Federal Student Aid Programs,” Review of Financial Studies 32, no. 2 (2018): 423–66. Separate evidence indicates that the effects may be even larger at for-profit schools.23See Stephanie Riegg Cellini and Claudia Goldin, “Does Federal Student Aid Raise Tuition? New Evidence on For-Profit Colleges,” American Economic Journal: Economic Policy 6, no. 4 (2014): 174–206. In another study, 42% of the entire increase in net tuition from 1987 to 2010 can be attributed to student loan policy changes, chiefly the introduction of unsubsidized loans in 1992, which greatly increased total loan limits.24 See Gordon and Hedlund, “Accounting for the Rise.” At the state level, economists have estimated the impact of the introduction of Georgia’s HOPE scholarship in 1993. This scholarship pays for full tuition and fees for Georgia students with at least a B average who are attending an in-state public college. The evidence indicates that colleges responded to the policy by raising tuition by as much as $0.30 for every $1 of scholarship money. 25 See Long, Bridget Terry, “How do Financial Aid Policies Affect Colleges?” Journal of Human Resources, Vol. 39(4), pp. 1045 – 1066 In contrast to the previous findings, a commissioned report for the 1998 reauthorization of the Higher Education Act concludes that “the models found no associations between most of the aid variables and changes in tuition in either the public or private not-for-profit sectors.”27
2.5 Labor Market Trends
Each of the previous theories attempting to explain rising tuition emphasizes some form of malady, whether policy-induced (e.g., the unintended consequences of student aid) or associated with dysfunction in the higher education system itself (e.g., stagnant productivity and lack of cost consciousness). However, rising prices must reflect both an increased ability to pay and an increased willingness to pay, not just the former. Recent research indicates that labor market trends may be another potent force behind rising college costs. In particular, one study finds that the increasing earnings gap between workers with and without college degrees has been fueling college demand and may account for more than one-fifth of the total increase in net tuition between 1987 and 2010.26 See Gordon and Hedlund, “Accounting for the Rise.” A separate study attributes a significant fraction of the rise in net tuition to faster income growth among high earners, who constitute a disproportionate fraction of the demand for higher education.27 See Zhifeng Cai and Jonathan Heathcote, “College Tuition and Income Inequality” (working paper, 2018).
3. Overrated or Essential? Assessing the Benefits of College
Missing from an exclusive focus on costs is a discussion of the potential benefits to obtaining a college degree. Indeed, a wealth of empirical evidence demonstrates that the private economic gains from obtaining a college degree have risen dramatically over the past few decades. For example, data from the Census Bureau indicate that bachelor’s degree holders aged 25 and older have an average income of over $61,000, compared to less than $37,000 for those with only a high school diploma.28 See figure 2.7 in Jennifer Ma, Matea Pender, and Meredith Welch, Education Pays 2016: The Benefits of Higher Education for Individuals and Society, Trends in Higher Education Series (College Board, 2016), 17. Moreover, the college graduate unemployment rate is consistently below that of high school graduates with no college degree. However, simple averages do not give an accurate representation of the returns to college because they do not account for other underlying differences—such as worker ability—that influence labor outcomes. For a high schooler considering college, the appropriate calculation is to compare how college attendance would change his or her available choices in life and to weigh those opportunity gains against the cost of attendance. The trade-offs become even more difficult for policy makers, who must distinguish between the private and social benefits of college and between the average and marginal returns, and who must grapple with the fact that the returns to a college degree vary significantly by major and institution. This section discusses several of these issues.
3.1 College as a Hedge against Labor Market Risk
Before delving into the issue of wages, it is important to note that college graduates are more likely to successfully get a job to begin with and to remain employed during downturns. Looking across different recessions, college graduates experienced an increase in unemployment only 42% as large as that of the overall population during the 1981–82 and 1990–91 recessions. 29 See table 1 in Michael W. Elsby, Bart Hobijn, and Aysegul Sahin, “The Labor Market in the Great Recession” (Brookings Papers on Economic Activity, Spring 2010). Their increase in unemployment was 73% as large as that of the overall population during the 2001 recession and 53% as large during the Great Recession of 2007–9. Other research also finds that the impacts of the labor market decline during the Great Recession were felt most strongly by less-educated workers.30See Hilary Hoynes, Douglas L. Miller, and Jessamyn Schaller, “Who Suffers during Recession?,” Journal of Economic Perspectives 26, no. 3 (2012): 27–48. During the period from 1976 to 2009, college graduates had a 2.6% unemployment rate, compared to 5.4% for high school graduates with no college degree and nearly 9% for high school dropouts.31See table 1 in Michael W. Elsby, Bart Hobijn, and Aysegul Sahin, “The Labor Market in the Great Recession” (Brookings Papers on Economic Activity, Spring 2010). Research that separately analyzes the flows into and out of unemployment indicates that changes in the job-finding rate are fairly uniform across educational groups and vary markedly with the business cycle, whereas the risk of job loss falls disproportionately on workers with less education. Specifically, since 1980, workers with bachelor’s degrees or higher degrees transition into unemployment at less than half the rate of high school graduates with no college degree and less than one-quarter the rate of workers who did not complete high school.32See figure 8 in Elsby, Hobijn, and Sahin, “Labor Market in the Great Recession.”
3.2 The Average College Wage Premium
The data in figure 8 show that the wage premium associated with having a college degree is higher now than it has ever been before, having risen from 50% in the early 1980s to nearly 200% by the late 2000s. 33See David H. Autor, Lawrence F. Katz, and Melissa S. Kearney, “Trends in U.S. Wage Inequality: Revising the Revisionists,” Review of Economics and Statistics 90, no. 2 (2008): 300–323. Taking into account college costs, an analysis by Nobel Prize winner James Heckman and coauthors Lance Lochner and Petra Todd finds that the rate of return to college relative to high school but no college degree rose by 45% for black men and 60% for white men between 1980 and 2000.34 See table 3 in Heckman, Lochner, and Todd, “Earnings Functions and Rates of Return.” Another study reports that, between 1980 and 2008, the gap in lifetime earnings between college graduates and high school graduates with no college degree rose by $300,000 for men and $200,000 for women after subtracting the costs of college.35See Christopher Avery and Sarah Turner, “Student Loans: Do College Students Borrow Too Much—or Not Enough?,” Journal of Economic Perspectives 26, no. 1 (2012): 165–92. As a cautionary point, however, recent empirical evidence finds that the college wage premium is no longer growing at the rate it once was. In fact, one study concludes that the college wage premium almost completely stagnated between 2010 and 2015 despite the increasing tuition and student debt. The authors attribute this in large part to skill downgrading and heightened competition between educational groups for similar jobs.36Valletta, “Recent Flattening.”
Figure 8. College Wage Premium.
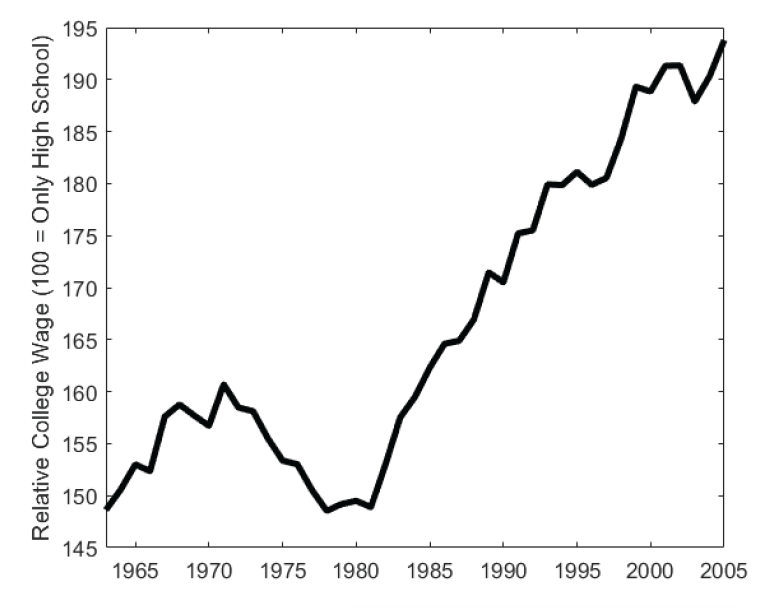
Source: David H. Autor, Lawrence F. Katz, and Melissa S. Kearney, “Trends in U.S. Wage Inequality: Revising the Revisionists,” Review of Economics and Statistics 90, no. 2 (2008): 300–323.
Given these large monetary rewards to college degree attainment, it is natural to wonder why more people do not attend college. There are several potential reasons. First, studies have found that there are large psychic costs (e.g., stress) to attending college, which are sufficient to dissuade some students from attending.37See James J. Heckman, Lance J. Lochner, and Petra E. Todd, “Earnings Functions, Rates of Return and Treatment Effects: The Mincer Equation and Beyond,” Handbook of the Economics of Education 1 (2006): 307–457. Second, some students may wish to attend college but face financial obstacles to doing so. (This will be discussed in depth later in this paper.) Third, the economic returns to a college degree vary greatly by field of study and quality of institution. Lastly, students may not have adequate academic preparation to succeed in college. This point is particularly important in light of evidence that the college wage premium for workers with some college attendance but no degree is unchanged over the past 30 years.38 Jonathan James, “The College Wage Premium” (Economic Commentary 2012-10, Federal Reserve Bank of Cleveland, 2012). In this regard, the return to college attendance is distinct from the return to a degree, which only accrues to those who successfully complete college.
3.3 Returns by Major
The monetary returns to college vary greatly by major. For instance, economics and engineering majors earn more than twice as much as the typical high school graduate with no college degree, but education and English majors only earn between 20% and 50% more.39Figures 4 and 5 in James, “College Wage Premium.” To give perspective, the gap in wages between male electrical engineering majors and male general education majors is almost as large as the overall wage gap between college graduates and high school graduates with no college degree. 40Joseph G. Altonji, Erica Blom, and Costas Meghir, “Heterogeneity in Human Capital Investments: High School Curriculum, College Major, and Careers,” Annual Review of Economics 4 (2012): 185–223. However, simply measuring the wage premium is not a proper way to identify the return to each possible field of study. For one thing, part of the wage premium is compensation for underlying worker ability, with higher-ability students more likely to enroll in difficult majors. That said, one analysis that isolates the value-added component of each major finds significant variation in monetary returns even after taking into account sorting by ability.41See Peter Arcidiacono, “Ability Sorting and the Returns to College,” Journal of Econometrics 121 (2004): 343–75. The study also concludes that students’ choice of major is driven mostly by preferences for subjects or types of work rather than by an assessment of future wage prospects.
Another confounding issue pertains to how one calculates costs when determining the net return to a specific field of study. Most institutions charge uniform tuition regardless of a student’s choice of major, even though there are significant cost differences across fields. One study has recently calculated net returns by major, with the measure of costs being the resources spent by the college to provide the degree rather than the uniform tuition paid by each student. The authors show that, although engineering degrees tend to lead to high earnings, the high cost of producing the degree greatly reduces its net return.42 Joseph G. Altonji and Seth D. Zimmerman, “The Costs of and Net Returns to College Major” (working paper, 2018). By contrast, business degrees offer high net returns because they tend to also lead to high earnings but are lower cost to provide. In light of these significant cost differences, the authors question the efficiency of uniform tuition practices that cross-subsidize different fields of study. Moreover, the decision to designate certain fields as high priorities—as is frequently the case for STEM majors—should take into account production costs and not just future wage gains.
3.4 Returns and College Quality
The previous results establish that there is no such thing as “the” return to college. Rather, there is a distribution of outcomes that depends on a range of factors, such as college major and college quality. 43 A good review is Caroline Hoxby, “The Changing Selectivity of American Colleges,” Journal of Economic Perspectives 23, no. 4 (2009): 95–118. For example, one study finds that students who attend a flagship state university earn 20% more than those who do not.44See Mark Hoekstra, “The Effect of Attending the Flagship State University on Earnings: A Discontinuity-Based Approach,” Review of Economics and Statistics 91, no. 4 (2009): 717–24. Other research finds that students coming from an elite public or private school earn 26%–39% more than those with degrees from lower-ranked schools.45 See Dominik Brewer, Eric Eide, and Ronald Ehrenberg, “Does It Pay to Attend an Elite Private College? Cross-Cohort Evidence on the Effects of College Type on Earnings,” Journal of Human Resources 34, no. 1 (1999): 104–23. However, the direct effect of college quality has been questioned by separate studies, which show that otherwise-similar students who chose to attend different institutions ended up with similar earnings, indicating that college quality loses its predictive power after student ability is taken into account.46 See Stacey B. Dale and Alan B. Krueger, “Estimating the Payoff to Attending a More Selective College: An Application of Selection on Observables and Unobservables,” Quarterly Journal of Economics 117, no. 4 (2002): 1491–527; and Stacey B. Dale and Alan B. Krueger, “Estimating the Return to College Selectivity over the Career Using Administrative Earnings Data,” Journal of Human Resources 49, no. 2 (2014): 323–58. However, even these studies find that the effects of institution quality remain powerful for certain subgroups, such as black and Hispanic students. In other words, to truly assess the role of institution quality, it is important to examine the entire distribution of outcomes experienced by college graduates.
One recent study undertakes this exercise using administrative data from Texas to measure the distribution of earnings premiums by college category—specifically, flagship universities vs. non-flagship universities vs. two-year schools. 47See Rodney J. Andrews, Jing Li, and Michael F. Lovenheim, “Quantile Treatment Effects of College Quality on Earnings: Evidence from Administrative Data in Texas” (NBER Working Paper No. 18068, National Bureau of Economic Research, Cambridge, MA, 2018). Several findings emerge from the authors’ analysis. Based on differences in the patterns observed for graduates of the University of Texas at Austin and of Texas A&M University, the authors conclude that the return to institution quality may depend significantly on college major choice. The study also finds that the returns to attending a non-flagship, four-year institution over a community college are quite small for many students, despite the large cost differences. Another recent study that takes advantage of employment records data examines the impact of a program in California that guaranteed University of California admission to students in the top 4% of California high school classes. The study finds that this program caused some students to enroll in a University of California system who otherwise would have attended a less-selective public institution.48 See Zachary Bleemer, “The Effect of Selective Public Research University Enrollment: Evidence from California” (working paper, 2018). Moreover, this switch in attendance toward a higher-quality college increased the probability of graduation by over 20 percentage points and substantially raised average early-career earnings.
3.5 Preparedness, Dropout Risk, and the Difference between Average and Marginal Return
Although a college degree typically confers significant labor market advantages, more than 40% of students who enroll in college never graduate. Figure 9 reveals wide differences across institutions: At the bottom end, nonselective, teaching-focused public colleges have graduation rates below 50%, whereas selective private institutions graduate nearly all students who enroll. While college dropouts still earn more than workers with zero college attendance, the wage premium is smaller and the students are still saddled with whatever debt they may have accumulated while in school. Thus, for students contemplating enrolling in college, the proper notion of the returns they should expect to receive must take into account the risk of dropping out.
Figure 9. College Graduation Rates.
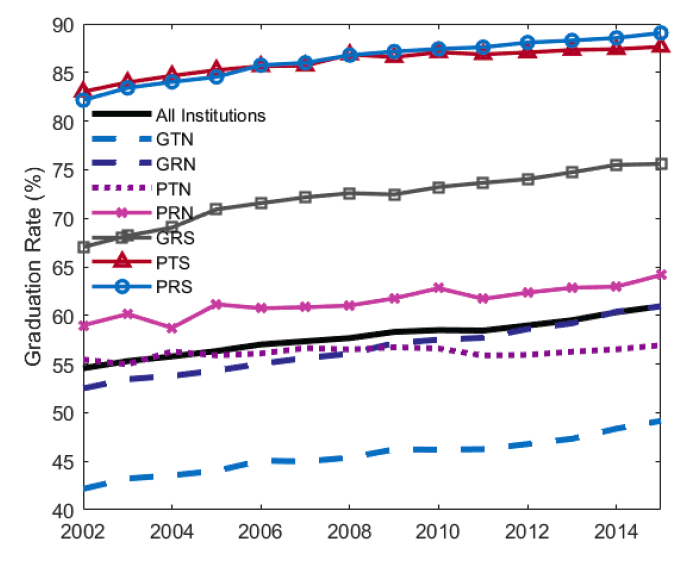
Note: G = public, P = private; T = teaching-focused, R = research-focused; N = nonselective, S = selective.
Source: Integrated Postsecondary Education Data System.
Compounding matters, recent research finds that the marginal student—that is, someone who is not currently enrolled in college but would enroll if the wage premium increased further—is significantly less academically prepared to successfully complete college. Thus, the average and marginal returns to college enrollment differ substantially, and efforts to increase enrollment may not translate into greater college attainment.49 See Kartik Athreya and Janice Eberly, “Risk, the College Premium, and Aggregate Human Capital Investment” (working paper, 2018). Furthermore, the risk of dropping out is not a pure unknown risk: recent research finds that some students enroll in college even with the knowledge that their likelihood of success is low.50 See Lutz Hendricks and Oksana Leukhina, “The Return to College: Selection and Dropout Risk,” International Economic Review 59, no. 3 (2018): 1077–102. The importance of academic preparation has been investigated extensively in another study, which points out that, although college attendance grew the most between 1995 and 2015 among students from less welloff families, actual completion grew the most among students from high-resource families. To explain this divergence, the authors show that high-resource parents have been more responsive than low-resource parents to the growing college premium by raising pre-college investments in their children.51Adam Blandin and Christopher Herrington, “Family Structure, Human Capital Investment, and Aggregate College Attainment” (working paper, 2019). This finding is in line with other research that establishes a growing gap in ability between college-educated workers and workers who have graduated from high school but not college, a gap that accounts for nearly one-half of the college premium.52Lutz Hendricks and Todd Schoellman, “Student Abilities during the Expansion of US Education,” Journal of Monetary Economics 63 (2014): 19–36. Other research arrives at a similar result, attributing 59% of the lifetime earnings premium associated with college graduation to differences in ability.53Hendricks and Leukhina, “Return to College.”
3.6 Private vs. Social Returns and the Debate over College as Human Capital or Signal
The previous discussion dovetails with the ongoing debate regarding whether college adds to a worker’s human capital or is just a signal of underlying ability and contributes no direct value-added to individual productivity. According to the signaling theory developed by Nobel laureate Michael Spence, college completion is more costly (in terms of effort) for low-ability students, which implies that successful graduates have higher average underlying ability. Employers—unable to directly observe workers’ ability upon their initial hiring—therefore use degree attainment as a proxy for ability, which leads to the observed wage premium. By contrast, under the human capital theory, employers pay college graduates a higher wage because such workers have obtained valuable skills beyond those possessed by high school graduates who didn’t go on to college. From the standpoint of an individual worker, either theory implies that college attainment leads to higher wages—a positive private return. From a social standpoint, by contrast, if higher education is pure signal then it does not add to an economy’s productive capacity.
Numerous scholars have argued that college degrees serve largely as a signaling device.54One early paper that provides support for the signaling hypothesis is John G. Riley, “Testing the Education Screening Hypothesis,” Journal of Political Economy 87, no. 5 (1979): S227–52. Scholars have also criticized the increasing inefficiency of higher education despite the continued large college wage premium, which indicates that signaling may play an outsized role. See, for example, Todd J. Zywicki and Neal P. McCluskey, eds., Unprofitable Schooling: Examining Causes of, and Fixes for, America’s Broken Ivory Tower (Washington, DC: Cato Institute, 2019). For example, scholars often point to the sheepskin effect, whereby the attainment of a diploma itself leads to higher wages.55 See Bryan Caplan, The Case against Education: Why the Education System Is a Waste of Time and Money (Princeton, NJ: Princeton University Press, 2019). In other words, workers with degrees receive greater pay than nongraduates who completed similar coursework or years of education. Other scholars have contradicted the pure human capital hypothesis by pointing to the spillover enrollment effects of compulsory schooling laws.56 See Kevin Lang and David Kropp, “Human Capital versus Sorting: The Effects of Compulsory Attendance Laws,” Quarterly Journal of Economics 101, no. 3 (1986): 609–24. In a similar vein, one study demonstrates that the presence of a nearby university causes worse high school dropout rates, which is evidence against a pure human capital model of education.57See Bedard, Kelly, “Human Capital versus Signaling Models: University Access and High School Dropouts,” Journal of Political Economy, 109, no. 4 (2001): 749 – 775. Worse yet, the author concludes that greater university access might actually result in less earning power for less-able workers. As further support for the presence of signaling, other research has found that the direct effect of educational attainment on wages decreases with job duration, as employers gradually learn workers’ true underlying abilities.58Joseph G. Altonji and Charles R. Pierret, “Employer Learning and Statistical Discrimination,” Quarterly Journal of Economics 116, no. 1 (2001): 313–50. Economists have also found that college helps employees directly reveal their true abilities to employers, whereas the traditional signaling hypothesis explains the college wage premium in terms of worker sorting and employer inference about worker abilities.59 Peter Arcidiacono, Patrick Bayer, and Aurel Hizmo, “Beyond Signaling and Human Capital: Education and the Revelation of Ability,” American Economic Journal: Applied Economics 2 (2010): 76–104.
The research cited here establishes that college education has a signaling component to it—thereby ruling out the pure human capital theory—but it does not imply that college has no impact on human capital. To the contrary, several studies dispute the pure signaling theory of education. For example, at the high school level, one recent study finds little evidence of diploma signaling effects.60 Damon Clark and Paco Martorell, “The Signaling Value of a High School Diploma,” Journal of Political Economy 122, no. 2 (2014): 282–318. Another study implements several different empirical tests using UK data to discriminate between the signaling and human capital explanations for the college wage premium, finding strong support for human capital.61Arnaud Chevalier et al., “Does Education Raise Productivity, or Just Reflect It?,” Economic Journal 114 (2004): F499–F517. Using data from Colombia, research has shown that reducing course requirements for graduation led to a decline in post-graduation wages with no observable change in the quality of incoming or graduating students, which casts doubt on the pure signaling model.62 Carolina Arteaga, “The Effect of Human Capital on Earnings: Evidence from a Reform at Colombia’s Top University,” Journal of Public Economics 157 (2018): 212–25. Another researcher has concluded, based on these and other studies, that “evidence in favor of the pure signaling view is especially hard to come by,” making the point that empirical methods that detect the presence of information frictions in the labor market do not shed light on the productive role of education.63Georg Graetz, “Human Capital, Signaling, and Employer Learning: What Insights Do We Gain from Regression Discontinuity Designs?” (working paper, 2018), _p. 2_. Thus, the body of evidence indicates that college has both signaling value and human capital value. Moreover, there are methodological reasons why it may never be possible to accurately quantify their relative contributions to the college wage premium.64Nick Huntington-Klein, “Human Capital vs. Signaling Is Empirically Unresolvable” (working paper, 2018).
4. The Promise of Credit, the Anchor of Debt
When viewed together, the rise in tuition and the rise in the college wage premium point to large gains from college enrollment among academically prepared high school graduates, but indicate that the financial barriers to entry are high. Absent such barriers—for example, if college were affordable without any borrowing—economic theory predicts that there would be no relationship between family income and college enrollment. In short, neither the cost of college nor return to college in such a scenario would depend on family resources.
4.1 The Relationship between Family Income and College Enrollment
A large body of research has found that, back when college tuition was much cheaper, there was little relationship between family income and college enrollment after controlling for other factors such as family background, adolescent cognitive achievement, and underlying differences in ability.65For example, see Stephen Cameron and James Heckman, “Life Cycle Schooling and Dynamic Selection Bias: Models and Evidence for Five Cohorts of American Males,” Journal of Political Economy 106, no. 2 (1998): 262–333; and Stephen Cameron and James Heckman, “Can Tuition Policy Combat Rising Wage Inequality?,” in Financing College Tuition: Government Policies and Educational Priorities, ed. M. H. Kosters (Washington, DC: American Enterprise Institute Press, 1999), 76–124. In addition, research has found that parental transfers to their children made conditional on college enrollment are a major driving force behind the decision to attend college. In past decades, increases in available credit had negligible effects on enrollment, instead simply reducing the amount students worked in college and increasing their consumption.66 See Michael P. Keane and Kenneth I. Wolpin, “The Effect of Parental Transfers and Borrowing Constraints on Educational Attainment,” International Economic Review 42, no. 4 (2001): 1051–103.
The combination of rising costs and rising returns in the presence of binding borrowing limits has made family income a more important determinant of college attendance in recent decades, however. 67 See Lance Lochner and Alexander Monge-Naranjo, “The Nature of Credit Constraints and Human Capital,” American Economic Review 101, no. 6 (2011): 2487–529. In particular, except among the highest-ability students, moving from the bottom 25% in terms of family income to the top 25% raises college attendance rates by between 15 and 30 percentage points.68 See Philippe Belley and Lance Lochner, “The Changing Role of Family Income and Ability in Determining Educational Achievement,” Journal of Human Capital 1, no. 1 (2007): 37–89. Furthermore, the attendance rate at four-year vs. two-year institutions is 11 percentage points higher for students from families in the top 25% of income compared to students from families in the bottom 25%. Shifting from income to other assets, one study finds that an additional $10,000 in home equity raises college enrollment by nearly a percentage point, with larger effects exhibited among lower-income families.69 See Michael F. Lovenheim, “The Effect of Liquid Housing Wealth on College Enrollment,” Journal of Labor Economics 29, no. 4 (2011): 741–71. At the same time, even though income is becoming more important for college attendance, its relationship with the selectivity of the college a student attends is growing weaker. Whereas enrollment rates of students from families in the top 25% of income used to be 25 percentage points higher than those of students from families in the bottom 25%, that selectivity gap has since narrowed to only 16 percentage points.70See Kinsler, Josh and Ronni Pavan, “Family Income and Higher Education Choices: The Importance of Accounting for College Quality,” 2011, Journal of Human Capital, 5(4), 453 – 477. 73 See Matthew T. Johnson, “Borrowing Constraints, College Enrollment, and Delayed Entry,” Journal of Labor Economics 31, no. 4 (2013): 669–725.
4.2 Credit as a Gateway to Opportunity
With income as a limiting factor to college attendance, the ability to borrow through both the federal student loan program and supplemental private loans acts as a gateway to opportunity for academically prepared students for whom the college investment is most likely to yield a high rate of return. However, the sensitivity of enrollment to loan limits should not be overstated. Indeed, multiple studies find that raising loan limits causes only a modest increase in enrollment because students are reluctant to borrow large sums of money in the face of uncertainty during and after college. For example, one paper concludes that allowing students to borrow up to the full cost of college would only raise college completion rates by 2.4%.71See Matthew T. Johnson, “Borrowing Constraints, College Enrollment, and Delayed Entry,” Journal of Labor Economics 31, no. 4 (2013): 669–725. Another study finds that increases in credit supply caused by banking deregulation from the 1970s to the early 1990s raised college enrollment by 2.6 percentage points.72 See Stephen Teng Sun and Constantine Yannelis, “Credit Constraints and Demand for Higher Education: Evidence from Financial Deregulation,” Review of Economics and Statistics 98, no. 1 (2016): 12–24.
4.3 Trends in Student Debt and Default
The data reveal that students have indeed availed themselves of the opportunity to borrow to finance college. As shown in figure 10, inflation-adjusted student debt balances since 2003 have more than doubled in nearly every state, and in parts of the southeast they have nearly quadrupled. During this same period, the student loan delinquency rate has also skyrocketed, often in the same states where student debt has risen by the most.
Figure 10. Growth in Student Loan Balances and Delinquencies.
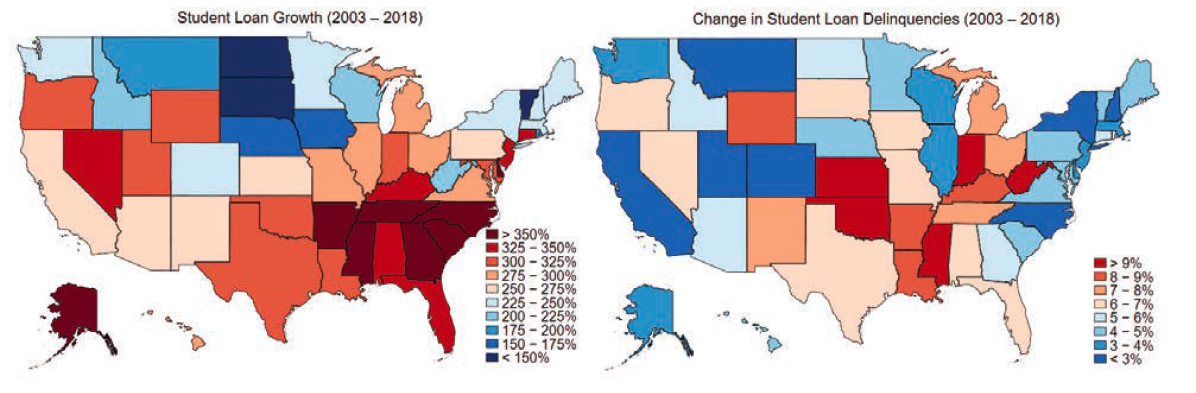
Source: Federal Reserve Bank of New York, New York Fed Consumer Credit Panel.
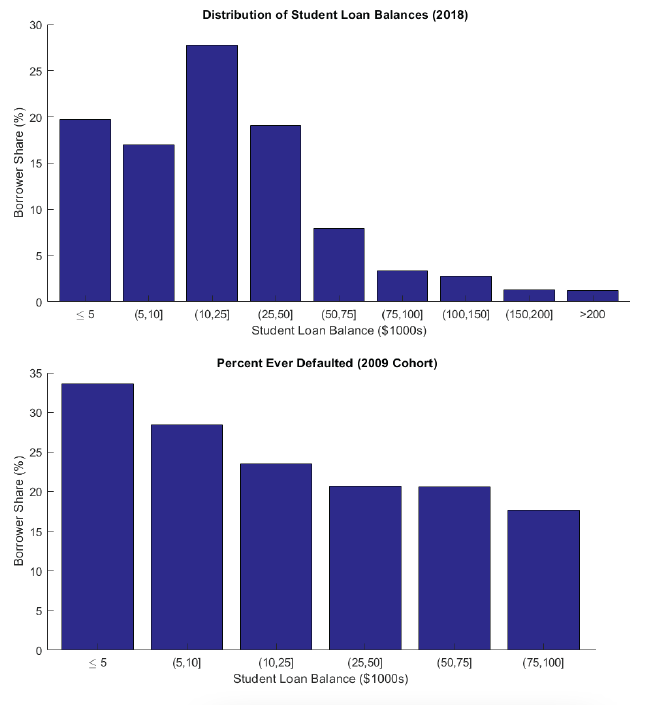
In the face of these stark statistics, it is tempting to sound the alarm and point to a growing student debt crisis, but some perspective is still in order. While average student debt per borrower now exceeds $20,000, nearly 20% of students graduate with less than $5,000 of debt, and only 9% graduate with more than $75,000 in student loans, as shown in figure 11.73Federal Reserve Bank of New York, 2018 Student Loan Update. Data comes from the Federal Reserve Bank of New York Consumer Credit Panel/Equifax Moreover, perhaps surprisingly, the highest frequency of default occurs among borrowers with the lowest balances, rather than among those who have accumulated the largest amount of debt.
Figure 11. Distribution of Borrowers and Defaulters by Loan Balance. Federal Reserve Bank of New York, New York Fed Consumer Credit Panel.
One possible explanation for such an unexpected pattern is that the colleges that charge the highest tuition also tend to yield the greatest labor market returns, thereby enabling graduates to service their debt using their higher earnings. To test this hypothesis, one recent study examines administrative data on federal student borrowing matched to earnings data from tax records. The paper concludes that most of the increase in defaults is associated with for-profit schools, two-year colleges, and nonselective institutions. The authors argue that much of the recent rise in student loan defaults can therefore be attributed to changes in the characteristics of borrowers and which schools they attend.74 See Adam Looney and Constantine Yannelis, “A Crisis in Student Loans? How Changes in the Characteristics of Borrowers and in the Institutions They Attended Contributed to Rising Loan Defaults” (Brookings Papers on Economic Activity, 2015). Figure 12 gives a visual representation of the five-year default rate over time and across institution types. Compared to the tuition patterns documented earlier, there appears to be little relationship between tuition and student loan default. In many cases, the most expensive institutions have the lowest default rates, whether because they offer greater value-added or, perhaps more importantly, because they tend to attract the students who are already best situated for success later in life owing to their academic ability and family resources. Either way, the lesson that emerges is that high default rates are endemic to certain classes of institutions and borrowers rather than being a generalized feature of rising student debt levels.
Figure 12. Federal Student Loan Default Rates by Type of Institution.
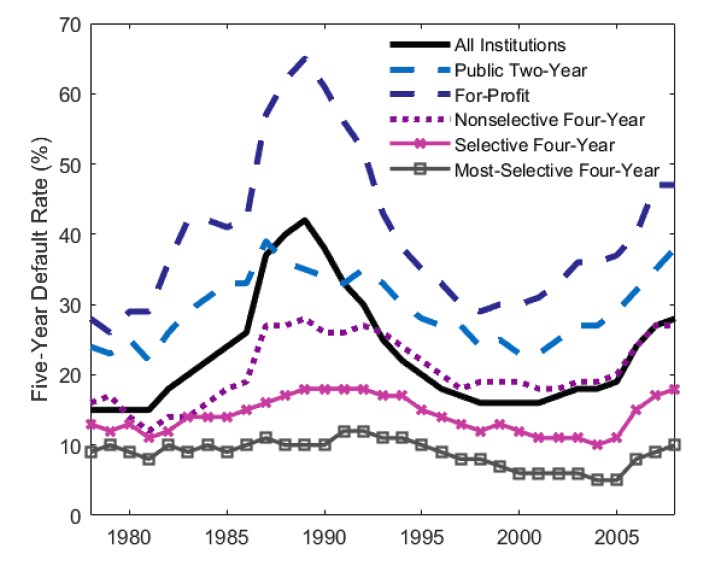
Source: Adam Looney and Constantine Yannelis, “A Crisis in Student Loans? How Changes in the Characteristics of Borrowers and in the Institutions They Attended Contributed to Rising Loan Defaults” (Brookings Papers on Economic Activity, 2015).
Recent evidence indicates that other factors also play a role in driving student loan defaults. For example, one study links the decline in house prices between 2007 and 2010 to the increase in student default rates observed during the same period.75See Holger M. Mueller and Constantine Yannelis, “The Rise in Student Loan Defaults,” Journal of Financial Economics 131 (2019): 1–19. While in principle both phenomena could be driven by the same adverse economic changes, the authors’ analysis attempts to extract causality and finds that the drop in house prices was responsible for between 24% and 32% of the increase in student loan defaults by causing negative employment spillovers. The authors attribute a further 30% of the rise in student defaults to changes in borrower composition. Although much attention has been paid to financial conditions, recent research also demonstrates that strategic motives seem to play a role in student loan defaults, indicating that financial distress is not necessary for default to occur.76 See Constantine Yannelis, “Strategic Default on Student Loans” (working paper, 2016).
4.4 The Consequence of Student Debt
Increasingly onerous student dent burdens have negative side effects besides simply crowding out consumption or raising the risk of default. Over the past decade, several academic studies have found that student debt alters borrowers’ career choices, impacts their marriage prospects, and can seriously impinge on plans for homeownership or starting a business.77Jesse Rothstein and Cecilia Elena Rouse find that student debt causes students to take higher-salary jobs and reduces the probability that they will take low-paid “public interest” jobs. Rothstein and Rouse, “Constrained after College: Student Loans and Early-Career Occupational Choices,” Journal of Public Economics 95 (2011): 149–63. Dora Gicheva shows that each $10,000 increase in student debt is associated with a 3–4 percentage point drop in the probability of first marriage for men and a 1 percentage point drop for women. Gicheva, “Student Loans or Marriage? A Look at the Highly Educated,” Economics of Education Review 53 (2016): 207–16. Dora Gicheva and Jeffrey Thompson demonstrate that student debt impairs access to financial markets after graduation. For a given amount of education, more student debt is associated with a greater likelihood of declaring bankruptcy. Gicheva and Thompson, “The Effects of Student Loans on Long-Term Household Financial Stability,” in Student Loans and the Dynamics of Debt, ed. Brad Hershbein and Kevin M. Hollenbeck (Kalamazoo, MI: W.E. Upjohn Institute for Employment Research, 2015), 287–316. Holger Sieg and Yu Wang find that student debt has negative effects on marriage prospects, career prospects, and investments in educational quality for female lawyers. Sieg and Wang, “The Impact of Student Debt on Education, Career, Marriage Choices of Female Lawyers,” European Economic Review 109 (2018): 124–47. Vyacheslav Fos, Andres Liberman, and Constantine Yannelis find that each $4,000 increase in debt reduces the probability of graduate school enrollment by 1.3–1.5 percentage points (relative to the 12% mean). Fos, Liberman, and Yannelis, “Debt and Human Capital: Evidence from Student Loans” (working paper, 2017). Alvaro Mezza, Daniel Ringo, Shane Sherlund, and Kamila Sommer show that a $1,000 increase in student loan debt lowers the homeownership rate by 1.8 percentage points for public four-year college-goers during their mid-20s. Mezza et al., “Student Loans and Homeownership,” Journal of Labor Economics (forthcoming). Daniel Cooper and J. Christina Wang reveal that student debt lowers the likelihood of homeownership and that there is also a negative correlation between student debt and wealth accumulation. Cooper and Wang, “Student Loan Debt and Economic Outcomes” (working paper, 2014). Zachary Bleemer, Meta Brown, Donghoon Lee, Katherine Strair, and Wilbert van der Klaauw demonstrate that American youth have accommodated recent increases in tuition by amassing debt rather than forgoing school. Moreover, the increase in student debt can explain 11%–35% of the 8 percentage point decline in homeownership among 28- to 30-year-olds from 2007 to 2015. Bleemer et al., “Echoes of Rising Tuition in Students’ Borrowing, Educational Attainment, and Homeownership in Post-recession America” (NY Fed Staff Report No. 820, Federal Reserve Bank of New York, 2017). Sarena Goodman, Adam Isen, and Constantine Yannelis conclude that an additional $10,000 of student loan and grant dollars implies an estimated 2.4 percentage point increase in homeownership. Goodman, Isen, and Yannelis, “A Day Late and a Dollar Short: Liquidity and Household Formation among Student Borrowers” (working paper, 2018). Karthik Krishnan and Pinshuo Wang discover that graduates from universities that establish no-loans financial aid policies are more likely to start entrepreneurial ventures and that these ventures are more likely to get venture capital backing and to get more venture capital dollars. Krishnan and Wang, “The Impact of Student Debt on High Value Entrepreneurship and Venture Success: Evidence from No-Loans Financial Aid Policies” (working paper, 2018). The overriding picture that emerges is one in which student debt appears to be just as much a force limiting economic opportunity in early adulthood as it is a force that facilitates the acquisition of a college degree that is supposed to open doors.
5. The Uncertain Future of Higher Education
Although a college degree remains a sound investment for many students toward better future labor market opportunities, decades of rising tuition and student debt have taken their toll on an increasing number of borrowers and created damaging economic side effects. If a trend is unsustainable, the only certainty is that it will not be sustained. Something will change. No sector is immune to disruption, including the higher education sector. A comprehensive analysis of all possible higher education reforms falls outside the scope of this report, but the latest research provides valuable guideposts for policy and suggests directions for additional future study.
5.1 Guideposts for Student Loan Reform
Student loans facilitate college enrollment, but they result in diminishing returns and may also inflate tuition. The available evidence identifies access to credit as an important factor determining college enrollment, particularly in recent decades as rising tuition has made it more difficult to pay for college out of pocket. Thus, any efforts to pare back student loans are likely to reduce the fraction of college graduates in society. For example, one study finds that completely eliminating student loans would lower college attainment by nearly 9.5 percentage points.78See Brant Abbott et al., “Education Policy and Intergenerational Transfers in Equilibrium,” Journal of Political Economy (forthcoming). Similarly, efforts to impede supplemental private borrowing—even if done in the name of consumer protection—may have the adverse, unintended side effect of reducing college enrollment, particularly for youth from low-income families.79See Lochner and Monge-Naranjo, “Nature of Credit Constraints.”
It does not follow, however, that expanding student loans is a sure path toward increased college enrollment. Here, the research is mixed, but multiple studies have found that even allowing students to borrow significantly more than the law currently allows is unlikely to measurably alter college attainment. Instead, it appears that student loans are a close substitute for parental transfers and student employment. More over, policy changes for government-provided student loans impact the private loan market. For example, one recent study finds that increasing government borrowing limits would lead to more default in the private market for student loans.80 See Felicia Ionescu and Nicole Simpson, “Default Risk and Private Student Loans: Implications for Higher Education Policies,” Journal of Economic Dynamics and Control 64 (2016): 119–47. Lastly, several studies have found that colleges “capture” a significant fraction of student aid by raising tuition in response to students’ increased ability to pay, though additional research is needed to reliably and precisely quantify this behavior.
Downside risk is a driver of default and a factor limiting college attainment. The evidence also indicates that students may be reluctant to borrow because of fears about their future inability to repay. After all, debt as a financial instrument is simple but blunt. In general, it requires borrowers to repay according to a fixed schedule until the loan terminates. In some cases the payment is fixed, in other cases it fluctuates (if interest rates are variable). In either case, the nature of the contract is such that borrowers are left to manage any economic risks they face in life—such as a deterioration in job prospects—without any adjustment to their payment obligations. In the case of student loans, this problem is compounded by the inherent riskiness of college (given high dropout rates) and the fact that student debt is, except in extreme situations, not dischargeable in bankruptcy. Even though the average college premium is large, there is considerable variation that is not completely predictable at the time of enrollment.
Student loan repayment should feature a safety net mechanism. Student debt has always allowed for contingencies of one form or another to prevent undue borrower hardship. In the past, borrowers could more easily discharge their student debt in bankruptcy if they experienced financial distress. However, high default rates in the late 1980s prompted lawmakers to mostly eliminate this option.81For more institutional discussion, see Felicia Ionescu, “Risky Human Capital and Alternative Bankruptcy Regimes for Student Loans,” Journal of Human Capital 5, no. 2 (2011): 153–206. Since then, several different income-based repayment plans have been introduced to protect borrowers who experience the worst labor market outcomes. The earliest iteration was Income-Contingent Repayment, which capped monthly payments at 20% of discretionary income for 25 years and forgave any unpaid balances at the end of that period. Starting in 2009, students were able to enroll in an Income-Based Repayment Plan, which capped payments at 15% of income, and this cap was subsequently lowered to 10%. This same level was enshrined in the subsequent Pay as You Earn Repayment Plan and Revised Pay as You Earn Repayment Plan, with each plan featuring different eligibility criteria and conditions. 82Additional information can be found at the US Department of Education’s Federal Student Aid website: see “Income-Driven Plans,” https://studentaid.ed.gov/sa/repay-loans/understand/plans/income-driven (accessed November 6, 2019). Importantly, any loan balances that are forgiven are treated as taxable income, which can leave borrowers with hefty tax bills.
Currently, only 29% of borrowers are enrolled in some form of income-driven repayment scheme. 83 See figure 13A in College Board, Trends in Student Aid 2018, Trends in Higher Education Series, 2018, 20. In the case of borrowers with high earnings, enrollment may provide little benefit. However, recent research indicates that uptake is low in part because of a lack of awareness and because the current framing of these policies discourages borrowers from participating. 84See Katharine G. Abraham et al., “Framing Effects, Earnings Expectations, and the Design of Student Loan Repayment Schemes” (NBER Working Paper No. 24484, National Bureau of Economic Research, Cambridge, MA, 2018). Regardless of the cause of this low uptake, research indicates that increasing the availability of income-driven loan repayment would provide some benefits both before and after college. On the front end, the availability of plans with income-contingent repayment obligations combined with forgiveness of any unpaid balances at the end of the loan duration would likely increase college enrollment and completion rates.85See Ionescu, “Risky Human Capital.” Another study finds that the expansion of income-based repayment during the Great Recession reduced student loan defaults and made borrowers less sensitive to house price fluctuations.86See Mueller and Yannelis, “Rise in Student Loan Defaults.” Besides enhancing college attainment, insurance against downside risk may provide additional labor market benefits. For example, recent work finds that mitigating earnings uncertainty could lead to higher occupational mobility.87 See German Cubas and Pedro Silos, “Social Insurance and Occupational Mobility” (working paper, 2019). In particular, income-based repayment would allow workers to enter occupations that have either lower or more uncertain starting pay but that may feature steeper earnings gradients over time.
In addition to income-based repayment, which provides insurance against low post-graduation earnings, some scholars have suggested adding automatic loan forgiveness in the event that a student does not complete college. To the extent that dropping out is a totally unforeseen event, such an arrangement could be an effective way to provide insurance against dropout risk. According to one study, loan forgiveness only in the event of involuntary dropout (i.e., failing out of school) could be provided at little cost, even taking into account that it could provide an incentive to some students to purposely shirk and do poorly such that they drop out, just to avoid future student loan payments.88See Satyajit Chatterjee and Felicia Ionescu, “Insuring Student Loans against the Financial Risk of Failing to Complete College,” Quantitative Economics 3 (2012): 393–420. However, the “insurance premium” of covering such loan forgiveness would become far more expensive for successful students if the program were expanded to include voluntary instances of dropping out (i.e., when students in good standing leave).
Policy makers should distinguish insurance from redistribution. Expanding income-based repayment entails several potential drawbacks as well as advantages, particularly if policy makers view it as a way to expand subsidies or pursue other social policy in an opaque manner. Deliberate underpricing of loans encourages excessive debt and an inefficient allocation of resources, all without the transparency of explicit grant programs. For this reason, income-based repayment should not be seen as a vehicle for loan forgiveness, but rather as a modified financial arrangement whereby borrowers should fully repay their loan on average. In other words, ideally the cost of the insurance would be priced properly into loans.
However, the nature of the pricing would likely be the subject of considerable political debate, just as it is for health insurance. On one end of the spectrum, all students could be placed into the same risk pool and charged a common interest rate that covers the pool-wide risk of ex post underpayment from borrowers who end up with low earnings. In this scenario, students likely to receive the largest post-graduation labor market returns to college (for example, engineering majors coming from selective institutions) would enter college knowing that their student loan borrowing would contain an implicit subsidy for other students who are likely to receive lower post-graduation earnings. On the other end of the spectrum, students could undergo individual risk assessments based on their academic preparedness (e.g., college admissions test scores or high school GPA), the institution they attend, and their choice of major. This model would be similar to the income share agreements that were first proposed by Milton Friedman decades ago.89 See Beckie Supiano, “A Closer Look at Income-Based Repayment, the Centerpiece of Donald Trump’s Unexpected Higher-Ed Speech,” Chronicle of Higher Education, October 15, 2016, https://www.chronicle.com/article/A-Closer-Look-at-Income-Based/238085. Each arrangement has advantages and disadvantages, but moral hazard emerges as a common concern. By acting as an implicit marginal tax—that is, the more people earn, the more they pay—income-contingent loans could discourage post-college human capital accumulation or labor effort.
Total loan forgiveness would be expensive, untargeted, and distortionary. With student loan defaults reaching troubling levels, proposals for unconditional loan forgiveness have begun to gather steam. While it is difficult to precisely estimate the effects of such sweeping plans, researchers have recently provided some insights by looking at how borrowers responded to an unexpected discharging of their debt following court decisions finding that National Collegiate Student Loan Trust—the largest private holder of student debt in the US—could not properly prove chain of title. In other words, the researchers have been able to compare outcomes for borrowers with similar levels of debt and income who differed only in whether they were lucky enough to have had their debt forgiven as a result of a court ruling. The researchers find that borrowers experiencing debt relief subsequently sought to repair other dimensions of their balance sheets and creditworthiness by deleveraging. As a result, they were less likely to default on other accounts. In addition, such borrowers exhibited increased geographic and job mobility, along with a significant rise in income—equal to two month’s salary over a three year period. 90 See Marco Di Maggio, Ankit Kalda, and Vincent Yao, “Second Chance: Life without Student Debt” (NBER Working Paper No. 25810, National Bureau of Economic Research, Cambridge, MA, 2019). In short, debt relief provided significant benefits. However, such “accidental” loan forgiveness does not provide a proper accounting of what an overt nationwide policy of blanket forgiveness would entail. Most importantly, it ignores costs. Whereas shareholders of National Collegiate have presumably borne much of the cost of the lost revenue from discharged debt, taxpayers would be on the hook for any broad-based loan forgiveness. After all, current forms of debt forgiveness on a much smaller scale already impose significant costs on the government.91For an evaluation of the costs of income consolidation, see Felicia Ionescu, “The Federal Student Loan Program: Quantitative Implications for College Enrollment and Default Rates,” Review of Economic Dynamics 12, no. 1 (2009): 205–31.
Besides being expensive, loan forgiveness would also be poorly targeted if the primary goal is to alleviate hardship and reduce default. The evidence discussed throughout this report paints a picture of a growing student loan repayment crisis for certain borrowers rather than a broad-based student debt crisis afflicting anybody with a student loan. Rather than targeting for assistance borrowers who are either already delinquent or likely to be on the verge of default, loan forgiveness would provide a large subsidy to a group of borrowers that would include people with moderately high earnings and little trouble repaying their obligations. Data from the Survey of Consumer Finances show that households in the top 25% by income held 47% of outstanding student debt, compared to only 11% among the bottom 25% of households.92 See figure 19A in College Board, Trends in Student Aid 2015. Furthermore, data from the 2012 National Postsecondary Student Aid Study show that families with incomes over $106,000 were nearly as likely to have large cumulative debt balances as families with more modest incomes. Furthermore, nearly 8% of families with incomes above $106,000 took out private loans, compared to only 7% of families with incomes between $30,000 and $65,000.93 See figures 2014_14B and 2013_9C in College Board, Trends in Student Aid 2018 (Excel file). In addition, data from the Federal Reserve Bank of New York reveal that the student loan default rate for borrowers with above-average income is in some cases only moderately higher than the rate for lower-income borrowers.94See Rajashri Chakrabarti et al., “Who Is More Likely to Default on Student Loans?,” Liberty Street Economics (Federal Reserve Bank of New York), November 20, 2017, https://libertystreeteconomics.newyorkfed.org/2017/11/who-is-more-likely-to-default-on-student-loans.html.
Besides being untargeted, unconditional loan forgiveness would likely create unintended negative consequences for taxpayers, future borrowers, and the broader economy. Taxpayers would be affected because students may anticipate that the loan forgiveness is not a one-time event but rather a policy that could be implemented from time to time in the future. In light of evidence that strategic motives already account for some student loan default behavior, borrowers would have an incentive to purposely defer repayment and even become delinquent in the hope that their debt will be wiped out in the future. After all, recent research indicates that the reintroduction of bankruptcy protection—a far less sweeping proposal than unconditional loan forgiveness—would increase student loan default by 18%, and that eliminating wage garnishment would increase default by 50%.95See Yannelis, “Strategic Default on Student Loans.” Future borrowers would be harmed if, in the process of implementing loan forgiveness, the government imposed haircuts on private lenders (i.e., by not compensating them completely for their losses). In that case lenders would inevitably price the risk of future debt wipeouts into new loans, thus increasing the cost of credit for future borrowers. The broader economy would be affected by any attempt to phase out the benefits of loan forgiveness for those with higher incomes: this would create an implicit tax on earnings on top of the explicit taxes that people already pay. For example, phasing out loan forgiveness by $1 for every $3 in income above $100,000 would increase the marginal tax rate for households with incomes over $100,000 by more than 33 percentage points.
Policy makers shouldn’t ignore Parent PLUS Loans. While much attention has been paid to the borrowing of students, parents also play a pivotal role in financing college, both through direct transfers to their children and through their own borrowing. In fact, since the first few years after 2000, Parent PLUS borrowing has been one of the fastest-growing sources of debt to finance higher education. Back in 2002, the average annual borrowing amount was $11,750 for such loans, and it has since increased by nearly $5,000 in inflation-adjusted terms.96See figure 9B in College Board, Trends in Student Aid 2018, 17 Parent PLUS Loans present several policy challenges. First, as with any source of financial aid, they may be contributing to tuition inflation. Second, because parents are not the recipients of their child’s college degree and the higher earnings it confers, they may lack the means to repay the debt. This risk is compounded by the fact that Parent PLUS Loans are ineligible for most of the income-based repayment programs available to students. However, forgiveness of Parent PLUS Loans would create the same unintended consequences as would forgiveness of student loans. Thus, future research is needed to examine different policy options, such as altering Parent PLUS eligibility, altering loan limits, or adjusting other forms of financial assistance to families such that parents do not engage in as much borrowing of their own.
Information is important. There are many additional reforms that have been suggested. At the borrowing stage, the government has in the past instituted changes to the expected family contribution formula that determines eligibility for grants and subsidized loans. For example, as of 1992, home equity on the principal residence is no longer included in the asset calculation. Research indicates, however, that this particular change has had little impact on enrollment.97See Ionescu, “Federal Student Loan Program.” Other scholars have highlighted the complexity of the FAFSA form and pointed out that a similar distribution of federal aid could be achieved by replacing the FAFSA with information from IRS Form 1040, which taxpayers are already required to fill out.98See Susan Dynarski and Mark Wiederspan, “Student Aid Simplification: Looking Back and Looking Ahead,” National Tax Journal 65, no. 1 (2012): 211–34. By providing detailed income and asset information to colleges—thus providing colleges with significant knowledge about students’ ability to pay—the current financial aid system gives colleges significant pricing power that is enjoyed by almost no other sector in the economy. One recent study evaluates the impact of restricting the provision of FAFSA information to colleges and concludes that, while a fraction of students attending elite colleges would be priced out of that market, the majority of students would benefit from lower prices. While colleges like to claim that the existing information available to them facilitates the provision of need-based aid, this study finds that 30% of low-income students are actually harmed by the status quo.99See Ian Fillmore, “Price Discrimination and Public Policy in the U.S. College Market” (working paper, 2018).
5.2 Other Lessons for Higher Education Reform
One-size-fits-all pricing has limits. Internally through institutional aid, colleges already differentiate prices from student to student based on academic ability (merit) and family income (need). However, some institutions face external constraints on their ability to provide more generous targeted assistance, such as state-imposed caps on sticker price tuition, even though the sticker price is a highly misleading measure for the price paid by most students. Absent such constraints, colleges could raise their sticker price, charge only a subset of students the higher price (e.g., high-income, low-ability students), and offer more generous aid to low-income, high-ability students. Research indicates that such behavior indeed occurred following tuition deregulation in Texas in 2003 and that “deregulation did not reduce poor students’ outcomes.”100Rodney J. Andrews and Kevin Stange, “Price Regulation, Price Discrimination, and Equality of Opportunity in Higher Education: Evidence from Texas” American Economic Journal: Economic Policy, 11(4): 31 – 65 (citation on page 32). In addition, in-state tuition caps create an incentive for public colleges to substitute for the admission of state residents the admission of out-of-state students, who can be charged higher prices.
Along a different margin, colleges could also charge differential tuition based on a student’s choice of major. Although such a practice would diverge from the liberal arts ethos that has guided much of American higher education, it would reflect the fact that vast cost differences emerge between majors. In the current system, for example, English majors effectively subsidize engineering majors, even though the latter are likely to receive far higher salaries after graduation. While such a shift could dissuade low-income students from enrolling in high-cost majors, financial aid could also be made major-specific. The extensive cross-subsidization across majors may partly explain the research finding that students place greater weight on their tastes than on monetary returns when making decisions about their college major.
The reality of free college would fall short of the promise. For decades, complete subsidization of K–12 education by the government has guaranteed access to elementary and secondary education at no out-of-pocket expense. With college potentially taking the place of high school as the gateway to economic opportunity, some have called for similarly making college free at the point of service through much-more-generous public subsidies. Before addressing such a dramatic move, it is useful to consult existing research on the impact and cost effectiveness of current higher education subsidies as well as on the likely effects of marginal expansions in funding. Several research papers conclude that increased subsidies are unlikely to be cost effective or to achieve the goal of directing assistance toward low-income families. For example, one study finds that a higher subsidy rate would lead to substantial increases in college investment among youth from wealthy families but to only modest effects among financially constrained youth.101 See Lochner and Monge-Naranjo, “Nature of Credit Constraints.” As a result, a universal subsidy would actually amplify earnings inequality. Other work finds that increasing college subsidies is much less effective than raising expenditures for early education, largely because college subsidies come too late in a child’s life to provide significant benefits for children from low-income families. 102See Diego Restuccia and Carlos Urrutia, “Intergenerational Persistence of Earnings: The Role of Early and College Education,” American Economic Review 94, no. 5 (2004): 1354–78.
The untargeted nature of direct tuition reductions is one flaw of free-college proposals, but a perhaps greater problem arises from the distinction between college enrollment and college attainment. It is, after all, almost surely not cost effective to subsidize the enrollment of students who end up dropping out and not graduating. Unfortunately, such an outcome is exactly what the research indicates might occur with any significant subsidy-induced enrollment expansion. Early work that takes into account the importance of the dropout decision assesses a hypothetical tax and subsidy scheme that makes the parental decision to send a child to college independent of income. The authors conclude that such a reform would increase college attainment by less than 3 percentage points, whereas taxes and the dropout rate would both increase significantly.103 See Elizabeth M. Caucutt and Krishna B. Kumar, “Higher Education Subsidies and Heterogeneity: A Dynamic Analysis,” Journal of Economic Dynamics and Control 27 (2003): 1459–502. More-recent work also finds that the sensitivity of college attainment to the college premium is significantly dampened by dropout risk. Further increases in the wage premium are likely to draw in marginal students who are the least academically prepared to successfully complete college.104See Kartik Athreya and Janice Eberly, “Risk, the College Premium, and Aggregate Human Capital Investment” (working paper, 2018). Other research goes even further, finding that nearly half of high school completers place zero value on access to college, and that subsidies to college currently flow to those already best positioned to succeed and least sensitive to them.105Kartik Athreya et al., “Who Values Access to College?” (Federal Reserve Bank of Richmond working paper WP 19-05R, 2019). Intuitively, it is not the case that a significant fraction of people place little value on receiving the college wage premium, but rather that there is little likelihood that this group would ever graduate and receive these gains from college. Reducing tuition through greater subsidies would attract more of these marginal students to attend college, but doing so would not be cost effective because many would simply drop out. Rather, the authors conduct an analysis that finds that redirecting college subsidies away from individuals who would enroll anyway and toward providing a stock index retirement fund for individuals who do not attend college would lead to higher economic welfare without reducing total college enrollment or affecting the budget.
Besides being untargeted and expensive, a sweeping free-college plan would likely wreak havoc on the higher education market in ways that its advocates may not envision. First, given that free-college proposals tend to only apply to public colleges, private institutions would be put at a significant disadvantage, making them more akin to private K–12 schools that enroll a significantly smaller fraction of elementary and secondary students. Second, to prevent runaway costs, it is inevitable that any free-college proposal would require significantly greater oversight of university functions than currently occurs, perhaps leading to direct government regulation of class sizes, teaching loads, faculty pay, and other internal matters.
Conclusions
Taking a step back, the prospects for sound policy reform depend on researchers arriving at even more reliable and precise conclusions regarding the causes of rising college tuition. For example, if rising tuition is a result of either stagnant productivity or an institutional obsession with rankings at the expense of cost consciousness, pressure may build to consider entirely different models of higher education delivery, such as alternative accreditation, online education, and greater reliance on for-profit institutions. Whether such a shift is inevitable or unlikely is a matter purely of speculation, and more research is needed to assess the changes that have already occurred. While in many ways higher education is steeped in tradition, it cannot escape the forces of innovation that promise (or threaten) to disrupt every other sector of modern society. Although the data do not point to an imminent collapse of higher education, the strains of rising prices and debt are already affecting enrollment patterns and post-college outcomes. More research is needed to understand the forces driving these trends and to devise solutions that best harness the opportunities higher education can provide.