

 VoxEU
VoxEU Obserwator Finansowy
“No reference to immigration appeared on the ballot paper, but politicians believe that the Brexit vote represented a desire to “take back control” of the country’s borders.”
In “Keep Out: Lower immigration could be the biggest economic cost of Brexit”, The Economist, February 25, 2017.
1. Introduction
On June 23, 2016, the people of the United Kingdom (UK) voted to leave the European Union (EU)–henceforth Brexit. In March 2017, the UK Parliament confirmed the result of the referendum. The European Union (Notification of Withdrawal) Bill received Royal Assent and became an Act of Parliament. In accordance with Article 50(2) of the Treaty on European Union, Teresa May, the British prime minister, formally notified the European Council of her intention to withdraw from the EU, launching an exit negotiation process that ended in January 2020. One of the hallmarks of the EU is the free movement of people and labor between member countries. Brexit implies an end to this mobility, to the right to settle in Britain and to the right to bring family members for most European migrants, even if policies somewhat differed for low-vs. high-skilled migrants (Anderson, 2017).
Britain’s split from the EU changes its relationship to the bloc on trade, security and, importantly, migration. Brexit raises the cost of studying in the United Kingdom by modifying EU students’ home fee status,1This is the most immediate implication of Brexit for most EU students. Up until now, they enjoyed the same tuition fees as British students. At public universities in England, tuition at the undergraduate level was capped at 9,250 GBP per academic year; in Wales, at 9,000 GBP/year; and in Scotland, it was basically free for all UK and EU students. From 1 August 2021 onwards, these benefits will only apply to UK students. Students from EU country members will pay tuition fees up to two, three, or even four times higher, depending on the university (https://www.mastersportal.com/articles/2843/uk-tuition-fees-for-eueea-students-in-2021-changes-after-brexit.html). the ability to secure loans,2International students from EU country members and Switzerland will no longer be able to apply for student loans from August 2021 onwards. The program would cover tuition fees up to 9,250 GBP/year –the tuition limit for undergraduate studies. The money would go straight to the university and students would repay it in installments, but only after reaching a certain income threshold (https://www.mastersportal.com/articles/2843/uk-tuition-fees-for-eueea-students-in-2021-changes-after-brexit.html). and visa requirements.3Brexit also modified the free movement of people that EU members enjoyed. Nevertheless, the Home Office has announced a new post-study Graduate immigration route intended to be launched on 1 July 2021. Full details on the application process are still to be confirmed. However, the post-study visa will enable international students to work or look for work after their studies for 2 years, or 3 years for PhD students (https://www.internationalstudents.cam.ac.uk/graduate-immigration-route). Crucially, Brexit increases uncertainty regarding international students’ ability to pursue multiple degrees in the UK now that the cost is higher,4Many international students come to the UK with the intention to pursue both undergraduate and graduate studies: 25% of international students who graduated from a UK university in the academic year 2017/2018 reported to be enrolled in full or part-time study 15 months after graduation (HESA, 2020). For them, the increased uncertainty surrounding the ability to finance those degrees might be substantial. or to stay in the country to live and work after completion of their studies. This higher implicit economic cost could deter prospective students from considering studying in the United Kingdom in the first place. Finally, aside from the higher cost of pursuing a UK education, Brexit could also deter prospective students from moving to a country they feel is no longer welcoming to migrants (Falkingham et al., 2019). We assess how a unique institutional change, such as Brexit, has affected international student applications in the country. The outcome of the referendum on Brexit, where England (but not London) and Wales voted in favor to exit the bloc, whereas Scotland and Northern Ireland voted otherwise,55 The referendum about leaving the EU took place on March 23, 2016, and 51.9 percent of voters were in favour of leaving the EU (https://data.gov.uk/dataset/be2f2aec-11d8-4bfe-9800-649e5b8ec044/eu-referendum-results). was unexpected.6In December 2015, opinion polls showed a clear majority in favour of remaining in the EU (e.g. Duncan, 2016). As such, Brexit provides an ideal quasi-natural experimental setting, enabling us to explore how the decision to leave the EU affects international students’ decision to apply and enroll in a UK university.
Figure 1 shows international student applications to UK universities from the EU and non-EU block from 2007 through 2019. While both exhibit a somewhat parallel upward trend from 2008 through 2011 (before the increase in tuition fees in 2012 dampened EU applications) and from 2012 through 2016, student applications from EU countries dropped in 2016 and stagnated thereafter whereas applications from non-EU countries rose by 16 percent. Using administrative data from the Universities and Colleges Admissions Service (UCAS) and a difference-in-difference approach,7 UCAS is a UK-based organization whose main role is managing applications to higher education courses in the UK. All students planning to study full-time for an undergraduate degree in England, Wales or Northern Ireland must apply through this system – including EU students and international students (non-EU). In Scotland, around a third of full-time undergraduate students are not included in UCAS figures –they mostly consist of full-time higher education students in further education colleges. These are colleges offering courses for people over the age of sixteen that involve school-level qualifications or university entrance qualifications, as well as educational courses integrating school or university curriculum with the workplace. we compare changes in international student applications from EU member countries to those from non-EU members, pre-vs post-UK’s vote to leave the EU. Students from EU member countries constitute the treatment group, whereas international students from elsewhere make up the control group. The control group serves the purpose of accounting for other changes taking place over the same period, potentially affecting undergraduate applications of prospective international EU and non-EU students in similar ways.
We find that Brexit has significantly lowered applications originating from EU country members. Specifically, when compared to student applications originating from elsewhere in the world, the growth rate of EU applications dropped by 7 percent following the Brexit referendum. This effect, which proves robust to the use of various model specifications, an alternative dependent variable specification, and different study samples, is not observed when we randomly draw the treatment group from the pool of non-EU countries in a placebo exercise. Additionally, we rule out anticipation effects and the existence of differential pre-trends in applications of international EU vs. non-EU applicants. Changes in the volume of international student applications from the EU did not precede the Brexit referendum; rather, they occurred right after and persisted during the 3-year period that followed. Finally, the effect of Brexit varies by subject of study, with the impact being more acute for science, technology, engineering, and mathematics (STEM) applicants, suggesting these students are choosing to apply elsewhere.
We also investigate some of the likely mechanisms at play focusing on the role played by two key factors:
- Psychological factors as captured by a potentially unfriendly environment towards EU residents after Brexit, and
- Economic factors related to the now curtailed ability to stay long term in the United Kingdom upon completion of their studies to find employment.
To assess the relevance of psychological costs in shaping student applications, we explore if Brexit had a differential impact across UK regions depending on whether they voted to remain or to leave the EU. We find that the effect is homogeneous across all UK regions regardless of how they voted for Brexit. This finding suggests that concerns about the emergence of xenophobic sentiments, which could vary across regions depending on how they voted, might not have been the primary driver of reduced student applications. Alternatively, international applicants might have been unaware of differences in Brexit voting patterns across UK regions. Next, we explore how the curtailed ability to stay long term in the UK to find employment might have influenced international student applications. To that end, we examine how applications vary based on economic conditions in the home countries of prospective students, as captured by their GDP per capita and employment to population ratios. International applications appear to have declined to a larger extent after Brexit among EU students from countries with lower per capita GDP and employment to population ratios –students who would have been more interested in staying in the United Kingdom after completion of their studies to live and work. The findings are suggestive of students’ newly restricted employment prospects playing a critical role in explaining the decline in international applications after Brexit.
To conclude, we explore if the observed reductions in student applications had any implication for international student enrollments. Enrollments could remain unchanged if applications far exceeded admissions or if universities reacted by raising admission rates to counteract a decline in student applications. Focusing on cells with non-zero applications, we find evidence of substantive drops in international student enrollments, underscoring concerns regarding the ability to attract international talent.
Understanding the diverse implications of Brexit is critical. In addition to potential trade and investment disruptions accompanying the undoing of 47 years of economic integration, Brexit ends the free movement of people, affecting the right of people from elsewhere in the EU to move to Britain and vice versa. This has created anxiety on the part of UK universities, which have increasingly relied on international applications. Specifically, the UK Department for Education has estimated their contributions amounted to £17.6 billion in 2015 (Migration Advisory Committee, 2018). The UK is second only to the United States in international student enrollments (OECD, 2013). International students in the US and the UK provide a vital source of income for the institutions where they study,8See, for example, Hunt and Gauthier-Loiselle (2010), Stuen et al., (2012), and Bound et al., (2020). cross-subsidising research and the education of domestic students, resulting in significant financial and creativity spillovers (Migration Advisory Committee, 2018).
In addition to fiscal and innovation considerations, demographic trends make this question particularly relevant considering the shrinking 18-years-old British population since 2017 (UCAS, 2017) –a trend potentially responsible for the recent decline in enrollments of UK students in undergraduate programs. General aging of the UK population (ONS, 2017) makes attracting and retaining international students an important factor to sustain an aging society.
In sum, understanding the factors driving international student applications is key in ensuring student in- flows and their positive externalities. This is especially relevant for a country such as the United Kingdom, which is second only to the United States in hosting international students (OECD, 2013). Before Brexit, international students represented 14 percent of undergraduate students and 35 of postgraduate students in the UK, and approximately 36 percent of international undergraduate students were EU nationals (HESA,2020).9 https://www.hesa.ac.uk/data-and-analysis/students/ (last accessed on June 4, 2021). Yet, until this study, we had no understanding of what the impact of Brexit will be on UK universities’ ability to attract foreign talent.
This study contributes to the understanding of the implications of Brexit. Recent literature has examined the determinants of the Brexit vote. Areas with low educational attainment and incomes, high unemployment, and a historically large concentration of employment in manufacturing were more likely to vote for Brexit (Becker et al., 2017). At the individual level, one of the main drivers were feelings about income rather than actual income (Liberini et al., 2019). Other studies have explored how Brexit impacted macroeconomic outcomes (e.g. Born et al., 2019; Breinlich et al., 2020), as well as public safety (e.g. Carr et al., 2020). Less has been done in terms of the impact of Brexit on universities. We address that gap by assessing how Brexit has impacted the volume, as well as the potential selectivity, of international applications.
More generally, the analysis contributes to a growing academic literature examining the determinants of student mobility and university applications. This literature underscores the relevance of employment and earnings’ aspirations in shaping international student applications (e.g. Bhagwati and Rao, 1999; Chiswick, 1999; Dustmann et al., 2011; Rosenweigz et al., 2006, among others), along with costs (Korn, 2017), and the availability of funding (Baer, 2017). More recently, the focus has turned onto policy, focusing on the role that more restricted H-1B visa policies in the United States have had on the quality of international student applicants and on enrollments (Chellaraj et al., 2008; Kato and Sparber, 2013; Shih, 2016; and Meckler and Korn, 2018). Less is known about similar impacts in the United Kingdom. The closest study is one by Falkingham et al. (2019), who examine how Brexit has impacted EU students’ willingness to return home. Our focus is, instead, on students’ willingness to apply to study in the United Kingdom in the first place, as well as on the potential quality of applicants and the factors likely driving their choices.
From a policy perspective, understanding the implications of Brexit on international student applications may prove crucial to safeguard universities from lost revenue as applications from within the United Kingdom have been declining. But, most importantly, it is vital in attracting international talent for innovation and growth.
2. Institutional Background
Prior to Brexit, international students from other EU countries enjoyed ‘home fee status’ in the United Kingdom. This meant they paid the same fees as British students. This implied significant savings with regards to the tuition fees paid by non-EU international students, often two to four times larger. In addition, EU students were able to apply for a student loan in England, Northern Ireland, or Wales, or have their fees paid by Student Awards Agency Scotland (SAAS) if they were studying as an undergraduate in Scotland. The loan, which typically amounted to the cost of undergraduate tuition, could be repaid in installments once working and their income reached certain thresholds. But, perhaps most importantly, students from other EU country members enjoyed the right to live and work in the United Kingdom upon completion of their studies without any restrictions.
Once Brexit was fully implemented on December 31, 2020– conditions changed. EU students who arrived in the United Kingdom before January 1, 2021, are able to maintain the above conditions by applying for the EU Settlement Scheme. EU students arriving after January 1, 2021, and starting their studies prior to July 31, 2021, experience changes in their immigration status, but are able to maintain the ‘home status fee’ that their counterparts enjoyed prior to Brexit. Lastly, those arriving after January 1, 2021 and starting their studies after July 2021, will not only experience a change in their immigration status, but also no longer enjoy the ‘home status fee’ of their predecessors. Each UK University will set its own fees for EU students. In addition, students will need to apply for a student visa if they are planning to stay for a course lasting beyond 6 months. This will require paying an application fee (£348) and having a current passport. They will also need to pay an Immigration Health Surcharge (£470/year) that provides them with access to the UK National Health Service. Finally, unlike their predecessors, they might not be able to apply for a student loan in England, Northern Ireland or Wales, or have their fees paid by SAAS if they are studying as an undergraduate in Scotland.10 For more information, please visit: https://study-uk.britishcouncil.org/moving-uk/eu-students. While these provisions are still to be implemented and, as such, do not apply to EU applicants included in this analysis, the expectation of changing conditions (such as the ability to live and work in the United Kingdom after completing their studies) might have impacted the decision of many prospective EU students to apply to study in the United Kingdom.
3. Conceptual Framework
To better illustrate how Brexit might have impacted applications from EU students to study in the United Kingdom, we consider a simple model in which EU students primarily make that decision based on their perceived ability to stay in the United Kingdom to live and work after completing their studies. As noted earlier, in addition to any new application and health fees, Brexit modifies EU students’ ability to stay long term in the United Kingdom after the completion of their studies –a change that might have deterred these students from applying to a UK university.
As in Kato and Sparber (2013), who model the response of international student applications to a reduction in the H-1B quota in the United States, we assume that, when deciding whether to study in the United Kingdom, EU students will compare the expected benefit from doing so in terms of labor market prospects upon graduation  to their reservation wage of studying elsewhere
  –both of which depend on students’ skill levels
  . If the probability of finding long-term employment in the United Kingdom is given by
  , where 0 < p < 1, and we assume zero migration costs for simplicity, students will apply to study in the United Kingdom only if:
 ![[p*NB(_{s}_{i})] > RW(_{s}_{i})](https://www.thecgo.org/wp-content/ql-cache/quicklatex.com-73bce6d22c0ed03e07a2ebdfa268faa0_l3.svg "Rendered by QuickLaTeX.com") . Note that a lower under Brexit lowers the propensity for expected net benefits to exceed their reservation wage and, therefore, the likelihood for international students to apply. Additionally, by raising tuition costs considerably and eliminating the possibility of securing student loans, Brexit lowers the expected benefit from doing so in terms of labor market prospects upon graduation . Hence, when compared to their reservation wage to pursue studies abroad, our primary hypothesis is that Brexit might reduce the number of applications received from EU students.
. Note that a lower under Brexit lowers the propensity for expected net benefits to exceed their reservation wage and, therefore, the likelihood for international students to apply. Additionally, by raising tuition costs considerably and eliminating the possibility of securing student loans, Brexit lowers the expected benefit from doing so in terms of labor market prospects upon graduation . Hence, when compared to their reservation wage to pursue studies abroad, our primary hypothesis is that Brexit might reduce the number of applications received from EU students.
A secondary hypothesis is that such impacts are likely to be heterogeneous, varying across universities and subject areas.11For instance, highly selective universities might be differentially affected by Brexit when compared to less selective institutions. In addition, some subject areas, such as STEM fields, might prove more resilient than others. A priori, it remains ambiguous how the average quality of applicants might change. If positively selected applicants are more sensitive to policy changes than other applicants, either because they tend to be better informed, have more options to study elsewhere, or because they were already the sole ones finding employment in the United Kingdom upon graduation, we might expect a decline in the average quality of applicants. Nevertheless, if fewer positively selected applicants were finding employment in the United Kingdom upon graduation prior to 2016 and Brexit only induces employers to seek employment visas exclusively for positively selected graduates, positively selected applicants might not be particularly hurt by the restrictions imposed by Brexit on their ability to stay long term in the United Kingdom upon graduation. Rather, the brunt of the policy might fall upon applicants on the left-tail of the ability distribution, who now will find it rather difficult to stay upon completion of their degrees, although a recently announced post-graduation visa should mitigate that impact by allowing graduates to stay for an additional two to three year period to find work.
4. Data and Descriptive Statistics
We use administrative data from the Universities and Colleges Admissions Service (UCAS) on undergraduate applications to UK universities over the 2013 through 2019 period.12We check the robustness of our results by using a longer time series that starts in 2008 (see Column 2 in Table 3B). However, we focus the analysis on the period 2013-2019 to exclude the effect of legislation increasing tuition fees for home and EU students introduced in 2012. Sá (2019) shows that the increase in tuition fees reduced substantially university applications by comparing applications to UK universities in England, which was subject to the increase in fees) to applications in Scotland, which was not subject to the fee increase. Focusing on the 2013- 2019 also results in a balanced time window around the treatment year, 2016. UCAS is the body that manages all applications to undergraduate courses in the United Kingdom. Scotland is an exception, as around a third of full-time undergraduate students are not included in UCAS figures. They are applicants to colleges preparing students to meet university entrance qualifications or providing vocational training that combines a college education with workplace experience. UCAS produced the number of applications by year, subject, institutions (university or college) and country of domicile.13For confidentiality reasons, each cell count is rounded to the nearest five. Cell counts of one and two are reported as zero. They only represent 0.03 percent of the estimation sample. For most courses in the United Kingdom, the deadline to apply is in January of the year when the course starts. For any course at the University of Cambridge and Oxford, and most courses in medicine, veterinary medicine/science, and dentistry, the deadline is in October of the year before the course starts.
The decision to apply to a UK institution is best measured by data on applications. After all, enrollments are the by-product of student applications, university admissions, and students’ acceptance of university admissions. As such, it is feasible for enrollments to remain unchanged if the volume of applications far exceeds the volume of university admissions, or if universities raise admission rates to counteract a decline in student applications. While we make use of enrollment data to assess the consequences of declining student applications on final student registrations,14According to the definition provided by UCAS, this variable refers to the number of applicants who have accepted an offer from a university. In some cases, applicants accepting an offer do not enroll; therefore, this measure could overstate actual enrollments. our primary focus is on applications. Specifically, we use data on the total number of applications by country of origin of international applicants, institution, subject of study and year. Until 2007, students could submit up to six applications. From 2008 onward, this number was reduced to five.15Our analysis is not affected by this rule change as our sample starts does not include pre-2008 years.
To abstract from existing educational attainment trends, we compute growth rates in the number of applications– defined as the log difference in applications received over two consecutive years. Each cell is specified at the source country, university, subject, and year level. We create a panel of 538,070 cells, consisting of 208 countries, 293 universities, 25 subjects, and 7 years, by setting empty cells equal to zero. The panel is slightly unbalanced since some universities (18 percent) appear for the first time in our dataset after the initial year; nevertheless, they represent only 1 percent of the sample.16For each university, we retain only the years after the first appearance in the dataset. Results are virtually unchanged if we exclude these universities from the estimation sample. To retain cells with a value of zero, we use the inverse hyperbolic sine transformation throughout. Gelber (2011) adopts a similar transformation in a different context. Table 1 provides a bird view of changes in international student applications.17Each cell is weighted by the number of applications by country in the initial year to account for the fact that some countries, such as China, send significantly more students.
Despite our focus on a balanced and narrower time window around the treatment spanning from three years prior to three years after the Brexit vote (i.e. from 2013 to 2019), Table 1 reports the time series spanning from 2008 onward to justify our sample choice. First, we observe that there was a significant increase in the volume of EU students applying to UK universities after 2008 up until 2011, possibly in response to the unfolding Great Recession, which lowered the opportunity cost of pursuing tertiary education. This increase was much less pronounced for non-EU students, since the vast majority originated from China – one of the countries least affected by the Great Recession.18The decrease between 2007 and 2008 is observed for both EU and non-EU countries and it is likely driven by the reduction in the maximum number of applications each student was allowed to submit from 2008 onward. Second, applications from EU students dropped substantially in 2012 following the large increase in tuition fees from an average of £3,375 to approximately £9,000 per year, which affected UK and EU students with some differences across UK regions (Sá, 2019).19The rise in tuition fee affected all universities in England, whereas Scottish universities, as well as Northern Irish students studying in Northern Ireland, were unaffected. Welsh students at any UK university had the fee costs fully paid by the Welsh Assembly. Third, despite a reduction in applications from 2016 to 2017 among the comparison group (non-EU students), the largest decline in applications from EU students occurred between 2017 and 2018, following the referendum on Brexit. Given the differential impact of the 2012 tuition fee hike on applications of EU and non-EU students, we focus our attention on the period starting right after:from 2013 through 2019. This is a balanced time window spanning from three years prior to three years after Brexit that, in addition, allows us to gauge the impacts of Brexit more precisely by narrowing the time window around treatment.
At the bottom of Table 1, we compute the difference in the growth rate of applications between 2016 and 2019 (the last year for which we have data) for students from an EU country and for students from a non-EU country. As shown therein, the rate of growth of student applications from non-EU countries grew by 3.6 percentage points over that period, whereas it declined by 6.3 percentage points for students from EU nations. As a result, vis-à-vis international student applications from non-EU countries, the growth rate of student applications from EU countries declined by 10 percentage points over the 2016 through 2019 period.
5. Methodology
While revealing, the figures in Table 1 are merely descriptive. Given the quasi-natural experimental feature of Brexit, we rely on a difference-in-difference approach to examine changes in university applications of international students from EU and non-EU countries, pre vs. post the referendum on Brexit as follows:20Due to their similarities, we compare international students from EU countries (our treatment group) to international students from non-EU country members (our control group). While these students might, ultimately, be impacted by the vacuum created by EU students, they are not directly affected by Brexit and, as such, their response should be, at best, of second order. In addition, we do not use British students as a control for two reasons: (1) notable differences between native and international students; and (2) the well-documented shrinkage of the 18-years-old British population since 2017 (UCAS, 2017), which we also observe in our data (see Table A in the appendix) and has been deemed responsible for the recent decline in enrollments of UK students in undergraduate programs.
(1) 
where  is the log difference or growth rate in international student applications from country
  , for subject of study
  , at university
  from year
  to year t.21Before first differencing, we apply the inverse hyperbolic sine transformation to retain zeros (see Gelber, 2011). Working with growth rates enables us to address that the volume of applications from any given country to an institution in a particular subject are likely to be correlated over time due to the existence of established programs and networking among students and institutions. The variable
  is a dichotomous variable that equals one for the period after the Brexit referendum (from 2017 onward), and zero otherwise.22 Note this dummy is not included separately in the model since it is naturally collinear with the year fixed effects. Similarly, the
  variable is a dummy equal to one if the data refer to international students from a country belonging to the EU bloc, and zero otherwise.
We are particularly interested in the coefficient  , which captures how international student applications from EU countries changed, relative to those of non-EU countries, from before to after the Brexit referendum. Equation (1) also contains subject of study and university-specific fixed-effects, which capture subject and university-specific time invariant factors in the data related to the popularity of a given university and area of study, as in the case of STEM fields in recent years. In addition, year fixed effects control for temporal variation in our outcome. In alternative model specifications, we experiment with including the size of the population aged 15 to 19 years old in each source country every year to account for changes in size of college-entry cohorts.2323 Our analysis focuses on the period 2013-2019. The differential impact of higher tuition fees introduced in 2012 for EU students applying to universities in England, Wales, and Northern Ireland, which others have pointed out as a potentially important driver in explaining applications (Sà, 2019), would be captured by university fixed effects. We estimate equation (1) by OLS and cluster standard errors at the country level to allow for within group correlation in standard errors (Bertrand et al., 2004).
6. Brexit and International Applications to UK Universities
6.1 Main Findings
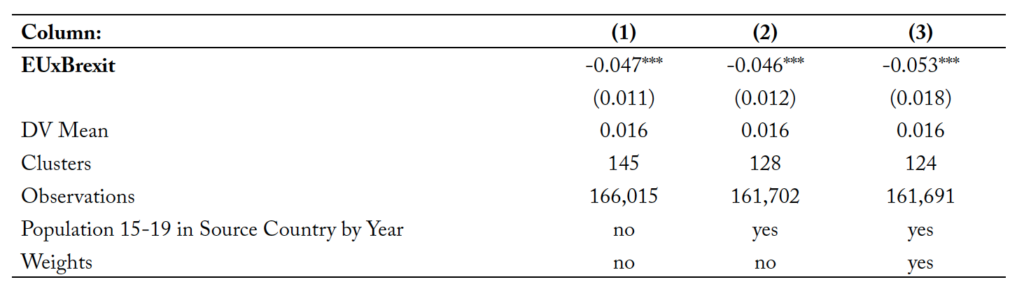
Table 2 reports the results from estimating three different specifications of equation (1). In column (1), we display the estimated impact from the benchmark specification reported in equation (1). In column (2), we include the size of the potential student cohort (age 15-19) in the source country in any given year as an additional control.2424 This variable corresponds to the size of the population of age 15 to 19 and it is obtained from the World Bank Database (https://databank.worldbank.org/source/world-development-indicators). Finally, in column (3), we take into the account the fact that growth rates might change more dramatically when the initial volume of international students in a cell is relatively small vs. large. Therefore, we use the number of applications by source country in the initial year as a weight.
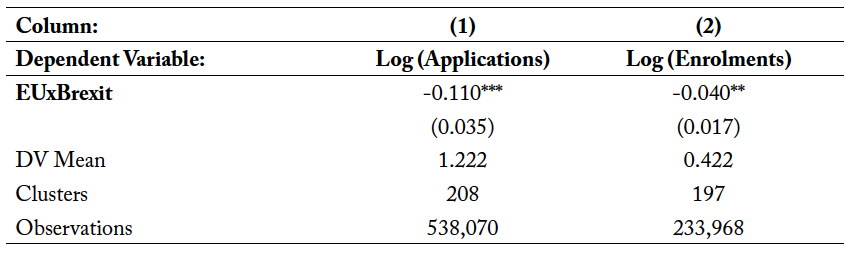
The estimated impact of the Brexit referendum on the growth rate of applications from EU students is consistently negative and statistically different from zero at the 1 percent level in all different specifications. Focusing on the most complete and preferred model specification (column 3), the Brexit referendum resulted in a 7 percent reduction in the growth rate of applications from the EU, when compared to those from non-EU students. To place our finding in context, we compare it to the impact of the 2012 tuition fee increase. Column 1 in Table B in the appendix displays the estimated impact of Brexit on applications using a model specification similar to the one used by Sà (2019) when examining the impact of the 2012 tuition fee increase. Brexit’s impact would be equivalent to about ¼ the effect of the 2012 tuition fee increase on applications from British students documented by Sà (2019). Because our sample differs from hers, we also gauge the impact of the 2012 tuition fee increase using our sample. The results, reported in Table C of the Appendix, show that the tuition fee increase (approximately a 167 percent expansion) brought about a 9 percent reduction in the growth rate of applications from EU students compared to non-EU students. Hence, Brexit would be equivalent to a 130 percent increase in tuition fees.
6.2 Identification and Robustness Checks
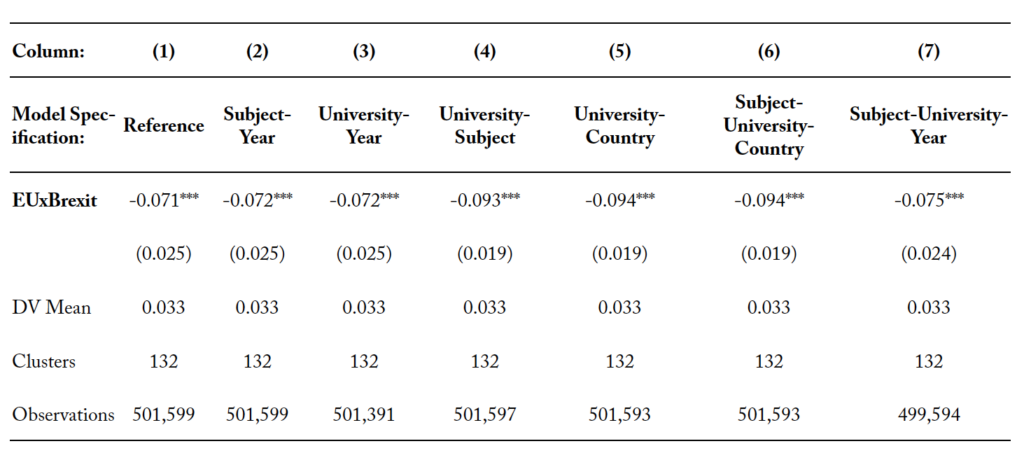
We conduct a series of robustness checks to further assess the reliability of our findings to the inclusion of additional two- and three-way fixed effects, and to the use of alternative samples. These are displayed in Tables 3A and 3B. Specifically, Table 3A shows the results from adding two- and three-way fixed effects. Column (1) displays our preferred estimates from Table 2, column (3), to serve as reference. Because our specification is the log difference of cells defined at the country-university-subject level between two consecutive years, the inclusion of two-way fixed-effects involving year-to-year variation at either the subject or the university level, as in columns (2) and (3) of Table 3A, naturally makes no difference on the estimated impact of Brexit. Similarly, the inclusion of three-way fixed effects capturing the year-to-year variation at the subject-university level in column (7) leaves the estimated impact of Brexit unchanged. A bit more interesting is the inclusion of two-way subject-university and university-country fixed effects in columns (4) and (5), respectively, as well as the inclusion of three-way subject-university-country fixed effects in column (6). Still, there is very little variation in the point estimates across these alternative specifications, suggesting that our results are not likely driven by the presence of confounders at the levels captured by those two- and three-way combinations.
To further assess if our results are driven by spurious correlations with unobserved factors, we also con- duct a series of placebo estimations in which we replace the treatment group with a placebo group each time obtained randomly drawing 27 countries from the pool of non-EU countries. Figure 2 shows the distribution of the difference-in-difference estimates resulting from such an exercise using 500 placebo replications, as well as the actual point estimate obtained from column (2) in Table 2.25Because we are working with cells, as opposed to individual records, we refrain from using weights. Accordingly, the estimate corresponds to that in column (2) of Table 2. Our expectation is that the actual estimate should fall in the far tail of the distribution of placebo estimates. This is confirmed by Figure 2. The placebo point estimates are centered around zero and fall within a 95 percent confidence interval band around zero, suggesting they are not statistically different from zero. In contrast, the actual point estimate falls to the left and well outside the 95 percent confidence interval band, suggesting that the estimated impact in Table 2 is not the byproduct of spurious correlations.
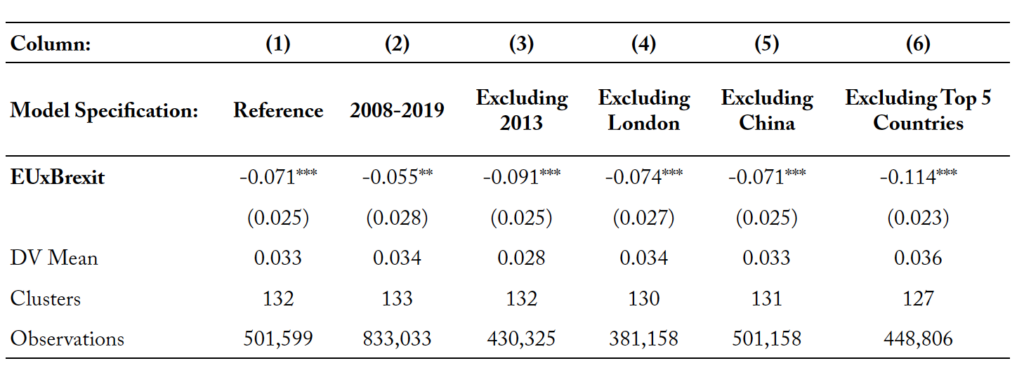
Next, in Table 3B, we further assess the robustness of our findings to alterations in the estimation sample. As before, column (1) in Table 3B shows our preferred estimates from Table 2, column (3), to serve as reference. Next, in column (2), we estimate our preferred specification using the larger dataset reported in Table 1 (2008-2019). As shown therein, while the effect reasonably drops as we extend the pre-Brexit period from three to eight years, we still observe a statistically significant and substantial reduction in the growth rate after Brexit of international student applications from EU countries of approximately 5.4 percent. Subsequently, in column (3), we experiment with excluding the first year of our sample –namely, 2013, which coincided with the year following the 2012 tuition fee increase. As can be seen therein, the estimated impact of Brexit would be somewhat higher, lowering the growth rate of applications by 9 percent. In column (4), we experiment with excluding London from our sample of study. London can be considered a special market for university students and less sensitive to Brexit. The point estimate remains practically unchanged, with Brexit reducing the growth rate of applications from EU countries when compared to international applications from elsewhere, by 7 percent. Finally, in the last two columns, we display the results when we exclude top senders of international students to the UK. First, we experiment with excluding China. As shown by the estimate in column (5), results prove remarkably robust. Subsequently, we repeat the analysis excluding the top 5 senders of international students to UK universities. As shown by the estimates in column (6), if anything, the impact of Brexit slightly rises, with Brexit lowering the growth rate of EU applications by 11 percent when compared to applications from other international students, ruling out that our findings are driven by simultaneous changes happening in large sending countries.
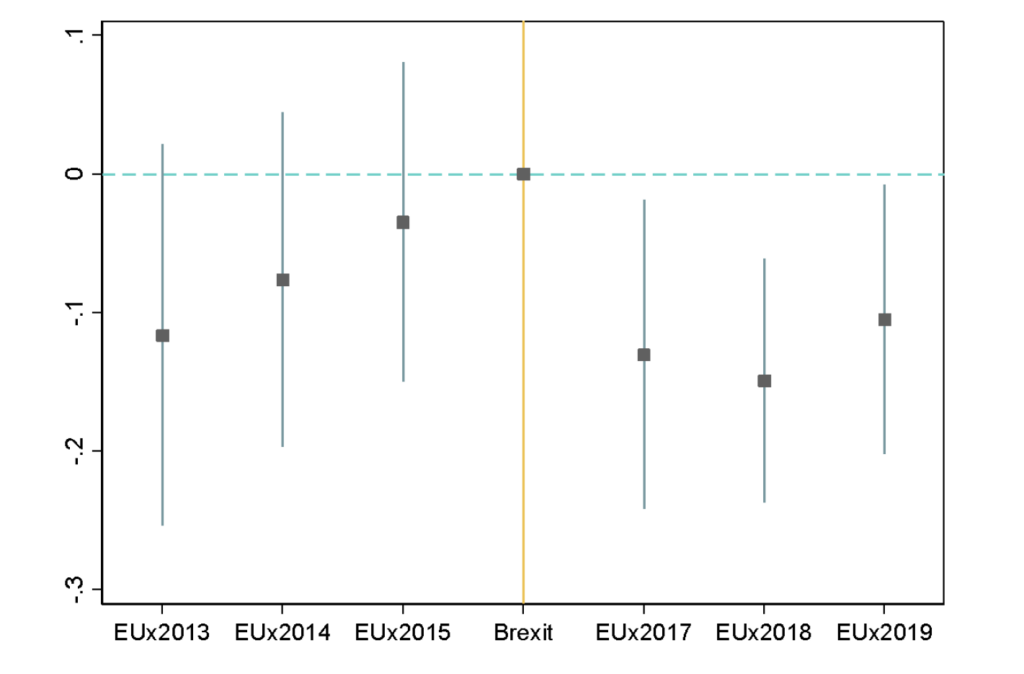
To conclude, we conduct an event-study type analysis to gauge the validity of the parallel trend assumption in applications from EU and non-EU students prior to the Brexit referendum, as well as to gauge potential dynamic effects. To that end, we explore trends in international student applications three years prior and three years after the Brexit referendum, as follows:26For consistency with our preferred specification, we control for the size of the population of age 15 to 19 in the source country by year and use the number of applications by country in the initial year as a weight.
(2) 
Each coefficient  should be interpreted with respect to the year 2016, the year when the referendum took place, which is the omitted interaction term. Figure 3 depicts the coefficient estimates for the treatment-year interaction terms (also reported in Table D in the appendix) along with their 95 percent confidence intervals. The estimates for the three years preceding the referendum are not distinguishable from zero, supporting the assumption of no pre-trends, the suitability of international students from non-EU countries as a control group, and the lack of anticipation effects which is consistent with the unexpected nature of the referendum results. In addition, there is a clear break in the trend in applications from international students from EU countries surrounding the referendum –a trend that prevails during the three successive years. The persistence of the plotted negative impact is suggestive of EU students’ preference to pursue their studies in the United Kingdom significantly changing on account of Brexit.
7. Heterogeneous Impacts
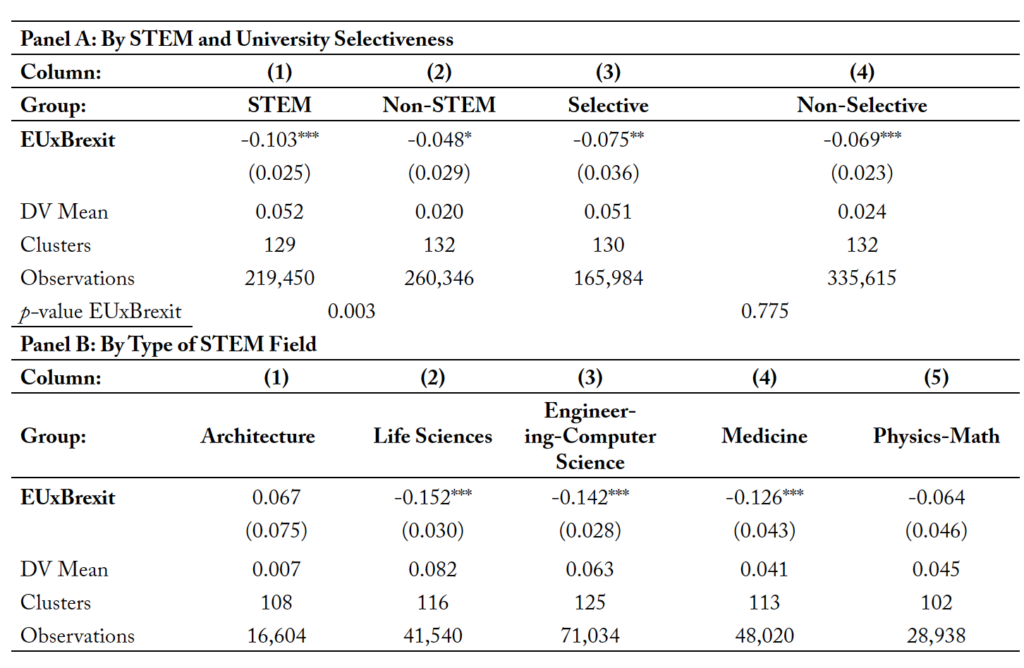
Thus far, the empirical evidence points to Brexit significantly curtailing applications to UK universities from EU students. As noted in the conceptual framework, Brexit might have also had a differential or heterogenous effect across subjects and universities based on their selectivity. Specifically, students applying to STEM programs, which have received much attention from policymakers in response to increased industry labor demands,27For example, in the United States, the Department of Homeland Security favoured the extension of the optional practical training (OPT) program –designed to provide international students with work experience in their fields– for students graduating in STEM fields through various reforms in 2008, 2011 and 2012. The reforms tried to accommodate increasing industry demands for STEM workers, who have been shown to boost local earnings and productivity (e.g. Moretti, 2004a, 2004b; Kantor and Whalley, 2014; Peri, Shih and Sparber, 2015). might enjoy additional schooling options. If STEM students can complete their studies somewhere else, where their future employment prospects have not been hindered by a recently curtailed ability to remain in the country upon completion of their studies, they may be less enticed to apply to UK universities. In that case, applications might have selectively declined to a greater extent among more sought-after students. The estimates in Panel A of Table 4 test that hypothesis. As predicted, Brexit appears to have had a larger impact on the growth rate of EU applications in STEM (10 percent reduction) when compared to non-STEM (5 percent drop).28We follow the Joint Academic Coding System ( JACS) definition of STEM subjects, which include: medicine, subjects allied to medicine, biological sciences, veterinary science, physical sciences, mathematical science, computer science, engineering, technology, architecture, building and planning. As indicated by the p-values of the difference between groups, we can reject the null hypothesis of both estimates being equal.
Next, in columns (3) and (4), we repeat the analysis distinguishing between applications to more vs. less selected universities.29Selective universities are defined according to the Russell Group, which includes 24 universities: University of Birmingham, University of Bristol, University of Cambridge, Cardiff University, Durham University, University of Edinburgh, University of Exeter, University of Glasgow, Imperial College London, King’s College London, University of Leeds, University of Liverpool, London School of Economics & Political Science, University of Manchester, Newcastle University, University of Nottingham, University of Oxford, Queen Mary, University of London, Queen’s University Belfast, University of Sheffield, University of Southampton, University College London, University of Warwick, and University of York. Brexit appears to have lowered the growth rate of EU applications to selective universities by 7.5 percent and by close to 7 percent among those applying to less selective universities. While slightly greater among selective institutions, the difference is not statistically different from zero, suggesting that while primarily concentrated in STEM, both selective and non-selective universities were similarly impacted by Brexit.
Finally, in Panel B of Table 4, we look more closely within specific STEM fields to gain a better understanding of those bearing the brunt of Brexit. As shown therein, applications to life sciences, engineering, computer science, and medicine dropped between 13 and 15 percent following Brexit.
In sum, Brexit has not only cut down the volume of international student applications across all institutions of higher education –selective and less selective but, in addition, it disproportionately impacted students in STEM fields. The disparate impact on this group of international students can have significant implications, given the positive externalities of STEM labor on local earnings and productivity (e.g. Moretti, 2004a, 2004b; Kantor and Whalley, 2014; Peri, Shih and Sparber, 2015), as well as the importance of international talent on innovation and growth (e.g. Hunt and Gauthier-Loiselle, 2010; Stuen et al., 2012; Migration Advisory Committee, 2018).
8. Mechanisms and Implications for Enrollment
To conclude, we explore potential mechanisms at play,then investigate if the observed reduction in applications ultimately translated into lower international enrollments. First, we focus on two potential determinants of changes in the volume of international student applications following Brexit: (1) psychological factors embodied in student perceptions of how pleasant their experience abroad might be, and (2) economic factors exemplified in student perceptions of what their chances to find employment in the United Kingdom might be after completing their studies. Both factors have been shown to be key in explaining international student flows. For instance, Hazen and Alberts (2006) note how feelings of disaffection are among the most important reasons for international students to return home. The increase in xenophobic crimes after the Brexit referendum would render support to that hypothesis (e.g. Devine, 2018; Carr et al., 2020).
Similarly, the literature has documented how students’ perceptions regarding their ability to work in the destination country after the completion of their studies can impact international student enrollments. Focusing on the United States, Kato and Sparber (2013) show that H-1B visa restrictions have had an adverse impact on the quality of prospective international applicants, whereas Shih (2016) shows how a lower H-1B visa cap negatively impacted international enrollments.30H-1B visas are one of the most common channels for international students with an F-1 visa to work in the United States after completing their studies and any intermediate optional practical training period. In a similar vein, Bhagwati and Rao (1999), Chiswick (1999), and Rosenzweig (2006), among others, emphasize how international student applications are often tied to the prospect of securing employment in the destination country.
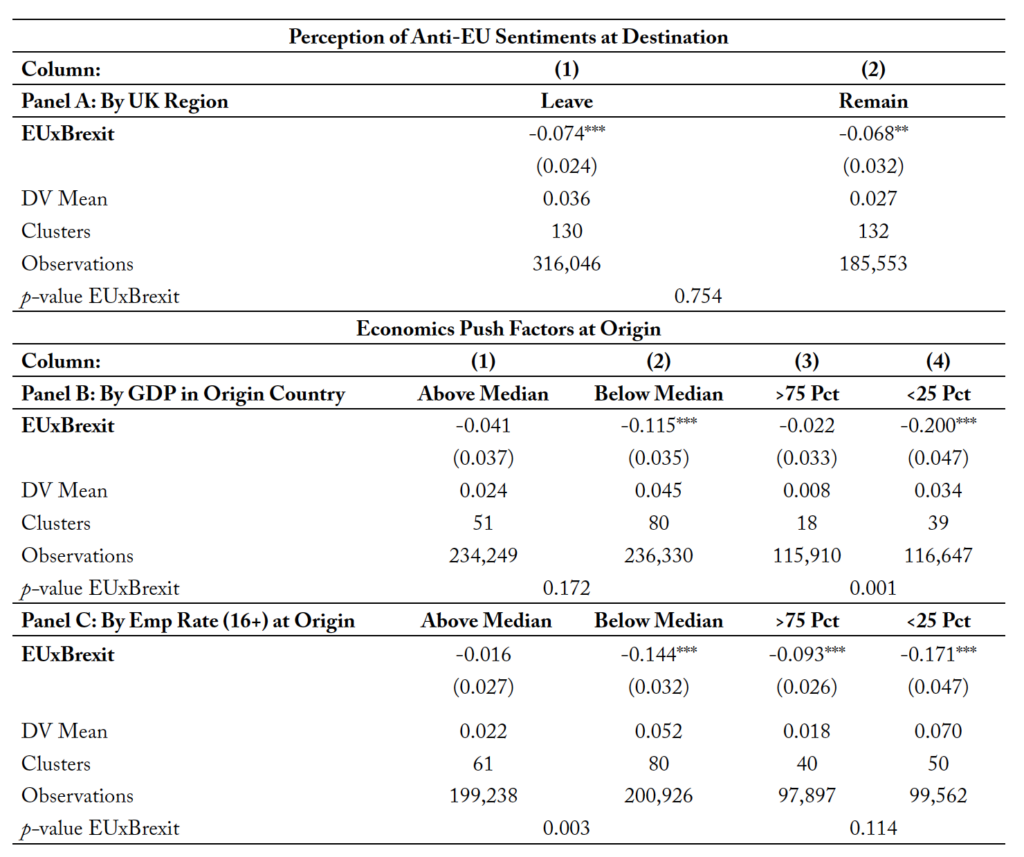
To gauge the role played by psychological factors, we examine if Brexit affected international student applications any differently in UK regions that voted to leave the EU, when compared to UK regions that voted to remain in the EU.31As Institutions based in London attract a very large share of applications (21 percent) and London voted to remain in the EU, on the contrary to England as a whole, we include London in the remain group. If international students fear the emergence of anti-immigrant sentiments in UK regions that voted to leave the EU, they might be less inclined to apply to universities in those regions, when compared to universities in other regions of the country. As can be seen in Panel A of Table 5, Brexit seems to have had a similar impact on EU student applications in both sets of regions, suggesting that the observed reduction was driven by reasons other than the friendliness of the environment to which students expect being exposed, or, alternatively, that students were not aware of different voting behavior across UK regions.
Subsequently, we consider the role of other elements impacted by Brexit –such as EU students’ ability to stay long-term in the United Kingdom after completing their studies. To that end, we investigate students’ countries of origin, looking for traits reflective of the labor market and economic opportunities students might enjoy back home. We settle for two well-recognized and comparable traits: employment to population ratios and per capita GDP.32We obtain data on unemployment rate and GDP per capita from the World Bank – World Development Indicators Database, available at: https://databank.worldbank.org/source/world-development-indicators/ (last accessed on May 24, 2021). If a key determinant of EU student applications to UK universities is their ability to live and work in the United Kingdom after completion of their studies, we would expect to observe a greater reduction in applications from EU students originating from countries with worse employment and economic prospects. Those students would have been more likely to apply to a UK university with the hope of staying to live and work in the United Kingdom upon completion of their studies, when compared to students from countries with better economic and employment opportunities, who might be more willing to return home.
Panels B and C in Table 5 explore the validity of the hypothesis stated above. In Panel B, we distinguish between students originating from countries with a GDP per capita that is above the median in that year and students from countries with a GDP per capita that is below that median.33Median and percentile values are computed separately for EU and non-EU countries. In addition, we compare applications originating from countries in the top (75th percentile) and bottom (25th percentile) of the GDP per capita distributions each year. Next, in Panel C, we differentiate between students originating from countries with employment to population ratios for individuals 16 years of age and older that are below vs. above the median in that year, as well as between students from countries in the top 75th vs. the bottom 25th percentile of the employment to population ratio distributions.
Brexit appears to have significantly lowered applications among students originating from countries with lower GDP per capita –by 11 percent for those from countries with rates below the median (column 2, Panel B) and by 20 percent for their counterparts from countries with rates below the 25th percentile (column 4, Panel B). Similarly, applications from EU countries dropped by 14 percent (column 2, Panel C) and 17 percent (column 4, Panel C) among students from countries with employment-to-population ratios below the median and below the 25th percentile, respectively. Yet, applications either remained stable or dropped by much less (9 percent) among their counterparts from countries with employment-to-population ratios above the median or the 75th percentile, correspondingly.34As indicated by the p-values, differences between the two sets of coefficient estimates were overall statistically different from zero. Overall, the differential impact of Brexit on applications based on the source country’s labor market and economic prospects point to the potential relevance of curtailed opportunities to live and work in the United Kingdom after students complete their studies as a potential cause for the decline in applications.
To conclude, we explore the implications of Brexit on international student enrollments. As noted earlier, while the drop in international student applications is worrisome, it is possible for Brexit to have no significant impact on final enrollments if, for example, applications far exceed admissions or universities raise admission rates to counteract a decline in student applications. Hence, using the same specifications as in Table 2, we estimate the impact of Brexit on the growth rate of international student enrollments.35 We estimate the effect of Brexit on enrollment conditional on applying, discarding cells with no applications. Table 6 shows the results of this exercise. As with applications, results are rather consistent across the three model specifications. Focusing on our preferred model in column (3), we document a 5 percent reduction in international student enrollments after Brexit.36Column 2 in Table B in the appendix reports similar impacts if we use a log-level specification. In other words, Brexit appears to have lowered international student applications enough to curtail enrollments. At the same time, given that the effect on enrollment is lower than the effect on applications (5 vs. 7 percent reduction), universities might have raised admission rates because of reduced applications. After all, enrollments are the byproduct of university offers and student acceptances. If, in accordance to their exhibited application patterns, students were not more likely to accept a university offer, the lower impact of Brexit among enrollments might be reflective of an increase in admission rates by universities. Alternatively, universities might have reacted by increasing funding opportunities targeted to attracted EU students (e.g. fee waiver).
9. Summary and Conclusions
We explore the impact that the 2016 Brexit referendum has had on international student applications from EU country members. Our findings suggest that students reacted strongly to the changing international environment, with the growth rate of applications declining by 7 percent when compared to the growth of international applications originating from non-EU members. This effect, which appears robust to several robustness and identification checks, has affected similar applications in selective vs. less selective institutions of higher education. Nevertheless, it has taken a larger toll on applications from students pursuing STEM studies in life sciences, engineering, computer science and medicine, suggesting these students might enjoy better alternatives elsewhere.
We also explore alternative mechanisms at play. First, we consider the possibility of EU students’ perception of increased discrimination towards EU nationals in UK regions that voted to leave the EU. However, we find similar impacts of Brexit across UK regions, suggesting that psychological factors related to the welcoming environment students perceive in regions that voted to leave vs. to remain in the EU are not playing a decisive role in their decision to apply. Second, we explore the role that changing student incentives driven by diminished opportunities to work and live in the United Kingdom might be playing in their decision to apply to a UK university. We find that applications dropped the most among EU students originating from countries with lower per capita GDP and employment rates –students for whom the ability to live and work in the United Kingdom upon completion of their studies might have been an important pull factor. These findings point to deteriorating prospects as potential drivers behind EU students’ application responsiveness.
Lastly, we investigate how changes in international student applications might have ultimately impacted international student enrollments. We find that the reduction in student applications resulted in fewer international enrollments –even though the reduction was not seemingly as large as the one observed for applications.
In sum, as free labor mobility disappears and employment opportunities shrink, EU students with potentially better alternatives –as in the case of STEM students– and fewer employment options back home significantly curtailed their applications. These students are those for whom the ability to live and work in the UK after completing their studies might have been an important pull factor to studying there. The documented impacts are worrisome. There are non-negligible, reduced enrollments despite universities’ potential responses raising admission rates or increasing funding targeted to EU students. In addition, the results are suggestive of selective patterns affecting, in particular, STEM applicants –patterns that can have significant implications for innovation and economic growth (Migration Advisory Committee, 2018).
Given the contributions of international student exchanges to research and development, as well as the United Kingdom’s ranking as the second most frequent destination for international students with 36 percent of them originating from EU country members (HESA, 2020), further research on the implications of Brexit for UK universities and the ability to attract and retain valuable talent is well-warranted.
Appendix
Table 1. Growth Rate of Applications by Student Origin
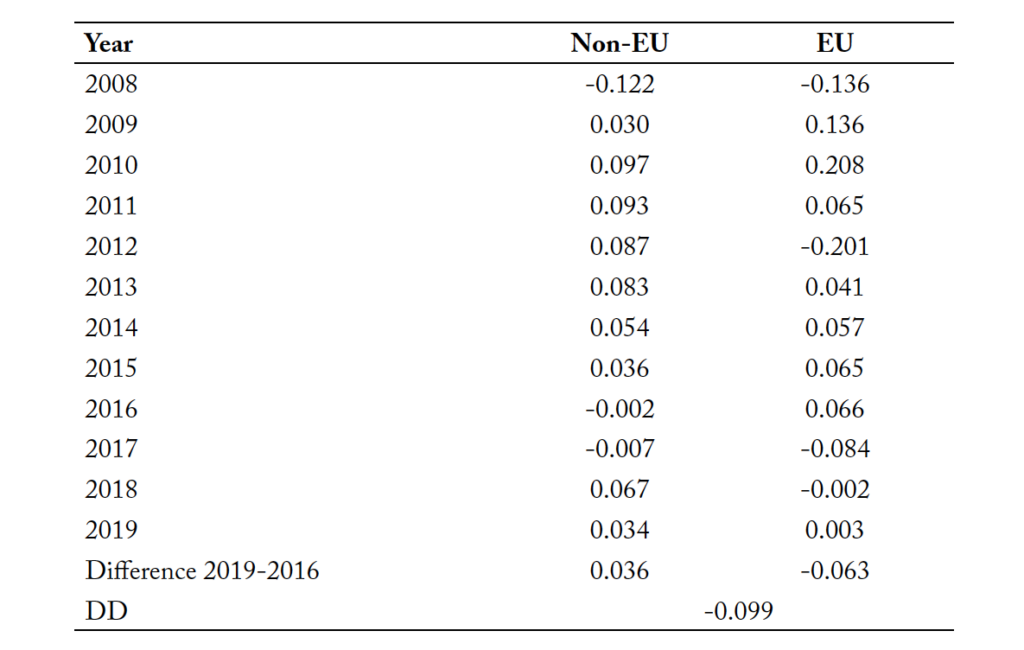
Notes: The table shows the growth rate in applications across two consecutive years by source country, subject, and university. The growth rate is computed by taking the first difference of the inverse hyperbolic sine transformation of applications by cell. Each cell is weighted by the number of applications by country in the initial year.
Table 2. The Impact of Brexit on EU Applications
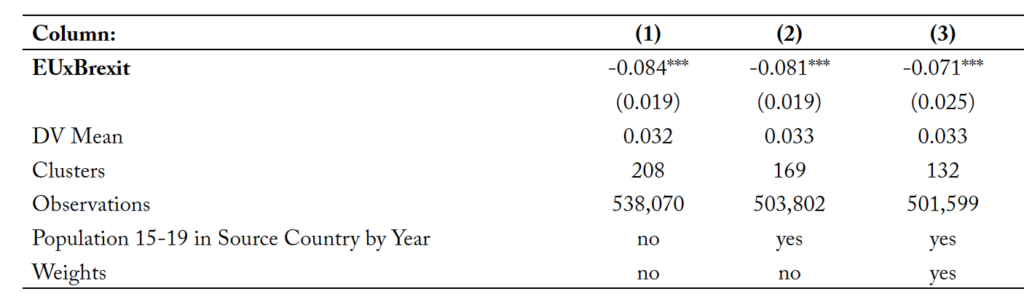
Notes: The dependent variable is the growth rate in applications across two consecutive years by source country, subject, and university. The growth rate is computed by taking the first difference of the inverse hyperbolic sine transformation of applications by cell. Brexit refers to an indicator set equal to one for all years after 2016. Additional regressors include an EU dummy, subject, university, and year fixed effects. Each cell is weighted by the number of applications by country in the initial year. Standard errors in parentheses are clustered at country level. Significance levels are given by: * p<0.10, ** p<0.05, *** p<0.01.
Table 3A. Robustness Checks #1 – Adding Two- and Three-Way Fixed Effects
Notes: The dependent variable is the growth rate in applications across two consecutive years by source country, subject, and university. The growth rate is computed by taking the first difference of the inverse hyperbolic sine transformation of applications by cell. Brexit refers to an indicator set equal to one for all years after 2016. Additional regressors include an EU dummy, subject, university, and year fixed effects, as well as the population 15-19 years old in the source country by year. Each cell is weighted by the number of applications by country in the initial year. Standard errors in parentheses are clustered at country level. Significance levels are given by: * p<0.10, ** p<0.05, *** p<0.01.
Table 3B. Robustness Checks #2 – Using Alternative Samples
Notes: The dependent variable is the growth rate in applications across two consecutive years. The growth rate is computed by taking the first difference of the inverse hyperbolic sine transformation of applications by cell. Brexit refers to an indicator set equal to one for all years after 2016. Additional regressors include an EU dummy, subject, university, and year fixed effects, as well as the population 15-19 years old in the source country by year. All regressions are weighted by the number of applications from a particular country to UK universities in the initial year. Significance levels are given by: * p<0.10, ** p<0.05, *** p<0.01.
Table 4. Heterogeneous Effects. The Impact of Brexit on EU Application by Subject Area and University Type
Notes: The dependent variable is the growth rate in applications across two consecutive years by source country, subject, and university. The growth rate is computed by taking the first difference of the inverse hyperbolic sine transformation of applications by cell. Brexit refers to an indicator set equal to one for all years after 2016. Additional regressors include an EU dummy, subject, university, and year fixed effects, as well as the population 15-19 years old in the source country by year. Each cell is weighted by the number of applications by country in the initial year. Standard errors in parentheses are clustered at country level. Significance levels are given by: * p<0.10, ** p<0.05, *** p<0.01.
Table 5. Mechanisms
Notes: The dependent variable is the growth rate of applications across two consecutive years by source country, subject, and university. The growth rate is computed by taking the first difference of the inverse hyperbolic sine transformation of applications by cell. Brexit refers to an indicator set equal to one for all years after 2016. Additional regressors include an EU dummy, subject, university, and year fixed effects, as well as the population 15-19 years old in the source country by year. Each cell is weighted by the number of applications by country in the initial year. Panel A shows the results by UK region where the university is located. Column (1) shows the results for applications to UK universities in regions that voted to leave the EU, whereas column (2) refers to applications to UK universities in regions that voted to remain in the EU. Panel B shows the results by country-of-origin per capita GDP. Column (1) shows the estimated Brexit impact for applications from countries with annual GDP per capita above the median value, and column (2) does it for applications from countries with an annual GDP per capita below the median. Columns (3) and (4) refer to applications from countries with annual GDP per capita above the 75th percentile and below the 25th percentile, respectively. Panel C shows the results by country-of-origin employment to population ratio for individuals 16 years of age and older. Specifically, column (1) shows the estimated Brexit impact for applications from countries with employment rate above the median value in any given year, whereas column (2) does it for applications from countries with employment rate below the median value in any given year. Columns (3) and (4) refer to applications from countries with annual employment rates above the 75th percentile and below the 25th percentile, respectively. Median values and percentiles are computed separately for EU and non-EU countries. Standard errors in parentheses are clustered at country level. Significance levels are given by: * p<0.10, ** p<0.05, *** p<0.01.
Table 6. Implications: The Impact of Brexit on EU Enrolments Conditional on Applying
Notes: The dependent variable is the growth rate in enrolments across two consecutive years by source country, subject, and university. The growth rate is computed by taking the first difference of the inverse hyperbolic sine transformation of applications by cell. Cells with zero applications are discarded. Brexit refers to an indicator set equal to one for all years after 2016. Additional regressors include an EU dummy, subject, university, and year fixed effects. Each cell is weighted by the number of applications by country in the initial year. Standard errors in parentheses are clustered at country level. Significance levels are given by: * p<0.10, ** p<0.05, *** p<0.01.
Figure 1. Total Applications by Student Origin and Over Time
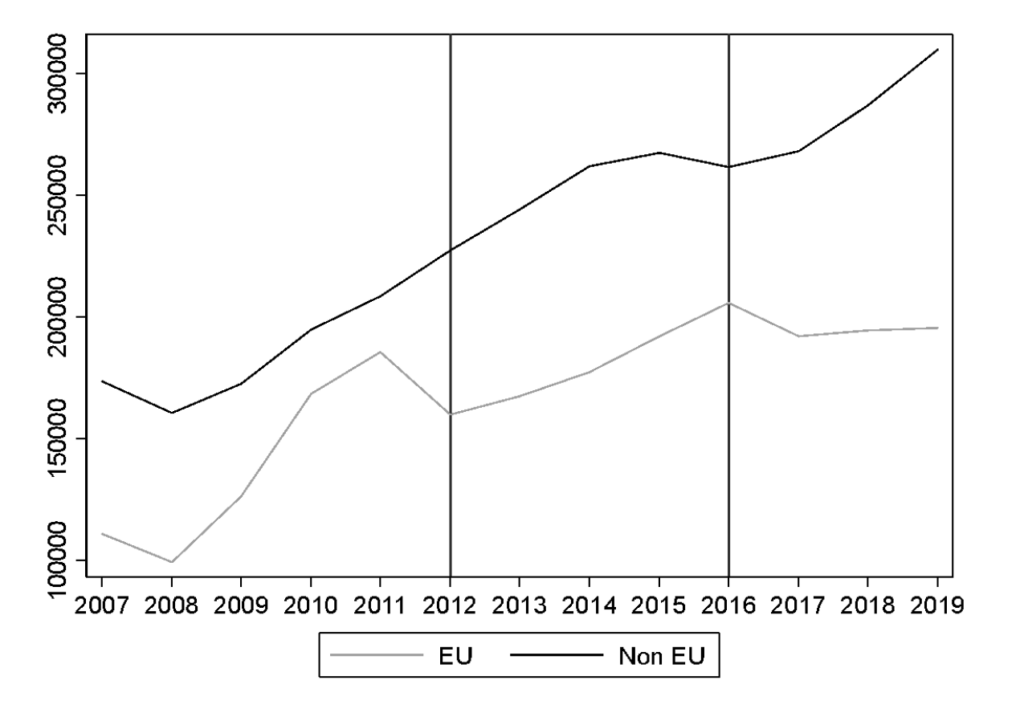
Notes: This figure shows total applications by EU vs non-EU group over time.
Figure 2. Robustness Check: Histogram of Placebo Estimates
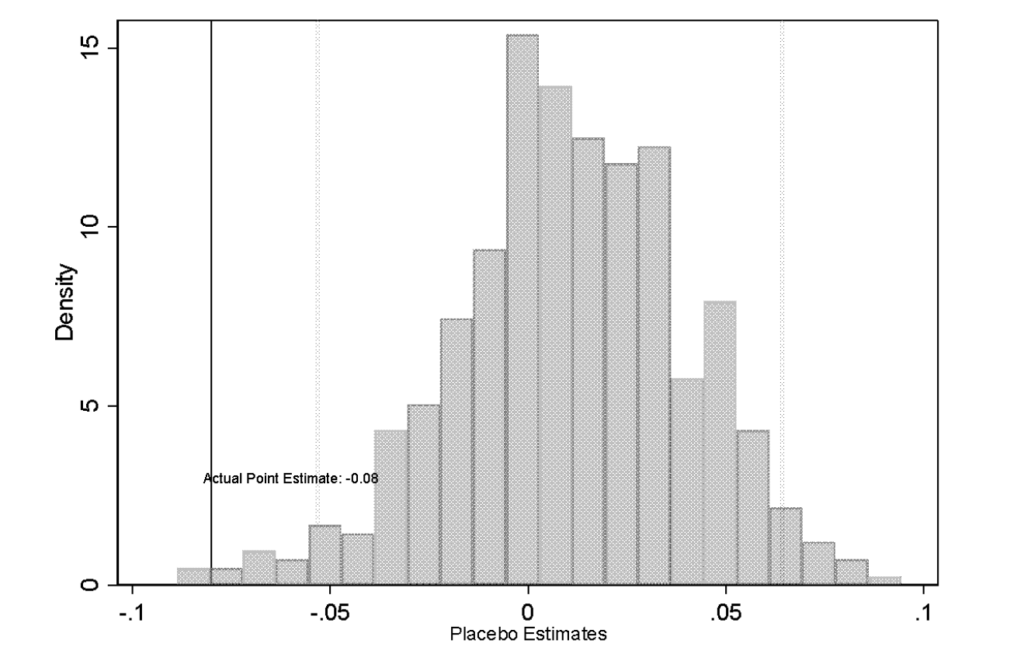
Notes: This figure shows the distribution of the coefficients obtained from 500 placebo regressions using our baseline specification (Table 2, column 2) and where the treated group has been randomly drawn from the group of non-EU countries. The dark vertical line refers to the actual point estimate reported in Column (2) of Table (2), whereas the two light grey lines refer to the 95 % confidence interval.
Figure 3. Treatment-by-Year Plot
Notes: The figure shows the coefficients of the interaction of leads and lags of the variable EUxYear, which is equal to one in the year indicated for EU applicants, and zero otherwise. The dependent variable is defined as in Table 2. The model specification is described in eq. (2). The growth rate is computed by taking the first difference of the inverse hyperbolic sine transformation of applications by cell. Additional regressors include an EU dummy, subject, university, and year fixed effects. Each cell is weighted by the number of applications by country in the initial year. Solid lines refer to regression coefficients, dotted lines refer to 95% confidence intervals obtained using clustered standard errors at country level.
Table A. Total Applications by British vs non-British
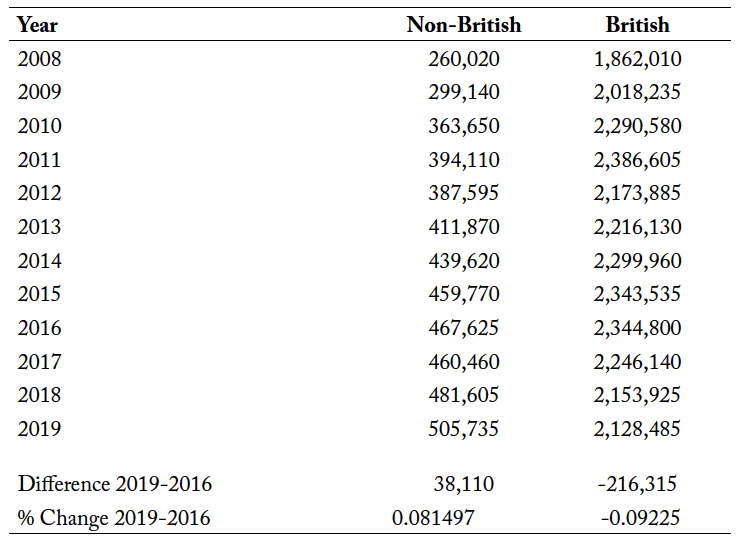
Notes: The table shows total applications by year and British vs non-British.
Table B. The Impact of Brexit on EU Applications and Enrolments
Notes: The dependent variable is the inverse hyperbolic sine transformation of applications by source country, subject, and university. Brexit refers to an indicator set equal to one for all years after 2016. Additional regressors include an EU dummy, subject, university, and year fixed effects, as well as subject, university, and country time trends. Standard errors in parentheses are clustered at country level. Significance levels are given by: * p<0.10, ** p<0.05, *** p<0.01.
Table C. Effect of 2012 Tuition Fee Raise
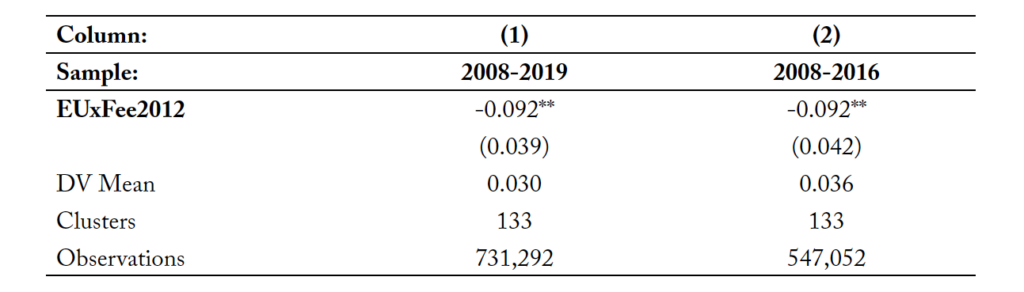
Notes: The dependent variable is the growth rate in applications across two consecutive years by source country, subject, and university. The growth rate is computed by taking the first difference of the inverse hyperbolic sine transformation of applications by cell. Fee2012 refers to an indicator set equal to one for all years after 2011. Additional regressors include an EU dummy, subject, university, and year fixed effects. Each cell is weighted by the number of applications by country in the initial year. Standard errors in parentheses are clustered at country level. Significance levels are given by: * p<0.10, ** p<0.05, *** p<0.01.
Table D. Treatment-by-Year Analysis of Brexit on EU Applications
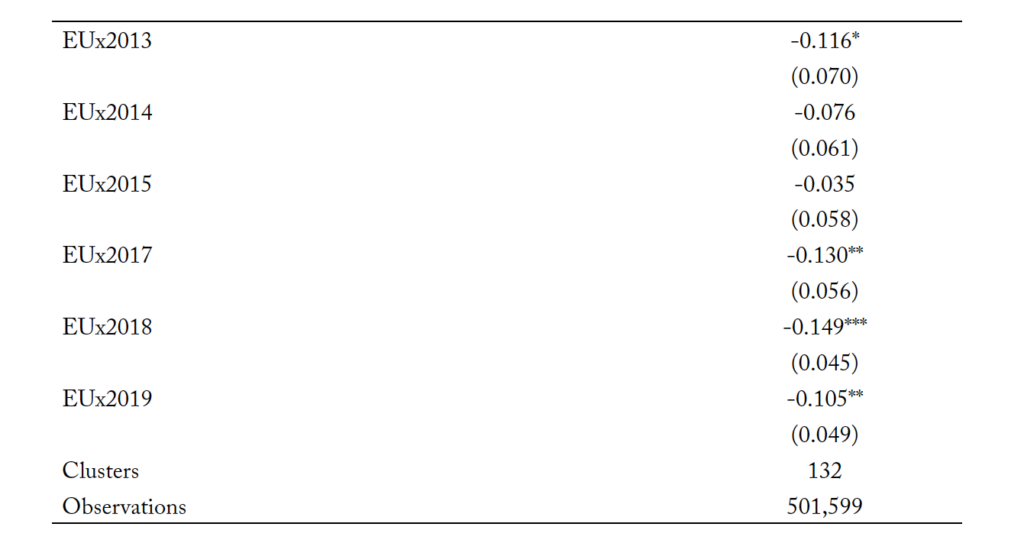
Notes: The dependent variable is the growth rate in applications across two consecutive years by source country, subject, and university. The growth rate is computed by taking the first difference of the inverse hyperbolic sine transformation of applications by cell. Leads and lags of EUxYear are equal to one in the year indicated for EU applicants, and zero otherwise. Additional regressors include an EU dummy, subject, university, and year fixed effects, as well as the population 15-19 years old in the source country by year. Each cell is weighted by the number of applications by country in the initial year. Standard errors in parentheses are clustered at country level. Significance levels are given by: * p<0.10, ** p<0.05, *** p<0.01.
References
Anderson, E. (2017). UK plans to cut back on EU migrants post Brexit: Report. Retrieved from http:// www.politico.eu/article/uk-eu-migrants-brexit-plans-to-cut-back-on-post-brexit-report/
Baer, J. (2017). Fall 2017 international student enrollment hot topics survey. IEE Center for Academic Mobility Research and Impact. Retrieved from https://www.iie.org/Research-and-Insights/Open-Doors/Data/Fall-International-Enrollments-Snapshot-Reports.
Becker, S. O., Fetzer, T., & Novy, D. (2017). Who voted for Brexit? A comprehensive district-level analysis. Economic Policy, 32(92), 601-650.
Bertrand, M., Duflo, E., & Mullainathan, S. (2004). How much should we trust differences-in-differences estimates?. The Quarterly journal of economics, 119(1), 249-275.
Bhagwati, J., & Rao, M. (1999). Foreign students in science and engineering Ph. D. programs: An alien invasion or brain gain. Foreign temporary workers in America: Policies that benefit the US economy, 238- 258.
Born, B., Müller, G. J., Schularick, M., & Sedláček, P. (2019). The costs of economic nationalism: evidence from the Brexit experiment. The Economic Journal, 129(623), 2722-2744.
Bound, J., Braga, B., Khanna, G., & Turner, S. (2020). A Passage to America: University Funding and International Students. American Economic Journal: Economic Policy, 12(1), 97-126.
Breinlich, H., Leromain, E., Novy, D., & Sampson, T. (2020). Voting with their money: Brexit and out- ward investment by UK firms. European Economic Review, 124, 103400.
Carr, J., Clifton-Sprigg, J., James, J., & Vujic, S. (2020). Love Thy Neighbour? Brexit and Hate Crime (No. 13902). Institute of Labor Economics (IZA).
Chellaraj, G., Maskus, K. E., & Mattoo, A. (2008). The contribution of international graduate students to US innovation. Review of International Economics, 16(3), 444-462.
Chiswick, B. R. (1999). Policy analysis of foreign student visas. Foreign temporary workers in America, 211-223.
Devine, D. (2018). The UK referendum on membership of the European Union as a trigger event for hate crimes. Available at SSRN 3118190.
Duncan, P. (2016). How the pollsters got it wrong on the EU referendum. The Guardian.
Dustmann, C., Fadlon, I., & Weiss, Y. (2011). Return migration, human capital accumulation and the brain drain. Journal of Development Economics, 95(1), 58-67.
Falkingham, J., Giulietti, C., Wahba, J., & Wang, C. (2019). The Impact of Brexit on International Stu- dents’ Return Intentions.
Gelber, A. M. (2011). How do 401 (k) s Affect Saving? Evidence from Changes in 401 (k) Eligibility. American Economic Journal: Economic Policy, 3(4), 103-22.
Hazen, H. D., & Alberts, H. C. (2006). Visitors or immigrants? International students in the United States. Population, Space and Place, 12(3), 201-216.
HESA. (2020). Graduate activities and characteristics (Table 28). Retrieved June 8, 2021, from https://www.hesa.ac.uk/data-and-analysis/graduates/activities;” https://www.hesa.ac.uk/data-and-analysis/students/table-28.csv.
Hunt, J., & Gauthier-Loiselle, M. (2010). How much does immigration boost innovation?. American Economic Journal: Macroeconomics, 2(2), 31-56.
Kantor, S., & Whalley, A. (2014). Knowledge spillovers from research universities: evidence from endowment value shocks. Review of Economics and Statistics, 96(1), 171-188.
Kato, T., & Sparber, C. (2013). Quotas and quality: The effect of H-1B visa restrictions on the pool of prospective undergraduate students from abroad. Review of Economics and Statistics, 95(1), 109-126.
Korn, M. (2017). Foreign Student Surge Starts to Ease Off. Wall Street Journal, 13.
Liberini, F., Oswald, A. J., Proto, E., & Redoano, M. (2019). Was Brexit triggered by the old and unhappy? Or by financial feelings?. Journal of Economic Behavior & Organization, 161, 287-302.
Meckler, L., & Korn, M. (2018). Visas Issued to Foreign Students Fall, Partly Due to Trump Immigration Policy, the Wall Street Journal, March 11, 2018.
Migration Advisory Committee. (2018). Impact of International Students in the UK. Retrieved from https://www.gov.uk/government/organisations/migration-advisory-committee
Moretti, E. (2004a). Estimating the social return to higher education: evidence from longitudinal and repeated cross-sectional data. Journal of econometrics, 121(1-2), 175-212.
Moretti, E. (2004b). Workers’ education, spillovers, and productivity: evidence from plant-level production functions. American Economic Review, 94(3), 656-690.
Organisation for Economic Co-operation and Development. (2013). How is international student mobility shaping up?. OECD Publishing.
ONS. (2017). National Population Projections: 2016-based statistical bulletin. Retrieved from https:// www.ons.gov.uk/peoplepopulationandcommunity/populationandmigration/populationprojections/bulle- tins/nationalpopulationprojections/2016basedstatisticalbulletin
Peri, G., Shih, K., & Sparber, C. (2015). STEM workers, H-1B visas, and productivity in US cities. Journal of Labor Economics, 33(S1), S225-S255.
Rosenzweig, M. R., Irwin, D. A., & Williamson, J. G. (2006, January). Global wage differences and inter- national student flows [with comments and discussion]. In Brookings trade forum (pp. 57-96). Brookings Institution Press.
Shih, K. (2016). Labor market openness, h‐1b visa policy, and the scale of international student enroll- ment in the United States. Economic Inquiry, 54(1), 121-138.
Spires-Jones, T. (2018). Scottish Science Advisory Council: Reaction to the UK Government Office for Science Foresight report “Future of an Ageing Population”. Retrieved from https://www.research.ed.ac.uk/ en/activities/scottish-science-advisory-council-reaction-to-the-uk-government-o
Stuen, E. T., Mobarak, A. M., & Maskus, K. E. (2012). Skilled immigration and innovation: evidence from enrolment fluctuations in US doctoral programmes. The Economic Journal, 122(565), 1143-1176.
UCAS. (2017, February 06). Applicants for UK higher education down: 5% for UK students and 7% for EU students. Retrieved from https://www.ucas.com/corporate/news-and-key-documents/news/applicants-uk-higher-education-down-5-uk-students-and-7-eu-students