


1 Introduction
The demographics of many developed countries have been transformed through immigration in recent decades, which has made immigration one of the most controversial and increasingly important topics in the public discourse as well as in public policy. In recent years, the issue of immigration has garnered increased attention. Immigration has become increasingly politicized in Western countries and political parties hold divergent views on how to best deal with this issue (Hout and Maggio 2021; Grande, Schwarzbözl, and Fatke 2019; Baker and Edmonds 2021).
As of 2021, with more than 8.3 million immigrants (almost 23 percent of its population), Canada has the highest proportion of immigrants since Confederation, and the largest proportion among G7 countries (Statistics Canada 2022a). Immigrants represent a growing percentage of the country’s total population and are responsible for more than 70 percent of the total population growth from 2016 to 2021 (Statistics Canada 2022a). During the same period, 80 percent of the growth in labor force in Canada was driven by immigration.
Several studies have highlighted that, despite Canada’s long history of immigration and its reputation for celebrating diversity and holding pride in its cultural mosaic, Canadians have not always agreed on what constitutes an appropriate level of immigration (e.g., Banting and Soroka 2020; Besco and Tolley 2018; Bilodeau, Turgeon, and Karakoç 2012; Donnelly 2017). More recently, especially during both the 2015 and 2019 federal elections, debate about immigration entered political campaigns as a wedge issue (Banting and Soroka 2020; Kheiriddin 2019). Moreover, there has also been recent evidence of pandemic-related racism and violence against immigrants and racialized groups in Canada (e.g., Lee and Johnstone 2021; Miconi et al. 2021; Statistics Canada 2020).
The second half of 2023 have seen a noticeable trend of increasingly rigid attitudes toward immigration in Canada (Environics Institute 2023; Perez 2023). This change in public sentiment regarding immigration in Canada raises questions about the potential emergence of immigration as a prominent political issue in the country. As more attention is focused on the issue, political polarization has intensified surrounding the topic of immigration. This has led to increased debate and division within Canadian society about the appropriate level of immigration and how to address related challenges. The escalation of rigid attitudes could suggest a significant shift in public sentiment regarding immigration, signifying the need for further exploration into this evolving issue.
Given the importance of understanding attitudes toward immigration (ATI, hereinafter) and its growing influence on Canada’s political and social landscape, there has been a notable expansion in the literature on ATI over the last decade. While the existing literature provides valuable insights into ATI in Canada, there are still crucial questions that merit additional investigation. In this paper, we rely on more than three decades of data (1988 to 2019) from the Canadian Election Studies (CES) to examine how ATI have changed in Canada over time.
The CES provides the largest amount of reliable data on Canadians’ ATI (White et al. 2008). The richness of the CES data allows us to contribute to this literature by examining the underpinnings of ATI in Canada. It is important, both for descriptive political economy and for policy design, to understand and disentangle the different factors that could influence ATI. This helps clarify who supports which immigration policies and why. This greater understanding informs the design and the development of policies and practices that could help improve Canada’s social climate and cohesion to build a more tolerant and equitable society.
Previous literature in Canada indicates that ATI have gone through significant changes during the last few decades (Banting and Soroka 2020; Besco 2021; Harell 2009; Wilkes and Corrigall-Brown 2011; Wilkes, Guppy, and Farris 2008). The novelty of our analysis and findings in improving the understanding of ATI is twofold. First, we update the trends in the evolution of ATI in Canada and to the best of our knowledge are the first to document that negative ATI (i.e., the proportion of Canadians who prefer fewer immigrants) have significantly increased since 2008.1Besco (2021) also documents an increase, albeit less pronounced, in anti-immigration sentiments in recent years using the CES surveys. Second, our study is the first to examine the impact of a wide range of economic, sociopsychological, and political or ideological factors in shaping ATI. We also use a variance decomposition method to directly compare the relative importance of different factors in explaining variations in ATI among Canadians and how that importance changes over time. Most studies on ATI in Canada focus on a limited set of potential explanatory variables and do not compare the relative influence of these different explanatory variables on ATI.
Our results suggest that contrary to some recent studies in Canada (e.g., Banting and Soroka 2020), and in line with studies from other countries (e.g., Card, Dustmann, and Preston 2005; Dustmann and Preston 2007), when a wider range of factors is considered, factors such as unemployment rate and immigration intake have a relatively smaller impact on ATI. In contrast, our results are consistemt with the significant role of sociopsychological factors in shaping ATI in Canada. We also document that over the last decade, political party identification has become the most important factor in explaining variations in ATI in Canada.
The remainder of the paper proceeds as follows. Section 2 provides an interdisciplinary overview of different theories as well as empirical findings regarding the role of different factors in influencing ATI. Section 3 describes our data and sample characteristics. Section 4 presents and discusses our results. Section 5 concludes.
2 Drivers of Public Attitudes toward Immigration
This section aims to provide an interdisciplinary analysis of the existing literature to offer an overview and establish a framework that organizes the diverse explanations for the mechanisms influencing ATI. While the empirical analysis that ensues in following chapters is not rigidly bound to this framework, the discussions here will serve as a guiding structure.
There are different methods for organizing various narratives that seek to explain factors that shape ATI. One particularly insightful approach involves categorizing them into the following three groups.2It is important to note that while these three groups represent distinct concepts, the boundaries become blurred in certain contexts. The first group comprises individualistic rational choice models of material self-interest and labor market competition popularized by neoclassical economists (e.g., Mayda 2006; Scheve and Slaughter 2001; Simon 1989). These models suggest that ATI are mainly driven by individual self-interested motivations and reactions to economic impacts of immigrants on their wages, employment opportunities, or taxes paid and benefits received (i.e., public finances).
Aligned with the prevailing narrative of neoclassical economics, this perspective conceptualizes individuals as autonomous rational optimizers, removing historical and social contexts from economic analysis by detaching the economic market from the society (Fine and Milonakis 2009). Consequently, crucial inquiries that should constitute the core of comprehending public opinion on immigration—including how individuals perceive the relationship between immigration and their economic well-being, and how political and economic contexts shape these perceptions—are largely ignored within this framework.
The second group includes models that highlight the importance of what is referred to as sociotropic concerns (e.g., Citrin et al. 1997; Bilodeau, Turgeon, and Karakoç 2012; Dancygier and Donnelly 2013; Hainmueller and Hiscox 2010; Hainmueller and Hopkins 2014; Meuleman, Davidov, and Billiet 2009; Quillian 1995). These models are typically understood to underscore the role of unprejudiced or race-neutral group-level considerations related to immigration, such as the perceived impact on the overall economy, job market, or public resources. These concerns are broader in scope and often involve assessments of how immigration may affect the welfare of the larger community or society (Solodoch 2021). This second group of models are in line with Realistic Group Conflict Theory (Bobo 1983; Campbell 1965; LeVine and Campbell 1972; Sherif 1966) which stresses the intergroup competition over real material interests and the desire to be materially better off as the driving motivation behind intergroup dynamics and conflicts.
The third group consists of sociopsychological models that emphasize the perception of group interests related to group identities, affinities, animosities, group-based selective altruism and empathy, or values and norms in shaping ATI. These models highlight the role of factors such as symbolic threat, intergroup anxiety, and group position and privileges as driving forces behind intergroup dynamics and out-group prejudice. There are several theories that could be categorized under this third group of models. Social identity theory (Tajfel 1979, 1982; Tajfel and Turner 1986) is perhaps one of the most prominent theories in this category. It posits that a fundamental aspect of individuals’ self-concept is derived from the groups to which they belong or with which they identify (i.e., social identification).3Intergroup or integrated threat theory (Stephan and Stephan 1996; Stephan et al. 1998) and group threat theory (Blumer 1958) are other theories that could be categorized under this group. It is also important to note that there exists some overlap between these different theories.
According to social identity theory, individuals categorize not only themselves but also others. Social categorization entails identifying culturally meaningful ways of categorizing people and therefore often employs symbols that serve as conventional social categories and which are linked to race, ethnicity, nationhood, religion, and so on. The interplay between social identification and social categorization results in the creation of an in-group versus an out-group, based on categories or symbols identified for social categorization. Coupled with the desire for positive self-image and own-group positivity bias, this motivates social comparison, which often leads to attaching negative properties to out-group members and positive properties to in-group members. Not surprisingly, the attached negative properties make the members of the in-group prone to anticipating threats from the out-group, which gives rise to group-level prejudice, negative stereotypes, and discrimination (Morrison, Fast, and Ybarra 2009; Myers et al. 2013; Stephan et al. 2005).
Adjudicating on these three models is beyond the scope of this study. However, growing systematic evidence seems to suggest that more attention needs to be paid to the role of noneconomic factors, especially prejudiced group-level factors stressed by the third group of models discussed above. More specifically, a three-dimensional picture seems to emerge from growing empirical evidence based on bodies of research that are not always linked together: (1) there is very thin empirical evidence supporting egocentric models of material self-interest and labor market competition.4See Hainmueller and Hopkins (2014). (2) There exists scant empirical evidence regarding large distributive effects of immigration, including adverse effects on the overall economy;5See, for example, Card, Dustmann, and Preston (2005); Dustmann, Fabbri, and Preston (2005); Dustmann, Glitz, and Frattini (2008); Gaston and Nelson (2000); Preston (2014); and Rowthorn (2008). at the same time, there exists extensive evidence that suggests immigrants have positive impacts on a variety of outcomes including, among other things, economic prosperity,6See, for example, Alesina, Harnoss, and Rapoport (2016). economic growth and unemployment,7See, for example, Boubtane, Coulibaly, and Rault (2013); and Jaumotte, Koloskova, and Saxena (2016). long-run income per capita,8See, for example, Ortega and Peri (2014). total factor productivity,9See, for example, Peri (2012). labor supply of women,10See, for example, Cortes and Tessada (2011). and innovation.11See, for example, Hunt and Gauthier-Loiselle (2010). (3) And finally, while there is some evidence in Levy and Wright (2022) supporting the role of sociotropic concerns, their origins remain ambiguous. At the same time, there exists growing evidence that suggests reported and measured sociotropic concerns are often correlated with views on national identity, values, and cultural, religious, or ethnic issues.12See, for example, Card, Dustmann, and Preston (2005); Javdani (2020); and Poutvaara and Steinhardt (2018). This suggests that these sociotropic considerations may function as mediating the effects of out-group hostility, rationalized prejudice, or contribute to scapegoating (Newman and Malhotra 2018; Poutvaara and Steinhardt 2018; Sides and Citrin 2007; Sniderman et al. 2004; Solodoch 2021).
We are only aware of a few studies that allow for a reasonable assessment of the relative influence on ATI of sociotropic and cultural concerns about immigrants. Using data from the United Kingdom and estimating a multiple factor model, Dustmann and Preston (2007, Page 1) find that “racial issues are considerably more important than economic concerns in driving attitudes, and particularly so amongst less educated and lower skilled sections of the population.” Card, Dustmann, and Preston (2005), using data for 21 countries from the 2002 European Social Survey, also find that higher desirability of homogeneity in customs and traditions, common religion, and common language, as well as concerns regarding the effects of immigrants on a country’s cultural life and social tensions, are significantly more important in explaining ATI than are sociotropic concerns over wages, jobs, economic prospects of the poor, and taxes. Using a similar dataset, Sides and Citrin (2007, Page 477) also conclude that “European opinion about immigration depends less on economic status (material ‘interests’) and more on both ‘symbolic’ attitudes about the nation (‘identities’) and on misperceptions of the size of immigrant populations.”
In addition, using a series of experiments embedded in a public opinion survey carried out in the Netherlands, Sniderman et al. (2004, Page 46) show that “concerns over national identity are more of a driving force [in ATI] than concerns over economic interest.” Using both original survey experiments as well as reanalysis of data from published work, findings from Newman and Malhorta (2018, Page 154) suggest that seemingly race-neutral preference for more skilled immigrants found in several studies “rather than solely representing race-neutral preference for skilled immigrants … partly represents a preference against disliked prevalent immigrants.” As we discuss in more detail in section 4, our findings are also consistent with the importance of sociopsychological factors in shaping ATI.
3 Data and Sample Characteristics
Our sample is drawn from 10 surveys of the Canadian Election Studies (CES) spanning more than three decades (1988 to 2019).13Although CES launched in 1965, questions about ATI appeared in the CES starting in 1988. To avoid any potential sample selection bias due to nonrandom attrition over time, we exclude the panel components and only use the newly added randomly selected respondents for these survey years. The CES is a randomly administered (mostly over the phone) national survey of eligible Canadian voters that has been primarily conducted during and after federal elections. It gathers data on Canadians’ voting behavior as well as their attitudes on a wide variety of social, economic, and political issues.
In every given year, the CES generally has two waves of surveys. The first wave is a campaign-period survey (CPS), which is conducted during election campaigns. The CPS is representative of Canadian adult citizens (18 years of age or older) who speak either English or French. The second wave, a postelection survey (PES), is administered immediately after the federal elections. This study relies mainly on the CPS surveys to study Canadians’ attitudes toward immigration. See table A1 in our online appendix for more details.
Our dependent variable that measures ATI is based on a question that asks whether respondents think Canada should admit “more immigrants,” “about the same immigrants,” or “fewer immigrants.” We restrict our sample to those respondents who state their opinion about the level of immigration. Our final sample size includes 68,994 individuals across all years.
Our analysis leverages the rich CES dataset, incorporating diverse explanatory variables from various domains. Specifically, we examine the relationship between individual-level economic conditions and ATI using three variables: employment status, income status, and subjective views about personal financial situations (see table A3 and A4 in the online appendix).
Additionally, we explore the impact of sociotropic economic considerations on ATI using three variables: subjective views on Canada’s economic conditions in the previous year, provincial unemployment rates, and provincial immigrant intake.14The immigration intake measures the number of new immigrants for every one thousand population. We use unemployment rate and immigration intake measured by Statistics Canada in the year preceding the survey year. Our choice to use province-level measures stems from the recognition that national indicators may not adequately capture dynamics experienced by individuals due to significant variation across Canadian provinces. Given Canada’s status as the second-largest country globally and one of the most decentralized federations, the considerable size and diversity of provinces—often characterized as “small worlds” in the literature (Bilodeau, Turgeon, and Karakoç 2012)—make the provinces a fertile ground for gauging context effects in Canada.
Extensive research suggests that ethnic background, immigration status, and resocialization in the host country are important factors in influencing ATI (e.g., Card, Dustmann, and Preston 2005; Polinard, Wrinkle, and De La Garza 1984; Branton 2007). However, there is a gap in understanding how these factors impact ATI specifically in the Canadian context. Our contribution to the literature involves examining the influence of ethnic and immigration backgrounds by differentiating between whites and ethnic minorities, as well as between immigrants and Canadian-born individuals.15Different countries use different terms to refer to their non-white/non-European population. In Canada, as defined by the Employment Equity Act, they are referred to as “visible minority,” which is defined as “persons, other than Aboriginal people, who are non-Caucasian in race or non-white in colour.” The United Nations (UN) Committee on the Elimination of Racial Discrimination has called on Canada three times (in 2007, 2012, and 2017) to reconsider using the term “visible minority.” We find it more appropriate to refer to this population as ethnic minorities. The ethnic minority population in Canada consists mainly of the following groups: Chinese, South Asian, Black, Arab, West Asian, Filipino, Southeast Asian, Latin American, Japanese, and Korean (Statistics Canada 2015). This distinction allows us to uncover potential systematic differences in ATI across these groups. These characteristics also serve as symbols for social categorization and social identification, providing insights into sociopsychological factors shaping ATI.
To facilitate this analysis, we categorize respondents into seven groups based on ethnic and immigration background: ethnic minority Canadian-born, white Canadian-born, recent white immigrant, more established white immigrant, recent ethnic minority immigrant, more established ethnic minority immigrant, and indigenous.16Immigrants who came to Canada within the last 10 years are considered recent immigrants, while immigrants who came earlier are considered established. We also include additional observed characteristics in our analysis: marital status (5 categories), education level (2 categories), religion (5 categories), age (6 categories), province of residence (10 categories), gender (2 categories), language (4 categories), and self-reported party identification (7 categories).17The party identification variable includes the following seven categories: Liberal, Conservative, NDP, Green, Bloc Quebecois, other parties, and independent. The independent category includes those who do not identify themselves with any party, including other parties (see table A5 in the online appendix for details). Similar to ethnicity and immigration background, these variables can also function as strong symbols of social categorization and identification, which can, in turn, inform ATI. In addition, to the extent that these different variables are correlated (e.g., party identification and education, religion and age, etc.), including them in our analysis would also allow us to isolate confounding relationships. However, our results cannot be considered strictly causal since we cannot rule out the potential impact of other unobserved factors (e.g., national identity). See table A2 in the online appendix for summary statistics of our variables.
4 Findings
We first explore how ATI have changed in Canada between 1988 and 2019. Next, we examine how different factors are associated with ATI and explain variations across individuals and in some cases over time.
4.1 Evolution of Attitudes toward Immigration and Potential Contributors
Figure 1 reports the percentage of Canadians who report different attitudes toward immigration between 1988 and 2019. Overall, our results suggest that between 1993 and 2008, Canadians’ ATI became relatively less negative as the percentage of Canadians who favored fewer immigrants consistently declined from 67 percent in 1993 to 26 percent in 2008. Overall, these results are consistent with other Canadian studies (e.g., Banting and Soroka 2020; Besco 2021; Wilkes and Corrigall-Brown 2011; Wilkes, Guppy, and Farris 2008).
It should be noted, however, that this sharp decline is almost entirely due to an increase in the percentage of Canadians who took a more neutral position regarding immigration, as the percentage of those supporting the status quo—feeling Canada should admit about the same number of immigrants—increased from 17 percent in 1993 to 59 percent in 2008. During the same time period, the percentage of those supporting more immigrants stayed relatively stable (and low) at around 16–17 percent.
This significant decline in anti-immigration sentiment came to a halt, however, in 2008, and abruptly shifted to a steady increase in the proportion of Canadians favoring fewer immigrants. More specifically, Canadians became increasingly uncomfortable with the status quo; their share in this category dwindled from 59 percent in 2008 to 42 percent in 2019. During the same time period, the share of Canadians who supported a reduction in the number of immigrants substantially increased from 26 to 40 percent. In 2019, the percentage of Canadians who favored the same number of immigrants almost fell back to its 1997 level of 43 percent.
It is also important to highlight that throughout our examined time period, there were few significant changes in the share of Canadians who favored more immigrants. This group remained a minority, and its share stayed relatively stable compared to the other two groups, especially between 1993 and 2011, when it hovered around 15 percent. These results provide a different picture compared to Banting and Soroka (2020) and Besco (2021), whose results suggest that opposition to immigration has leveled off since 2008.18Banting and Soroka (2020) present findings utilizing Environics data spanning from 1980 to 2019, employing a question that prompts Canadians to indicate their level of agreement with the statement: “Overall, there is too much immigration in Canada.” The respondents who express “strongly agree” or “somewhat agree” are categorized as “supportive,” while those indicating “strongly disagree” or “somewhat disagree” are classified as “not supportive.” Notably, individuals responding with “neither agree nor disagree” are seemingly excluded from the sample. Besco (2021) uses data from Environics (1981–2019), Gallup (1975–1999), and CES (1988–2019). The reported results in the paper represent mean values of normalized variables scaled from 0 to 1. We contend that the methodological decisions made by these authors in categorizing and scaling ATI measures may diminish some of the crucial systematic patterns that our results bring to light.
Several studies have documented how changes in immigration policies in the early 1990s increased the number of economic migrants, which is also evident in figure 2 (Abu-Laban 1998; Marwah, Triadafilopoulos, and White 2013; Abu-Laban and Gabriel 2002; Li 2002). These policy changes may explain the positive shift in ATI between 1993 and 2008. Indeed, the reforms did not focus merely on the number of economic immigrants; Canada also started to promote immigration as a form of economic stimulus (Abu-Laban and Gabriel 2002). In 1994, there was a significant debate around the incorporation of the economic model of “human capital” into Canada’s points system (Abu-Laban and Gabriel 2002). The model suggests that putting more weight on immigrants’ levels of human capital (such as education and language proficiency) brings skills to the country and contributes to its economy (Picot, Hou, and Qiu 2016).
In the next section, we take a more systematic approach to examine the role of various factors in shaping ATI.
4.2 Regression Results
Given the ordered nature of our dependent variable, we find the ordered logit model more suitable for our analysis.19The ordered logit model is specifically designed for situations where the dependent variable has a natural ordering. It accounts for the fact that the distances between categories may not be equal, which is a limitation of OLS in such cases. OLS also makes other assumptions (e.g., linearity, continuous and normal distribution) which are also likely to be violated when dealing with ordered variables, leading to inefficient estimates and biased standard errors. We code our dependent variable as 1 “fewer immigrants,” 2 “about the same,” and 3 “more immigrants.” Table 1 reports regression results from this model, investigating the relationship between various factors and ATI. The first column reports the calculated conditional marginal effect of each variable on the probability of favoring “fewer immigrants.” The second column reports the results for the probability of favoring “more immigrants.” Moreover, for each set of variables, the first row reports the conditional predicted probability (of supporting fewer or more immigrants) for the reference category. The remaining rows report the difference in the predicted probability for each given category relative to the reference category.20Table A7 and table A8 in our online appendix report the regression results by survey year. We do not find any systematic trends in the direction or magnitude of our estimated coefficient in different survey years. This approach allows us to compare the estimated differences with a base probability, providing a perspective on the magnitude of the effects.
We also estimate a model where we include political party identification as an explanatory variable. Since this inclusion does not significantly affect the estimated coefficients reported in table 1, we report these results in table A6 in our online appendix.
4.2.1 Individual-Level Economic Factors
We find that, conditional on observed characteristics and relative to lower-income Canadians, higher-income Canadians are on average 4.6 percentage points (around 11 percent) less likely to support fewer immigrants and 2.8 percentage points (around 18 percent) more likely to support more immigrants. Subjective views about personal financial situation also significantly impact ATI. Individuals who believe their financial situation got worse in the previous year are on average 8.5 percentage points or 28 percent more likely (6.3 percentage points or 26.7 percent less likely) to favor fewer (more) immigrants compared to observationally equivalent Canadians who believed their financial situation got better.
We also find a relationship, although relatively weaker, between employment status and ATI. Our results suggest that unemployed Canadians are on average 1.5 percentage points or 3.7 percent more likely (1 percentage point or 6 percent less likely) to support fewer (more) immigrants compared to their employed counterparts. Homemakers and those who do not report their employment status are also 2.4 and 4.0 percentage points more likely to support fewer immigrants relative to employed Canadians. Controlling for political party identification does not change the results discussed above.
4.2.2 National and Provincial Variables and the Potential Role of Sociotropic Factors
Our results also point to regional cleavages in ATI in Canada. More specifically, views about immigration are most positive in Nova Scotia and most negative in Alberta and Ontario. On average, 47.2 percent of individuals who reside in Alberta favor fewer immigrants, and only 11.4 percent support more immigrants. For Nova Scotia, these numbers are 32.4 and 22.9 percent, respectively. These differences remain similar even after controlling for differences in Canadians’ party identification across provinces.21After controlling for party identification, Ontario becomes the least supportive province for immigration. Nova Scotia remains the most supportive of immigration (see table A6 in our online appendix). One potential implication is that regional differences in ATI are rooted in province-specific sociotropic factors such as economic conditions, composition of immigrants, and accumulated historical experience rooted in “differences in colonial background, ethnic sources of population, and settlement patterns” (Simeon and Elkins 1974).
Another set of results that could potentially speak to the role of sociotropic factors is the relationship between our provincial-level variables and ATI. More specifically, our results in table 1 suggest that Canadians’ ATI are sensitive to both province-level unemployment rate as well as immigration intake, but the estimated effects are not quantitatively large. On average, adding one more immigrant to every one thousand residents in a given province (equivalent to a 50 percent increase in the average immigration intake of 1.96 in our sample) increases the probability of supporting fewer immigrants by 2.1 percentage points or 5 percent and decreases the probability of supporting more immigrants by 1.3 percentage point or 7.4 percent. We also find that, on average, a 1 percentage point increase in the unemployment rate at the provincial level (equivalent to a 15 percent increase in the average unemployment rate of 7 percent in our sample) increases the probability of supporting fewer immigrants by 0.5 percentage point or 1.2 percent. These results stand in contrast to Banting and Soroka (2020), who suggest immigration intake and unemployment level account for a good portion of changes in ATI, but the results seem consistent with Wilkes, Guppy, and Farris (2008).22Banting and Soroka (2020) only control for a small set of factors in their regressions. Therefore, it is not clear to what extent what they identify as the effect of immigration intake and unemployment rate is driven by changes in cohorts over time. In addition, despite their explicit claim, a closer examination of their results suggests that immigration intake and unemployment rate do not play a significant role in explaining ATI. Wilkes, Guppy, and Farris (2008), however, find that immigration rate has no impact on ATI. While they find a statistically significant impact for unemployment rate, the estimated magnitude seems to be much smaller compared to other factors such as gender, education, and party identification.
While objective regional factors are not strongly associated with ATI, we find a strong relationship between subjective views about Canada’s economic condition and ATI. Specifically, Canadians who believe Canada’s economic situation got worse in the previous year are on average 8.5 percentage points or 28 percent more likely (6.3 percentage points or 26 percent less likely) to support fewer (more) immigrants compared to Canadians who believed the country’s economic situation got better.
4.2.3 Social Identity Characteristics and the Potential Role of Sociopsychological Factors
We next examine the association between social identity characteristics and ATI. These are various observed attributes and affiliations through which individuals categorize themselves and others within social groups. Therefore, these characteristics could play a significant role in shaping one’s sense of identity and belonging within various social contexts, which could in turn play an important role in shaping ATI, as discussed in section 2.
We begin by examining the interplay between religious identity and ATI. Religious identity stands as one of the oldest and most influential contributors to social identity. To the best of our knowledge, this is the first systematic analysis of the association between religious identity and ATI in Canada. According to the 2021 census, just over half (53 percent) of Canadians identified with a Christian religion (Statistics Canada 2022b). Our results indicate that, controlling for other observed characteristics, both Catholic and non-Catholic Christians exhibit the lowest level of support for immigration. This observation aligns with extensive evidence underscoring the robust connection between Christianity and nationalism across various Western nations (e.g., Dingley 2011; McDaniel, Nooruddin, and Shortle 2011). At the same time, nationalism and patriotism are two forms of national attachment that are strongly associated with negative ATI (McDaniel, Nooruddin, and Shortle 2011). Consequently, our results resonate with social identity theory, supporting the hypothesis that Canadian Christians harbor more negative ATI possibly due to perceived threats from outside groups and potential challenges to their values and beliefs.
Although much smaller than the Christian population, the second-largest religious group in Canada is comprised of those identifying as Muslim (around 5 percent of the population in 2021). In stark contrast to their Christian counterparts, Muslims exhibit the most favorable ATI. Specifically, when compared to their Catholic counterparts, Canadians who self-identify as Muslim are on average 19.7 percentage points (47 percent) less likely to support fewer immigrants, and 16.7 percentage points (106 percent) more likely to support more immigrants.
Jewish Canadians emerge as the second most supportive religious group in terms of ATI (10.2 percentage points or 24 percent less likely to support fewer immigrants). Following relatively closely are atheists and agnostics (7.2 percentage points or 17 percent less likely to support fewer immigrants), who, according to the 2021 census, comprise more than one-third of the Canadian population. The findings align with “minority marginalization” hypothesis, suggesting that individuals from minority groups, such as Muslims or Jews, are likely to empathize with other marginalized groups, including immigrants in this particular context.
Two other important contributors to social identity are ethnicity and immigration background, influencing how individuals perceive themselves and how they are perceived by others within a larger societal context. Some of the theories reviewed in section 2 suggest that Canadian-borns—especially white Canadian-borns, who form the majority of the population in Canada—could consider immigrants a threat to their cultural preservation and ethnic identity. Our results depicted in figure 3 are consistent with this hypothesis. More specifically, after controlling for other observed characteristics, 40.7 percent of white Canadian-borns support fewer immigrants, and only 16.5 percent support more immigrants. In contrast, ethnic minority Canadian-borns exhibit relatively more positive ATI. Compared to white Canadian-borns, they are on average 6 percentage points (15 percent) less likely to support fewer immigrants and 4 percentage points (24 percent) more likely to favor more immigrants.
Conversely, and perhaps not surprisingly, immigrants in Canada demonstrate significantly greater support for immigration, although we find some interesting heterogeneity across different groups. Notably, recent ethnic minority and white immigrants (i.e., those residing in Canada for less than 10 years) are the most supportive of immigrants. Compared to white Canadian-borns, they are around 33 percent less likely to support fewer immigrants and around 63 percent more likely to support more immigrants.
However, our results suggest that more-established immigrants who have spent a greater amount of time in Canada exhibit more negative ATI than recent cohorts. Among white immigrants, the disparity between established and recent cohorts is more pronounced compared to their ethnic minority counterparts. Specifically, compared to their more recent counterparts, more-established white immigrants are 8.2 percentage points (32 percent) more likely to support reduced immigration and 7.8 percentage points (25.7 percent) less likely to support increased immigration. For established ethnic minority immigrants, and relative to their recent counterparts, these numbers are 4 percentage points (14.2 percent) and 3.6 percentage points (13.8 percent), respectively.
These results align with findings from various countries, indicating that immigrants with longer-term residence often display more negative ATI (e.g., Hainmueller and Hopkins 2014; Helbling 2014; Sides and Citrin 2007; Semyonov, Raijman, and Gorodzeisky 2006). These studies attribute such behavior to several factors, including perceived economic and social threats from new immigrants. This phenomenon is rooted in an assimilation and adaptation process that tends to shift immigrants’ attitudes toward the prevailing sentiments in the host society.
In contrast to prior research indicating that a country’s minorities typically show more support for immigration than the majority group (e.g., Berry and Kalin 1995; Binder, Polinard, and Wrinkle 1997; Buckler, Swatt, and Salinas 2009), our findings reveal that indigenous Canadians exhibit the highest likelihood of supporting fewer immigrants (45.7 percent) and the lowest likelihood of supporting more immigrants (13.7 percent) among various Canadian groups. One possible explanation is the threat to indigenous cultures and languages, which are at risk of extinction. Canadian multiculturalism, linked to immigration discourse and tolerance promises within Western institutions, may not adequately recognize the rights and challenges of indigenous people. This perception could lead indigenous Canadians to view immigration as a threat to cultural preservation and ethnic identity. Strengthening the relationship between indigenous Canadians and immigrants is crucial for fostering a more inclusive society, aligning with recommendations from the Truth and Reconciliation Commission of Canada (2015), emphasizing the urgent need for dialogue between indigenous people and new Canadians to build stronger relationships and solidarity.
In line with exiting research (e.g., Banting and Soroka 2020; Chandler and Tsai 2001; Scheve and Slaughter 2001; Citrin et al. 1997; Héroux-Legault 2016), our study affirms that education and gender are significantly associated with ATI. Consistent with previous findings, those with postsecondary education are more supportive of immigration, while women tend to exhibit more negative ATI. Additionally, our results reveal a nonlinear association between age and ATI. Those under 30 are less likely to favor fewer immigrants compared to those under 60, while those over 60 are even more likely to support immigration than those under 30. These findings differ from US and European studies showing older individuals as least supportive of immigration (e.g., Card, Dustmann, and Preston 2005; Schotte and Winkler 2018; Mayda 2006), but they do align with Banting and Soroka (2020).
4.2.4 Political Party Identification
Academic studies have consistently emphasized the crucial role of political party identification in shaping social identity (e.g., Campbell et al. 1960; Green, Palmquist, and Schickler 2002). Consequently, shifts in party stances on issues like immigration could impact the perspectives of individuals aligned with a particular party (Brader et al. 2020; Kam 2005; Lenz 2013; Vrânceanu and Lachat 2021) as well as the sorting of individuals across different political affiliations (Merkley 2022). Despite the acknowledged significance of political dynamics in shaping attitudes, the exploration of their role in shaping ATI has received comparatively limited attention in the Canadian context.
This relative neglect may be attributed in part to the perceived lack of substantial disagreement among political parties regarding their stances on immigration. However, Besco (2021) draws attention to a series of diversity-related issues that have surfaced in Canadian politics since the late 2000s, suggesting a noteworthy emergence of relevant considerations. This section delves into our findings regarding the association between Canadians’ ATI and their political party identification.
Figure 4 illustrates the conditional probabilities of supporting different immigration regimes for different party identifications. Overall, Canadians with different party identifications occupy distinctive positions regarding immigration. Canadians who identify with the NDP (New Democratic Party), Liberal, or Green parties clearly distinguish themselves as the most welcoming toward immigrants; Conservatives are the least supportive group, and those who identify with the Bloc Quebecois or as independent stand in the middle.
More specifically, conditional on our rich set of control variables, nearly half of the Conservatives (49.8 percent) support fewer immigrants, and only 9.6 percent of them advocate for an increase in immigration intake. The contrast between the Conservatives and those who identify with other parties is striking. In comparison with observationally equivalent NDP supporters, Canadians who identify with the Conservative party are on average 21.5 percentage points (75.6 percent) more likely to support fewer immigrants and 11.5 percentage points (54.5 percent) less likely to support more immigrants. Similar disparities are evident between those who identify with the Conservative party and those who identify with the Liberal party or the Green party. Interestingly, those who do not identify with any party (i.e., independent) have similar attitudes to the Bloc Quebecois supporters, as both hold positions almost in the middle of the Liberal versus Conservative divide.
Political party positions and the views and preferences of their supporters undergo significant changes over time. To assess the potential impact of these changes on the relationship between party identification and ATI across different survey years, we conduct separate estimations of our model. A concise summary of our key findings is presented below, with a more comprehensive discussion available in section 2 of our online appendix.
Firstly, aligning with the observations made by Besco (2021), our analysis identifies 2004 as a distinct turning point in the attitudes of supporters from various political parties toward immigration. Figure A1 in our online appendix illustrates that, preceding 2004, Liberals, Conservatives, and Bloc Québécois supporters exhibited convergent ATI, while divergence was noticeable between Liberals and NDPs. However, the 2006 election marked the onset of political polarization on immigration, particularly between Liberals, Conservatives, and Bloc Québécois, with the most pronounced divide observed in 2019. Concurrently, views among Liberals, NDPs, and Greens began to converge during this period.
Secondly, as depicted in figure A2 in our online appendix, the observed divergence or convergence over time is predominantly attributed to variations in the pace at which these attitudes evolved (i.e., differences in the rate of change) rather than disparities in the direction of change suggested by Besco (2021). With some minor exceptions, the overall trajectory of change across supporters of different parties closely mirrors the patterns presented in figure 1. This implies that, when considering the broader temporal shifts in ATI, political party identification primarily influences the speed of change within these overarching patterns rather than altering their direction.
One possible explanation for the observed polarization in ATI is shifts in individual opinions influenced by changes in party positions and cues (i.e., opinion leadership). Alternatively, polarization by party identification might be driven by people changing parties based on their position on immigration (Besco 2021). Unfortunately, our data do not allow for a rigorously distinction between these two mechanisms. Nevertheless, we attempt to shed light on the issue by examining the impact of political partisanship, measured by self-reported degree of party identification (i.e., very strongly, fairly strongly, not strongly) on Canadians’ ATI. More specifically, if observed polarization in ATI by party identification is the result of opinion changes driven by opinion leadership, we would expect partisans to exhibit a greater degree of polarization over time, since under this scenario they are more likely to be influenced by party positions and cues.
Our results in figures A4 and A5 in our online appendix reveal that between 1993 and 2004, there were relatively minor disparities between Liberals and Conservatives, irrespective of their partisanship. However, starting in 2006, a discernible pattern emerges, with individuals strongly identifying as Conservative expressing heightened opposition to immigration, while those strongly identifying as Liberals show weaker opposition. Specifically, the difference in the conditional probability of supporting fewer immigrants between strong Conservative and Liberal identifiers was 2 percentage points in 2004. This gap consistently widened over time, reaching 18 percentage points in 2011 and 30 percentage points in 2019. Given the substantial political conflict across parties over immigration since the mid-2000s, this evidence aligns with the notion of opinion change driven by party cues on immigration.
5 Relative Importance Analysis
Our regression analysis explores the association between attitudes toward immigration (ATI) and various factors, providing informative insights. However, it lacks a direct assessment of the relative contribution of these factors in explaining variations in ATI among Canadians. In this section, we address this issue using the Lindeman, Merenda, and Gold (LMG) method, a widely used approach for relative importance calculation (Grömping 2007, 2015).
Figure 5 presents the LMG results, indicating that our explanatory variables account for 14.7 percent of the total variation in ATI. Notably, political party identification, education level, and subjective views on changes in Canada’s economic conditions emerge as the three most influential factors. Specifically, political party identification contributes nearly 22.1 percent to the model’s explanatory power, surpassing education level by 51 percent and subjective views on economic conditions by 87 percent.
Another noteworthy observation is that, among the four economic factors, subjective views on Canada’s economic situation exhibit significantly greater influence in explaining variations in ATI. It is tempting to interpret this as emphasizing the significance of sociotropic concerns regarding immigration. However, as previously discussed, it is equally plausible that these reported sociotropic concerns may, consciously or unconsciously, conceal other fears: that is, the perceived threats immigrants pose to Canadians’ sense of cultural preservation and social identity.
As previously discussed, supporters of different political parties started diverging on immigration in 2006, suggesting a potentially changing contribution of party identification to ATI. To delve deeper, we conduct relative importance analysis separately for the periods 1988 to 2004 and 2006 to 2019. In panel 1 of figure 6, covering the earlier period, education, year fixed effects, and ethnic and immigration background emerge as the top three factors, explaining 20.2, 14.8, and 10.5 percent of the ATI variations, respectively.23The importance of year fixed effects in the explanatory power of our model suggests that some of the variation in ATI is driven by unobserved factors that have a systematically similar effect on individuals but vary over time (e.g., the annual multiculturalism budget in Canada, or the rise of radical right-wing populism). Strikingly, political party identification contributes only 5.2 percent during this period.
In panel 2 of figure 6, covering 2006 to 2019, there is a significant shift in the contribution of factors to variations in ATI. Political party identification now takes the lead, accounting for 27.6 percent of the explained variation in ATI. Subjective views on Canada’s economic situation rank as the second-most influential factor, explaining 15.5 percent, while education ranks third, contributing only 11.1 percent. This substantial change underscores the rise of political partisanship and polarization, aligning with the trends discussed in section 4.2.4.
6 Conclusion
This study investigates the evolution and potential influencers of ATI in Canada from 1988 to 2019, utilizing data from the Canadian Election Studies surveys. We observe a notable decline in Canadians’ support for reduced immigration intake from 1988 to 2008, but this trend reverses in the 2010s. During this later period, more Canadians express discomfort with the existing state of affairs and lean toward supporting stricter immigration policies. The percentage of Canadians endorsing an increase in immigration intake has remained relatively stable over the past four decades, with only 18 percent favoring such expansion in 2019.
Our analysis of the connections between ATI and various economic, sociotropic, and sociopsychological factors reveals two overarching observations about the determinants of ATI in Canada. First, among the economic factors under consideration, subjective views regarding changes in Canada’s economic performance emerge as more influential in shaping ATI compared to objective factors like income, employment status, unemployment rate, and immigration intake.
Second, our results underscore the substantial relationship between group-level sociopsychological factors—stemming from differences in religion, ethnicity, immigration status, and party identification—on shaping ATI. Notably, our research underscores the prominent polarizing impact of political parties on ATI, positioning them as the foremost factor in explaining variations in ATI among Canadians post-2006. This observation is of particular significance and warrants careful consideration.
The discernible widening of the divide among supporters of different parties after 2006 coincides with a series of immigration and diversity issues emerging in Canadian politics since the late 2000s (Besco 2021; Marwah, Triadafilopoulos, and White 2018; Fiřtová 2021; Abu-Laban 2020; Kwak 2019). Moreover, recent Canadian public polling results have witnessed a further intensification of negative ATI within public discourse (Environics Institute 2023; Perez 2023). This heightened negativity raises concerns, especially in the context of global trends in political and social polarization. As we witness increasing polarization worldwide, coupled with challenging economic conditions, the exacerbation of negative ATI in Canada adds another layer of complexity to these broader issues. This concerning trend in negative ATI may have far-reaching implications, necessitating a comprehensive examination of its potential impact on societal cohesion and public trust, discrimination and xenophobia, and policy formulation. Addressing these challenges requires a multifaceted approach that considers the intricate interplay between sociopsychological factors, political affiliations, and the broader global context.
There is one final point worth emphasizing here. Growing empirical evidence underscores the need to delve deeper into the role of group-level sociopsychological factors that contribute to in-group versus out-group dynamics, intensify fears of symbolic threats, generate intergroup anxiety, and influence tolerance of “the other” alongside a preference for social and cultural homogeneity. Often, political parties leverage these sociopsychological factors to mediate their influence through the framing and politicization of immigration. This not only shapes attitudes toward immigration but also conditions individuals’ responses to contextual changes, which, contrary to systematic evidence, are linked to immigration and immigrants.
For instance, the politicization of immigration by political parties, especially during periods of hardship and tension, may explain the apparent association between anti-immigration sentiments and contextual changes, such as concerns about the increased cost of living or the housing crisis in Canada. During these times, immigration is injected into public discourse, anchored to dominant issues of the day (e.g., economic anxiety or ethnic and social tensions). Therefore, while the association between these dominant issues and immigration remains unclear to the public, immigration’s profile is nevertheless elevated. This is consistent with findings from several studies which show that while changes over time in the rate of immigration do not affect ATI, year-to-year changes in other macro-level conditions, often unrelated to immigration, such as the unemployment rate or GDP growth, do influence ATI (e.g., Banting and Soroka 2020; Ruist 2016; Wilkes, Guppy, and Farris 2008).
Our results, while not establishing strict causation, underscore the significant and systematic association between ATI and various contributors to one’s sense of social identity (e.g., religion, ethnicity, immigration status, party identification). These contributors align with the primacy of group-level sociopsychological factors in shaping ATI. Additionally, the smaller role of economic factors—increasingly evident in more recent studies that explore a broader array of variables—suggests that economic policy often has a limited influence in reducing anti-immigration sentiments. Although preserving low unemployment levels might alleviate a specific type of economic anxiety linked to immigration, it fails to address broader underlying sociopsychological factors influencing ATI. Our results underscore this by revealing that during a period of decreasing unemployment rates (2009 to 2019), negative ATI continued to increase in Canada.
We contend that a comprehensive and effective approach to address negative attitudes toward immigration requires careful attention to and serious engagement with sociopsychological factors, prejudices, and stereotypes that contribute significantly to such opposition. Education and learning can play a critical role, as numerous studies consistently find that higher levels of education (net of other factors) are associated with more positive ATI.24While some studies suggest that the positive effect of education functions through its impact on labor market competitiveness and individual economic self-interest (e.g., Mayda 2006), others highlight the role of education in the process of opinion formation toward immigration, and promotion of tolerance and open-mindedness (Dustmann and Preston 2007; Hainmueller and Hopkins 2014). However, our vision of education goes beyond traditional classroom learning or the acquisition of higher degrees. It involves cultivating the capacity to adopt a broader range of views, promoting open-mindedness, and fostering tolerance for change and diversity. In this holistic approach, one must acknowledge the influence of both the media, acting as powerful shapers of public discourse, and political parties, acting as opinion leaders. These entities play a crucial role in shaping and amplifying attitudes toward immigration, adding layers of complexity to the overall dynamics of ATI. Policymakers need to challenge narratives that blame immigrants for economic downturns—these narratives limit considerations to individual behavior driven by material self-interest. Instead, policymakers should expand public views, fostering Canadians’ confidence in the benefits associated with immigration; such a shift would be a crucial step in promoting a culture of acceptance and tolerance.
Tables and Figures
Figure 1: Changes in attitudes toward immigration in Canada – 1988 to 2019
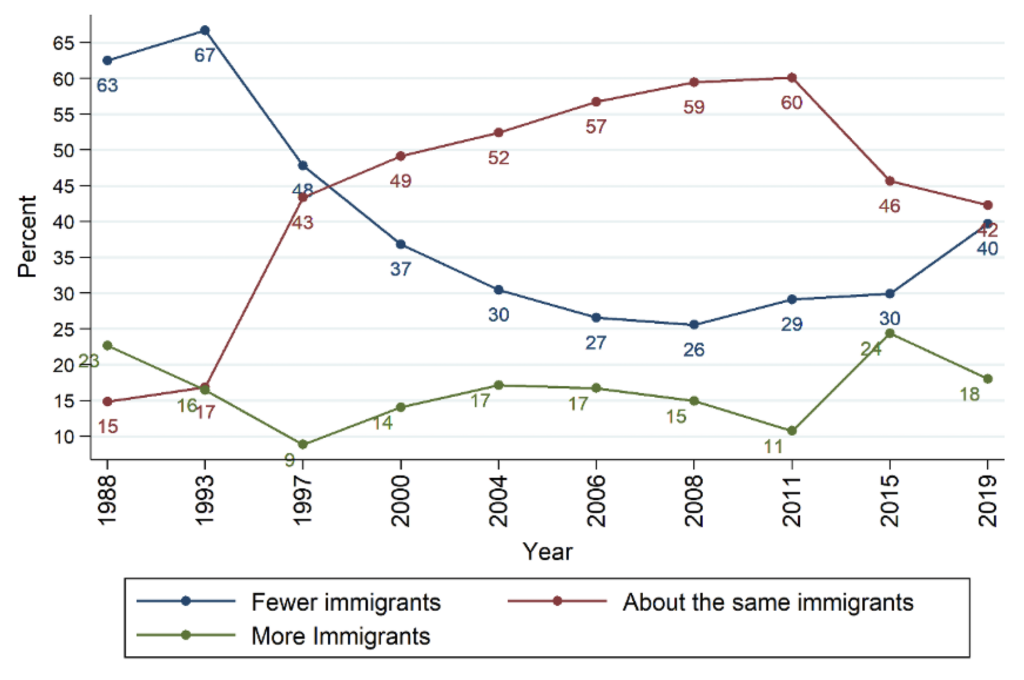
Note: Respondents were asked: Do you think Canada should admit more immigrants, fewer immigrants or about the same as now?
Figure 2: Immigration intake by admission category – 1980 to 2019
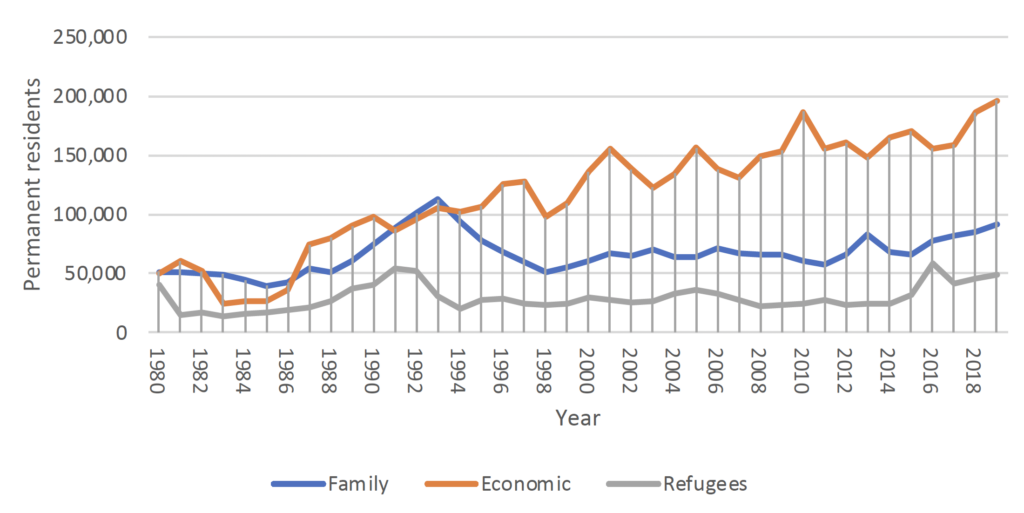
Source: Immigration, Refugees, and Citizenship Canada. Permanent Residents. (2016). Ad Hoc IRCC [Specialized Datasets]. https://open.canada.ca/data/en/dataset/ad975a26-df23-456a-8ada-756191a23695.
Figure 3: Attitudes toward immigration – Conditional predicted probabilities for different groups by ethnic and immigration background – Ordered logit model
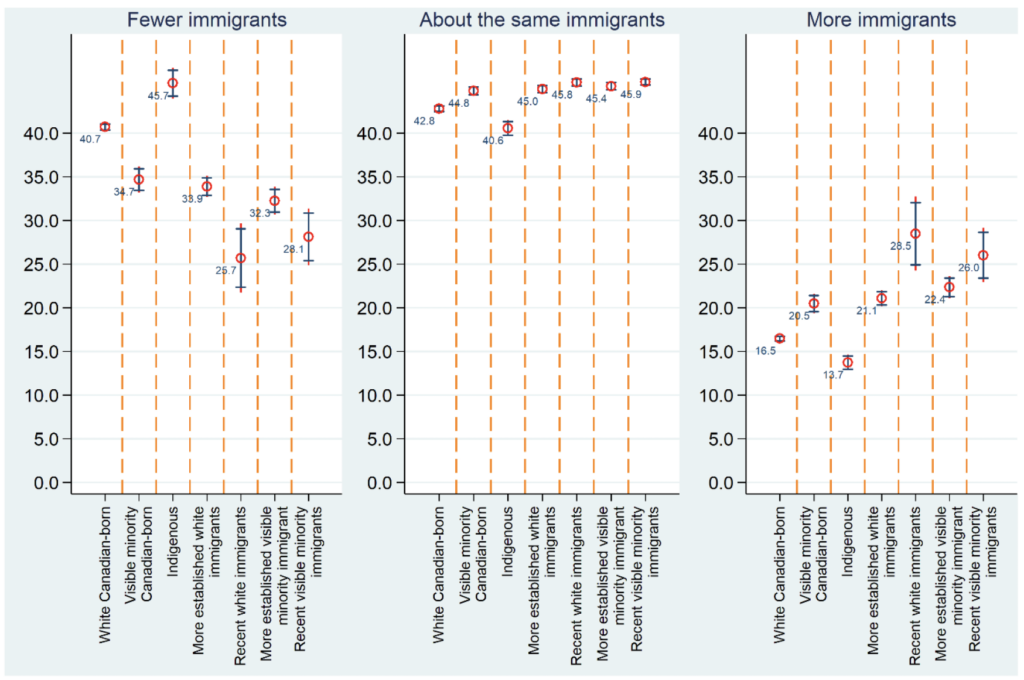
Note: Control variables include employment status, religion, province, income, language, marital status, age, gender, education, year, subjective view about personal financial situation, subjective view about Canada’s economic situation, unemployment rate, and immigration intake. Both 90% and 95% confidence intervals are displayed for each estimate. The two horizontal lines on each confidence interval band represent where the 90% confidence interval ends.
Figure 4: Attitudes toward immigration – Conditional predicted probabilities for different groups by political party identification – Ordered logit model
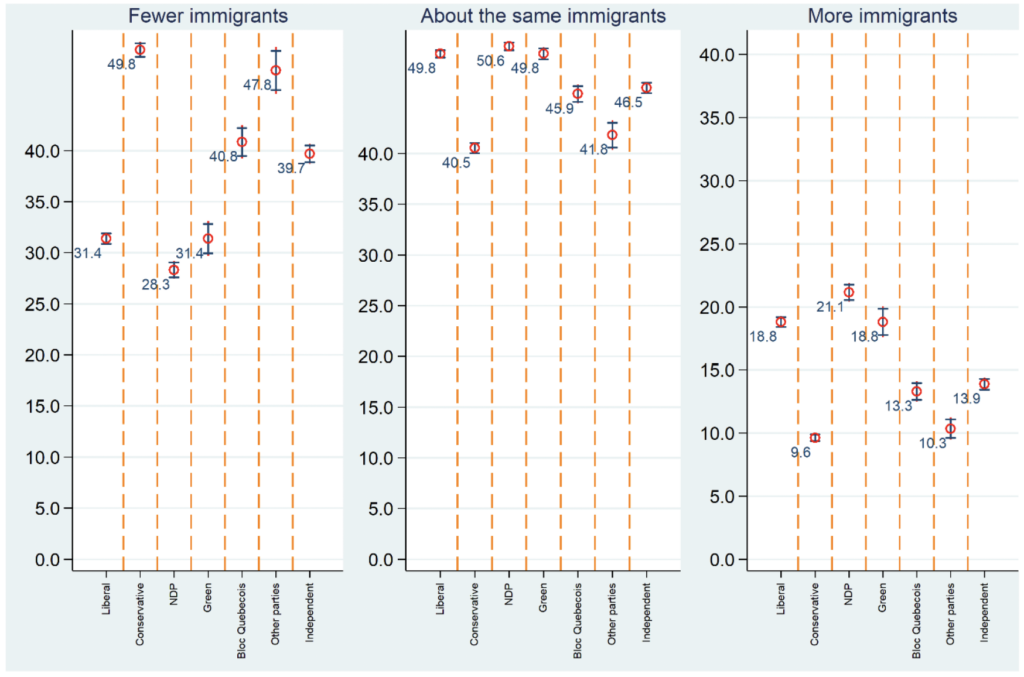
Note: Control variables include employment status, religion, province, income, language, marital status, age, gender, education, year, subjective view about personal financial situation, subjective view about Canada’s economic situation, ethnic/immigration background, unemployment rate, and immigration intake. Both 90% and 95% confidence intervals are displayed for each estimate. The two horizontal lines on each confidence interval band represent where the 90% confidence interval ends.
Figure 5: The relative importance analysis of model 2 – 1988 to 2019
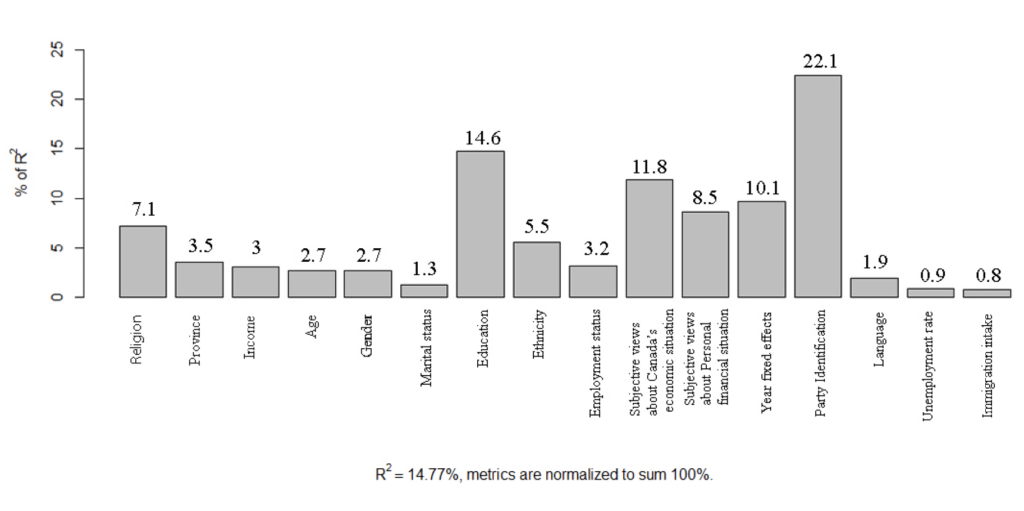
Note: The LMG method is used to compute the relative importance of variables. Each histogram bar measures how much of the explained variation in attitudes toward immigration is contributed to different factors.
Figure 6: The relative importance analysis of model 2 – 1988–2004 and 2006–2019
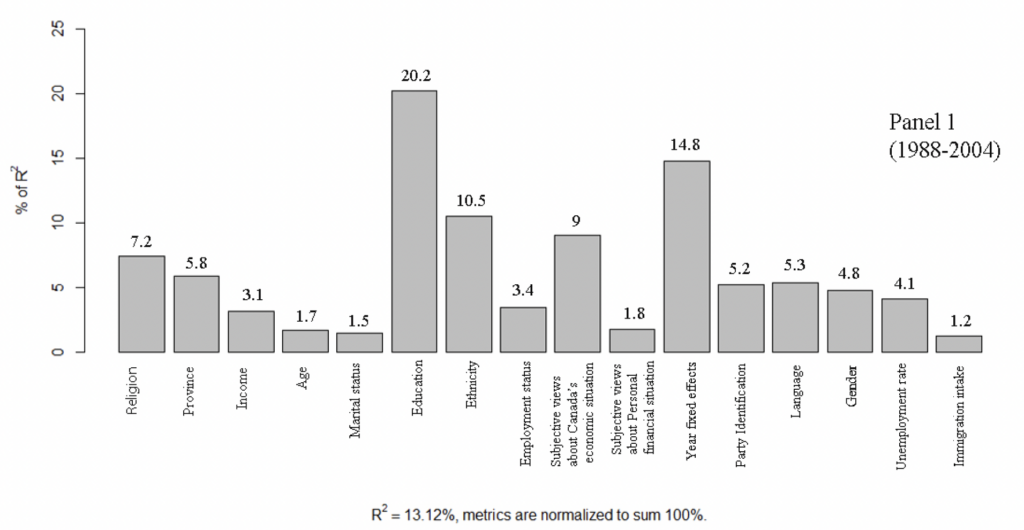
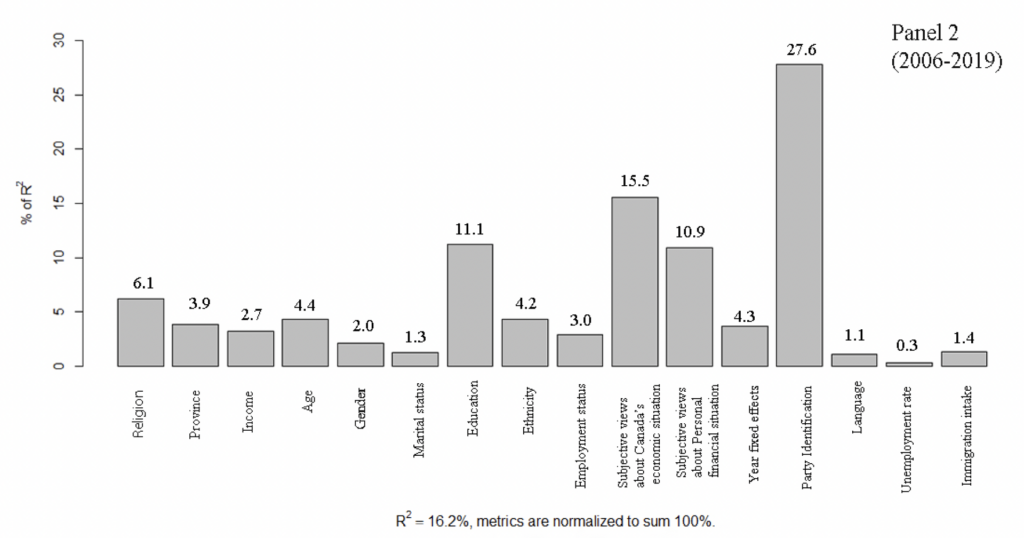
Note: The LMG method is used to compute the relative importance of variables. Each histogram bar measures how much of the explained variation in attitudes toward immigration is contributed to different factors. Panels 1 and 2 show the relative importance results for 1988–2004 and 2006–2019, respectively.
Online Appendix
For additional data and analysis, please visit the supplementary online appendix.
References
Abu-Laban, Y. (1998). Welcome/stay out: The contradiction of Canadian integration and immigration policies at the millennium. Canadian Ethnic Studies Journal, 30(3), 190–213.
Abu‐Laban, Y. (2020). Immigration and settler‐colonies post‐UNDRIP: Research and policy implications. International Migration, 58(6), 12–28.
Abu-Laban, Y., & Gabriel, C. (2002). Selling diversity: Immigration, multiculturalism, employment equity, and globalization. University of Toronto Press.
Alesina, A., Harnoss, J., & Rapoport, H. (2016). Birthplace diversity and economic prosperity. Journal of Economic Growth, 21(2), 101–138.
Baker, J. O., & Edmonds, A. E. (2021). Immigration, presidential politics, and partisan polarization among the American public, 1992–2018. Sociological Spectrum, 41(4), 287–303.
Banting, K., & Soroka, S. (2020). A distinctive culture? The sources of public support for immigration in Canada, 1980–2019. Canadian Journal of Political Science/Revue Canadienne de Science Politique, 53(4), 821–838.
Berry, J. W., & Kalin, R. (1995). Multicultural and ethnic attitudes in Canada: An overview of the 1991 national survey. Canadian Journal of Behavioural Science/Revue Canadienne des Sciences du Comportement, 27(3), 301.
Besco, R. (2021). From stability to polarization: The transformation of Canadian public opinion on immigration, 1975–2019. American Review of Canadian Studies, 51(1), 143–165.
Besco, R., & Tolley, E. (2018). Does everyone cheer? The politics of immigration and multiculturalism in Canada. In E. Goodyear-Grant, R. Johnston, W. Kymlicka, & J. Myles (Eds.), Federalism and the welfare state in a multicultural world (pp. 291–318). McGill-Queen’s University Press.
Bilodeau, A., Turgeon, L., & Karakoç, E. (2012). Small worlds of diversity: Views toward immigration and racial minorities in Canadian provinces. Canadian Journal of Political Science/Revue Canadienne de Science Politique, 45(3), 579–605.
Binder, N. E., Polinard, J. L., & Wrinkle, R. D. (1997). Mexican American and Anglo attitudes toward immigration reform: A view from the border. Social Science Quarterly, 78, 324–337.
Blumer, H. (1958). Race prejudice as a sense of group position. Pacific Sociological Review, 1(1), 3–7.
Bobo, L. (1983). Whites’ opposition to busing: Symbolic racism or realistic group conflict? Journal of Personality and Social Psychology, 45(6), 1196.
Boubtane, E., Coulibaly, D., & Rault, C. (2013). Immigration, growth, and unemployment: Panel VAR evidence from OECD countries. Review of Labour Economics and Industrial Relations, 27, 399–420.
Brader, T., De Sio, L., Paparo, A., & Tucker, J. A. (2020). Where you lead, I will follow: Partisan cueing on high‐salience issues in a turbulent multiparty system. Political Psychology, 41(4), 795–812.
Branton, R. (2007). Latino attitudes toward various areas of public policy: The importance of acculturation. Political Research Quarterly, 60(2), 293–303.
Buckler, K., Swatt, M. L., & Salinas, P. (2009). Public views of illegal migration policy and control strategies: A test of the core hypotheses. Journal of Criminal Justice, 37(4), 317–327.
Campbell, A., Converse, P. E., Miller, W. E., & Stokes, D. E. (1960). The American voter. University of Chicago Press.
Campbell, D. T. (1965). Ethnocentric and other altruistic motives. In D. Levine (Ed.), Nebraska symposium on motivation (pp. 283–311). University of Nebraska Press.
Card, D., Dustmann, C., & Preston, I. (2005). Understanding attitudes to immigration: The migration and minority module of the first European Social Survey [CReAM discussion paper no. 03/05]. University College London.
Chandler, C. R., & Tsai, Y. M. (2001). Social factors influencing immigration attitudes: An analysis of data from the General Social Survey. Social Science Journal, 38(2), 177–188.
Citrin, J., Green, D. P., Muste, C., & Wong, C. (1997). Public opinion toward immigration reform: The role of economic motivations. Journal of Politics, 59, 858–881.
Cortes, P., and Tessada, J. (2011). Low-skilled immigration and the labor supply of highly skilled women. American Economic Journal: Applied Economics, 3(3), 88–123.
Dancygier, R. M., & Donnelly, M. J. (2013). Sectoral economies, economic contexts, and attitudes toward immigration. Journal of Politics, 75(1), 17–35.
Dingley, J. (2011). Sacred communities: Religion and national identities. National Identities, 13(4), 389–402.
Donnelly, M. (2017). Canadian exceptionalism: Are we good or are we lucky? A Survey of Canadian attitudes in comparative perspective [Report]. McGill Institute for the Study of Canada.
Dustmann, C., Fabbri, F., & Preston, I. (2005). The impact of immigration on the British labour market. Economic Journal, 115(507), F324–F341.
Dustmann, C., Glitz, A., & Frattini, T. (2008). The labour market impact of immigration. Oxford Review of Economic Policy, 24(3), 478–95. https://doi.org/10.1093/oxrep/grn024
Dustmann, C., & Preston, I. P. (2007). Racial and economic factors in attitudes to immigration. B. E. Journal of Economic Analysis and Policy, 7(1). https://doi.org/10.2202/1935-1682.1655.
Environics Institute. (2023). Canadian public opinion about immigration and refugees [Focus Canada report].
Fine, B., & Milonakis, D. (2009). From economics imperialism to freakonomics: The shifting boundaries between economics and other social sciences. Routledge.
Fiřtová, M. (2021). Framing Canadian immigration discourse under the conservative government (2006–2015): Breaking path dependence? Journal of International Migration and Integration, 22(1), 265–287.
Gaston, N., & Nelson, D. (2000). Immigration and labour-market outcomes in the United States: A political-economy puzzle. Oxford Review of Economic Policy, 16(3), 104–114.
Grande, E., Schwarzbözl, T., & Fatke, M. (2019). Politicizing immigration in Western Europe. Journal of European Public Policy, 26(10), 1444–1463.
Green, D. P., Palmquist, B., & Schickler, E. (2002). Partisan hearts and minds: Political parties and the social identities of voters. Yale University Press.
Grömping, U. (2007). Estimators of relative importance in linear regression based on variance decomposition. American Statistician, 61(2), 139–147.
Grömping, U. (2015). Variable importance in regression models. Wiley Interdisciplinary Reviews: Computational Statistics, 7(2), 137–152.
Hainmueller, J., & Hiscox, M. J. (2010). Attitudes toward highly skilled and low-skilled immigration: Evidence from a survey experiment. American Political Science Review, 104(1), 61–84.
Hainmueller, J., & Hopkins, D. J. (2014). Public attitudes toward immigration. Annual Review of Political Science, 17, 225–249.
Harell, A. (2009). Minority-majority relations in Canada: The rights regime and the adoption of multicultural values. Canadian Political Science Association Annual Meeting, Ottawa ON.
Helbling, M. (2014). Opposing Muslim immigrants: Attitudes of rejection among majority members and Muslim immigrants in Western Europe. Ethnic and Racial Studies, 37(1), 37–57.
Héroux-Legault, M. (2016). Substate variation in political values in Canada. Regional and Federal Studies, 26, 171–197.
Hout, M., & Maggio, C. (2021). Immigration, race, and political polarization. Daedalus, 150(2), 40–55.
Hunt, J., & Gauthier-Loiselle, M. (2010). How much does immigration boost innovation? American Economic Journal: Macroeconomics, 2(2), 31–56.
Jaumotte, M. F., Koloskova, K., & Saxena, M. S. C. (2016). Impact of migration on income levels in advanced economies [Spillover Notes no. 2016/008]. International Monetary Fund.
Javdani, M. (2020). Public attitudes toward immigration: Determinants and unknowns. IZA World of Labor, 473.
Kam, C. D. (2005). Who toes the party line? Cues, values, and individual differences. Political Behavior, 27, 163–182.
Kheiriddin, T. (2019, May 16). Will the 2019 vote be the election of hate? Global News. https://globalnews.ca/news/5235846/canada-immigration-election/.
Kwak, L. J. (2019). New Canadians are new conservatives: Race, incorporation, and achieving electoral success in multicultural Canada. Ethnic and Racial Studies, 42(10), 1708–1726.
Lee, E., & Johnstone, M. (2021). Lest we forget: Politics of multiculturalism in Canada revisited during COVID-19. Critical Sociology, 47(4-5), 671–685.
Lenz, G. S. (2013). Follow the leader? How voters respond to politicians’ policies and performance. University of Chicago Press.
LeVine, R. A., & Campbell, D. T. (1972). Ethnocentrism: Theories of conflict, ethnic attitudes, and group behavior. John Wiley & Sons.
Li, P. (2002). Destination Canada: Immigration debates and issues. Oxford University Press.
Marwah, I., Triadafilopoulos, T., & White, S. (2018). Immigration, citizenship, and Canada’s new conservative party. In J. Farney & D. Rayside (Eds.), Conservatism in Canada (pp. 95–119). University of Toronto Press.
Mayda, A. M. (2006). Who is against immigration? A cross-country investigation of individual attitudes toward immigrants. Review of Economics and Statistics, 88(3), 510–530.
McDaniel, E. L., Nooruddin, I., & Shortle, A. F. (2011). Divine boundaries: How religion shapes citizens’ attitudes toward immigrants. American Politics Research, 39(1), 205–233.
Merkley, E. (2022). Polarization eh? Ideological divergence and partisan sorting in the Canadian mass public. Public Opinion Quarterly, 86(4), 932–943.
Meuleman, B., Davidov, E., & Billiet, J. (2009). Changing attitudes toward immigration in Europe, 2002–2007: A dynamic group conflict theory approach. Social Science Research, 38(2), 352–365.
Miconi, D., Li, Z. Y., Frounfelker, R. L., Venkatesh, V., & Rousseau, C. (2021). Sociocultural correlates of self-reported experiences of discrimination related to COVID-19 in a culturally diverse sample of Canadian adults. International Journal of Intercultural Relations, 81, 176–192.
Morrison, K. R., Fast, N. J., & Ybarra, O. (2009). Group status, perceptions of threat, and support for social inequality. Journal of Experimental Social Psychology, 45(1), 204–210.
Myers, C., Abrams, D., Rosenthal, H. E., & Christian, J. (2013). Threat, prejudice, and stereotyping in the context of Japanese, North Korean, and South Korean intergroup relations. Current Research in Social Psychology, 20(7), 76–85.
Newman, B. J., & Malhotra, N. (2019). Economic reasoning with a racial hue: Is the immigration consensus purely race neutral? Journal of Politics, 81(1), 153–166.
Peri, G. (2012). The effect of immigration on productivity: Evidence from US states. Review of Economics and Statistics, 94(1), 348–358.
Perez, A. (2023, September 23). Canada’s welcoming attitude toward immigrants is at risk of fraying. The Globe and Mail. https://www.theglobeandmail.com/opinion/article-canadas-welcoming-attitude-toward-immigrants-is-at-risk-of-fraying/.
Picot, G., Hou, F., & Qiu, H. (2016). The human capital model of selection and immigrant economic outcomes. International Migration, 54(3), 73–88.
Polinard, J. L., Wrinkle, R. D., & De La Garza, R. (1984). Attitudes of Mexican Americans toward irregular Mexican immigration. International Migration Review, 18(3), 782–799.
Poutvaara, P., & Steinhardt, M. F. (2018). Bitterness in life and attitudes toward immigration. European Journal of Political Economy, 55, 471–490.
Preston, I. (2014). The effect of immigration on public finances. The Economic Journal, 124(580), F569–F592.
Quillian, L. (1995). Prejudice as a response to perceived group threat: Population composition and anti-immigrant and racial prejudice in Europe. American Sociological Review, 60(4), 586–611.
Rowthorn, R. (2008). The fiscal impact of immigration on the advanced economies. Oxford Review of Economic Policy, 24(3), 560–580.
Ruist, J. (2016). How the macroeconomic context impacts on attitudes to immigration: Evidence from within-country variation. Social Science Research, 60, 125–134.
Scheve, K. F., & Slaughter, M. J. (2001). Labor market competition and individual preferences over immigration policy. Review of Economics and Statistics, 83(1), 133–145.
Schotte, S., & Winkler, H. (2018). Why are the elderly more averse to immigration when they are more likely to benefit? Evidence across countries. International Migration Review, 52(4), 1250–1282.
Semyonov, M., Raijman, R., & Gorodzeisky, A. (2006). The rise of anti-foreigner sentiment in European societies, 1988–2000. American Sociological Review, 71(3), 426–449.
Sherif, M. (1966). Group conflict and cooperation: Their social psychology. Routledge & Kegan Paul.
Sides, J., & Citrin, J. (2007). European opinion about immigration: The role of identities, interests, and information. British Journal of Political Science, 37(3), 477–504.
Simeon, R., & Elkins, D. J. (1974). Regional political cultures in Canada. Canadian Journal of Political Science/Revue Canadienne de Science Politique, 7(3), 397–437.
Simon, J. (1989). The economic consequences of migration. Blackwell.
Sniderman, P. M., Hagendoorn, L., & Prior, M. (2004). Predisposing factors and situational triggers: Exclusionary reactions to immigrant minorities. American political science review, 98(1), 35-49.
Solodoch, O. (2021). Do sociotropic concerns mask prejudice? Experimental evidence on the sources of public opposition to immigration. Political Studies, 69(4), 1009–1032.
Statistics Canada. (2015). Visible minority of person. https://www23.statcan.gc.ca/imdb/p3Var.pl?Function=DECI&Id=257515.
Statistics Canada. (2020, September 17). Experiences of discrimination during the COVID-19 pandemic. The Daily. https://www150.statcan.gc.ca/n1/en/daily-quotidien/200917/dq200917a-eng.pdf?st=wmIBdab4.
Statistics Canada. (2022a, October 26). Immigrants make up the largest share of the population in over 150 years and continue to shape who we are as Canadians. The Daily. https://www150.statcan.gc.ca/n1/daily-quotidien/221026/dq221026a-eng.htm.
Statistics Canada. (2022b, October 26). The Canadian census: A rich portrait of the country’s religious and ethnocultural diversity. The Daily. https://www150.statcan.gc.ca/n1/daily-quotidien/221026/dq221026b-eng.htm.
Stephan, W. G., Renfro, C. L., Esses, V. M., Stephan, C. W., & Martin, T. (2005). The effects of feeling threatened on attitudes toward immigrants. International Journal of Intercultural Relations, 29(1), 1–19.
Stephan, W. G., & Stephan, C. W. (1996). Predicting prejudice. International Journal of Intercultural Relations, 20(3-4), 409–426.
Stephan, W. G., Ybarra, O., Martnez, C. M., Schwarzwald, J., & Tur-Kaspa, M. (1998). Prejudice toward immigrants to Spain and Israel: An integrated threat theory analysis. Journal of Cross-Cultural Psychology, 29(4), 559–576.
Tajfel, H. (1979). Individuals and groups in social psychology. British Journal of Social and Clinical Psychology, 18(2), 183–190.
Tajfel, H. (1982). Social identity and intergroup behavior. Cambridge University Press.
Tajfel, H. & Turner, J. C. (1986). An integrative theory of intergroup conflict. In S. Worchel & W. Austin (Eds.), Psychology of Intergroup Relations (pp. 2–24). Nelson-Hall.
Truth & Reconciliation Commission of Canada. (2015). Canada’s residential schools: The final report of the Truth and Reconciliation Commission of Canada (Vol. 1). McGill-Queen’s University Press.
Vrânceanu, A., & Lachat, R. (2021). Do parties influence public opinion on immigration? Evidence from Europe. Journal of Elections, Public Opinion, and Parties, 31(1), 1–21.
White, S., Nevitte, N., Blais, A., Gidengil, E., & Fournier, P. (2008). The political resocialization of immigrants: Resistance or lifelong learning? Political Research Quarterly, 61(2), 268–281.
Wilkes, R., & Corrigall-Brown, C. (2011). Explaining time trends in public opinion: Attitudes toward immigration and immigrants. International Journal of Comparative Sociology, 52(1-2), 79–99.
Wilkes, R., Guppy, N., & Farris, L. (2008). No thanks, we’re full: Individual characteristics, national context, and changing attitudes toward immigration. International Migration Review, 42(2), 302–329.