


Introduction
A recent Wall Street Journal article (Kent and Adam, 2018) reports that large investors and banks are monitoring ever more closely the carbon footprint and mitigation strategies of firms perceived to be contributors to anthropogenic climate change. This greater scrutiny reflects a widely held belief that unmitigated human-based CO2 emissions may affect the long-run profitability of enterprises that are not adaptable to climate science-induced market and political forces. In response, many firms increasingly are choosing to be proactive in measuring, disclosing, reducing, and mitigating CO2 emissions as part of an organizational strategy designed to address (or at least appear to address) carbon-related climate impacts (CDP, 2017). At the center of those responses is an emergent set of market institutions and organizations that are designed to both facilitate disclosure and present options for emission mitigation. Central to the argument that market externalities associated with CO2 emissions can effectively be measured and mitigated is the identification, standardization and costing methods reflected in modeling constructs designed explicitly to identify the social cost of carbon (SC-CO2).
While SC-CO2 models have had a significant impact on public-sector decision-making processes in the United States and abroad, markets also have arisen across the world in an attempt to establish a market- 3 based price, rather than a model-based price for carbon emissions. It is important to note the distinction between these two methodologies—market prices may, or may not provide any information about the broader global social cost structure of a unit of CO2. Rather, market prices are responding to the contemporaneous interaction of buyers and sellers who agree to consummate a mutually beneficial exchange on a margin of valuation that reflects a variety of incentives—incentives that may be unrelated to actual mitigation of the impact from emitting a unit of CO2, and that may not have any relevant impact on mitigating the externality costs associated with climate change. However, for private firms that are looking to signal concern about their carbon footprints, it is not unreasonable that the formal SC-CO2 model estimates are helping to bound current and future price (or cost) expectations associated with CO2 emissions.
In the United States, formal market prices for a unit of CO2 emissions are limited, existing only primarily in the Regional Greenhouse Gas Initiative or RGGI (implemented in nine East Coast states since 2009) and the California Cap and Trade Program (since 2012). Since 2009, however, a growing number of companies have begun establishing their own internal carbon price (CDP, 2017). For some market observers, this might seem to reflect imprudent management of these private organizations considering the limited scope of carbon markets, the lack of a coherent policy framework in the United States to incentivize private CO2 emission reductions, and the potentially large costs and risks associated with unilaterally placing limits on CO2 emissions. Accordingly, there has been a growing interest in the precise motives behind private-sector carbon pricing and the pricing methods employed. While researchers and private-sector executives alike hold a wide range of beliefs about the relationship between internal carbon pricing, SC-CO2 estimates, the threat of future regulatory schemes, and shifts in investor and shareholder values, little has been done to effectively compare the prices, motives, and methods of internal carbon pricing across all U.S. companies that are pricing carbon internally.
As an introduction to the topic of private-sector initiatives to internally price (and/or cost) carbon, an overview of SC-CO2 methodologies is provided to set context for how governments and private entities establish a value for carbon emissions. This is a critical first step in understanding business motives to internally price carbon for the following three reasons. First, social cost of carbon modelling methods underpin a federal regulatory framework for carbon mitigation and increasingly influence the dialog around pricing (or taxing) frameworks for targeted carbon reduction regulations. Second, it is likely that businesses are relying on the conceptual frameworks reflected in social cost models to scope out appropriate bounds for internal pricing methodologies in the face of a host of surrogate market mechanisms that reveal wide disparity in carbon emission price signals. And finally, some businesses are internally pricing carbon as a way of increasing the sophistication of expected returns analysis for investments in long-lived assets that may be subject to future regulation-imposed carbon reduction mandates—prudence would suggest that SC-CO2 analysis will be an important contributor to the structure of potential future mandates.
An Abbreviated History of Carbon Politics
While it was not the first discussion of global climate change, NASA scientist James Hansen testified to the U.S. Senate in 1988 that man-made global warming had begun (Shabecoff 1988). In 1990 the first assessment report was released by the Intergovernmental Panel on Climate Change (IPCC) concerning CO2 emissions from human activites and their suspected contribution to global warming. During that same year, the United Nations established the Intergovernmental Negotiating Committee (INC) for a Framework Convention on Climate Change (UNFCCC). This also was the same year that Finland and Poland established a carbon tax, becoming the first countries in the world to adopt policies that sought to create action around the reports developed by the IPCC. In 1992, President George H. W. Bush, along with representatives of 171 other countries, attended a UN conference held in Brazil—informally known as the Rio Earth Summit—in which the UNFCCC was signed into action. The following year, the Clinton administration proposed a tax on energy consumption. The proposed bill excluded wind, solar, hydro, and geothermal energy, essentially making the bill a carbon tax. The B.T.U. tax passed through the House but stalled in the Senate. In 1997, a UNFCCC conference in Japan produced the Kyoto Protocol, which stated that global warming was occurring and that it was likely human induced. Although then vice president Al Gore signed the protocol on behalf of the United States, the protocol was never ratified in the Senate and the potential for US participation in the protocol ended soon after the election of President George W. Bush. In his decision, President Bush relied on a claim that the United States was in an energy crisis and that regulatory constraints on CO2 emissions would dampen prospects for U.S. economic growth. Even though the Kyoto Protocol was not ratified explicitly, many private enterprises and government agencies began cultivating a sense of urgency in their commitment to reduce CO2 emissions and to do so through various kinds of pricing and mitigation schemes that would rally their constituencies (Dessai 2001, 3).
In 1994, Executive Order 12898 was issued by the Clinton administration to create the Interagency Working Group on Environmental Justice. This working group focused on the identification and potential policy solutions to environmental harm reflected in various government agency policies and procedures. The working group also fostered research and discussion about cap and trade schemes, which had been used previously by the EPA to address the emission of non-carbon based pollutants (EPA 2018). While federal legislation seemed to be mired in political wrangling, the California Global Warming Solutions Act, passed in 2006, included a state-wide cap and trade system that had an implementation date of January 1, 2012 and an enforceable compliance obligation beginning in 2013 (California Air Resources Board 2019). In addition, nine states on the East Coast created the Regional Greenhouse Gas Initiative (RGGI) in 2009, using an auction-based system to sell carbon credits (RGGI 2019).
Later, the Obama administration agreed to the Copenhagen Accord (2009) followed by the Paris Accord (2015) and then organized the Interagency Work Group on the Social Cost of Carbon (IWG). This 5 working group was tasked with establishing a single set of SC-CO2 estimation tools that could be applied within relevant U.S. regulatory frameworks that sought to mitigate the effect of CO2 emissions on global climate change. The estimates that emerged from the IWG were formulated using a combination of three SC-CO2 models: the FUND, DICE, and PAGE models. Over time, the models have steadily evolved in ways that reflected greater sophistication in climate science, advances in modeling technologies, and a more complex interaction between climate and granular-scale human and natural systems. However, each of the selected model frameworks has been criticized for imbedded assumptions that some critics found too constraining, and the Trump administration disbanded the IWG shortly after Trump took office (Frisch 2017). Still, some evidence suggests that a SC-CO2 modeling framework is currently being used to establish a carbon price in at least 40 countries around the world to frame various climate-related policies (Carbon Tax Center 2017a).
Definition and Uses of the Social Cost of Carbon
According to the EPA, the social cost of carbon is defined as “a measure, in dollars, of the long-term damage done by a ton of carbon dioxide (CO2) emissions in a given year. This dollar figure also represents the value of damages avoided for a small emission reduction (i.e., the benefit of a CO2 reduction)” (EPA 2017). SC-CO2 models draw heavily upon both point and interval forecasts from climate models and from their linkages to both direct and indirect economic impacts. (Thompson, 2018) Most climate models—and by extension SC-CO2 models—are dynamically evolving as knowledge gets refined through the process of active scientific discovery.1For example, the extensive catalog of work by Judith Curry and colleagues at Climate Etc. continues to challenge claims of consensus scientific narratives surrounding dynamic climate change drivers. See judithcurry.com Also see the recently study released by the National Academy of Sciences (2017) Pindyck (2016) has documented some of the inherent modeling challenges associated with estimates of SC-CO2 that are currently being used to frame global climate change policy. In spite of an active and ongoing debate among prominent scientists across a broad spectrum of climate-related disciplines, SC-CO2 estimates are still used extensively in certain domains. First, the estimates can be used in assigning an implicit cost to CO2 emissions related to various government programs—those that both impose regulatory constraints and those that are designed to incentivize movements away from CO2-based emissions. Second, SC-CO2 estimates are widely referenced by private enterprise managers who seek to establish a credible brand that identifies them as socially responsible actors in their market spaces. Finally, the government’s estimates are used as a benchmark by private organizations to assess the regulatory and financial risks associated with the deployment of capital that might be subject to regulatory constraints or controls imposed on CO2 emissions at some future date.
Impact of the SC-CO2 on United States Economic Policy
As of 2019, the Federal Register identifies SC-CO2 as a factor in 55 federal regulatory “final rules” and a further 22 “proposed rules.” These regulations include energy-saving programs, forest conservation regulations, fuel-economy standards, and emissions performance guidelines. While no form of national or state carbon tax has been established, SC-CO2 estimates have been used widely to justify carbon-reducing policies. For example, an emissions regulation for light-duty vehicles promulgated by the EPA in 2010 was estimated to impose $350 billion in upfront technology costs. The EPA estimated societal benefits of that rule—including impacts on energy security, refueling, local air pollutants, accidents, noise, and congestion—to be $280 billion (thereby creating a net loss of $70 billion). The policy may not have been justified on its merits using traditional benefit-cost methodologies. However, after including the IWG’s estimate of the social cost of carbon, the policy was estimated to prevent an additional $170 billion in social costs (creating a net gain of $100 billion), suggesting that the policy was able to pass a positive net benefit threshold. If the price per ton of CO2 used by the EPA were lower (due to the use of a higher discount rate in SC-CO2 models for instance), then the projected social cost reduction would be less, and the policy may not have been justified (Nordhaus 2017).2William D. Nordhaus received the Nobel Memorial Prize in Economics on October 8th, 2018 for integrating climate change factors into long-run macroeconomic analysis. See Nobel Media AB, “The Prize in Economic Sciences 2018,” NobelPrize.org, 2018, (http://www.nobelprize.org/prizes/economics/2018/summary/)
The use of SC-CO2 estimates in policymaking have been frequently challenged, but the U.S. Ninth Circuit Court of Appeals ruled in 2009 that “[w]hile the record shows that there is a range of values, the value of carbon emissions reduction is certainly not zero.”3Center for Biological Diversity v. National Highway Traffic Safety Admin. 538 F.3d 1172 (9th Cir. 2008). Since the ruling, the U.S. government has moved forward in applying the SC-CO2 to policy making. The emerging consensus reflected in judicial rulings suggests that a judicial threshold of climate risk has been broached in ways that merit use of the SC-CO2 in policy making despite the inherent uncertainty reflected in model estimates. Even so, President Trump signed the Presidential Executive Order on Promoting Energy Independence and Economic Growth, which disbanded the IWG and withdrew the United States from the Paris Accord— at least temporarily. In addition, President Trump has recommended the appointment of individuals who are on record as being skeptical of the consensus claims of SC-CO2 models as a framework for carbon pricing to lead the Council on Environmental Quality (Kathleen Hartnett White—later withdrawn) and the Environmental Protection Agency (Andrew Wheeler—currently acting director).4The National Environmental Policy Act (NEPA) established the Council on Environmental Quality (CEQ) within the Executive Office of the President to ensure that federal agencies meet their obligations under NEPA. In addition to NEPA implementation, CEQ also develops and recommends national policies to the president that promote the improvement of environmental quality and meet the nation’s goals. The CEQ also is assigned responsibilities under NEPA and other statutes and executive orders, including overseeing the Office of Federal Sustainability (OFS). See the US government Council on Environmental Quality home page, https://www.whitehouse.gov/ceq/).
In spite of the changing political environment, many private enterprises continue to affirm a commitment to internally determined CO2 mitigation goals and seek to align their internal decision processes with the Paris Accord.5 As an example of private commitment to funding climate change policies, Michael Bloomberg committed to personally finance the United States’ share of the Paris climate accord budget. See Telegraph Reporters, “Michael Bloomberg to Pay $4.5m to Cover US Contribution to Paris Climate Pact,” Telegraph,April 23, 2018,https://www.telegraph.co.uk/news/2018/04/23/michael-bloomberg-pay-45m-cover-us-contribution-paris-climate/. Furthermore, a multitude of recent lawsuits have resulted in even stronger support for the use of a SC-CO2 in government policy. An August 2016 ruling by the 7th U.S. Circuit Court of Appeals for the Seventh Circuit on a lawsuit filed by the Air-Conditioning, Heating and Refrigeration Institute; the North American Association of Food Equipment Manufacturers; and small business, Zero Zone, Inc.,6Zero Zone, Inc., et al. v. United States Department of Energy, et al., Nos. 14-2147, 14-2159 & 14-2334 (consolidated) (7th Cir. 2016). For interpretive details on the case and subsequent ruling, see Amanda Reilly, “Court Rules for DOE, Upholding Obama’s Social Cost of Carbon,” E&E News, August 9, 2016, https://www.eenews.net/stories/1060041382. upheld the use of SC-CO2 estimates in government regulatory decisions. In April 2016, an administrative judge in Minnesota ruled that SC-CO2 estimates being used in policy decisions should be “supplanted with estimates based on federal calculations.” (Murphy 2016) In June, 2018 the Minnesota Public Utilities Commission affirmed the ruling by publishing requirements for “updated social cost of carbon emissions, increasing to a range of $9.05 to $43.06 per short ton beginning in 2020.” (Citizens Utility Board 2018) These court rulings, among others, make it less likely that estimates of SC-CO2 will disappear from future U.S. federal CO2 emission regulations and policies, regardless of current political posturing.
State-Level Carbon Pricing Initiatives
As the federal government continues to wrestle with the politics of policies driven by SC-CO2 some states are expected to continue to push toward broader use of a SC-CO2 modeling framework in their policy design. Regulatory agencies in Colorado, Maine and Nevada have been using SC-CO2 estimates and methodologies in the decision making process for new power plants (though the plants are not required to choose the cleanest option). Minnesota also employs SC-CO2 estimates to assist in determining net metering compensation for solar panels. The broadest use of SC-CO2 estimates is in New York, where SC-CO2 has been used to determine solar panel subsidies and establish incentives for nuclear power generators. Illinois has a similar program that utilizes SC-CO2 estimates to frame various subsidies and incentives related to reducing carbon emissions. While a growing number of states use SC-CO2 estimates in designing their individual environmental policies (Fairly 2017), no state currently has imposed a direct carbon tax (Gleason 2018).
In 2017, the Carbon Tax Center provided a comprehensive report on legislation being considered in other states where various interests are advocating for carbon taxes. Although voters in the state of Washington rejected a carbon tax in 2016 and 2018 (DePillis 2018), similar votes are possible in Oregon, New York, Massachusetts Rhode Island, and Vermont. The push to impose state-level carbon taxes is promoted primarily by interest groups frustrated by the lack of a national carbon tax, but these state-level initiatives face many difficulties. In addition to administrative challenges, it is difficult to compete with out-of-state companies that do not face carbon taxes and consumers may cross state borders to make certain purchases to avoid the tax. (Carbon Tax Center 2017b). Ultimately, many commentators have suggested that only a national carbon tax would be broad-based enough to have a significant impact on worldwide CO2 levels. Thus, interest groups and organizations continue to press for a coordinated national and international policy towards CO2 emission neutrality.
Carbon Markets
In order to address the difficulties of implementing a carbon tax, some government agencies and some private-sector organizations have cultivated private markets for carbon. An article by Richard Conniff with Smithsonian magazine has detailed this process at length. The article explains how, in most cases, government programs appear in the form of cap and trade programs whereby emission permits are issued to companies, thereby capping the amount of total emissions. Then the buying and selling of permits is allowed between participants of the program, allowing the market to let permits flow to their highest valued uses (Conniff 2009). One example of that approach is the nine-state (Connecticut, Delaware, Maine, Maryland, Massachusetts, New Hampshire, New York, Rhode Island, and Vermont) Regional Greenhouse Gas Initiative (RGGI). In that setting, each state sets a CO2 emissions limit for electric power plants and then auctions off licenses to local power plants allowing them to emit specified amounts of CO2. Auctions occur quarterly and emission permit prices generally range from three to six dollars per ton of CO2 emission (low being $1.86, high being $7.50). The revenue generated from sales of emission rights are to be allocated to various mitigation schemes chosen by each state within the RGGI (RGGI 2018).
Yet another example is the California Cap and Trade program. California passed Assembly Bill 32 in 2006, mandating a 15 percent reduction in carbon emissions by 2020 when compared to a “business as usual” model. As of January 1, 2008, California also requires emissions to be disclosed and tracked. As a part of the 2008 legislation, a cap and trade program was initiated in 2013 specifically to target carbon emissions in California. The California cap and trade system is a quarterly, single-round auction with a minimum price of $10 per credit, increasing by 5 percent per year (in 2012 dollars to account for inflation). Additional credits are available until 2020 if the price exceeds $40 per credit. After the 2020 auction, a hard cap of 334.2 million metric tons (MMT) will be established, and no additional credits will be sold. Then, in 2030, the cap will be lowered to 200.5 MMT. In addition, carbon offsets are designed to make up 8 percent of total compliance obligations through 2020; 4 percent between 2021 and 2025; and 6 percent from 2026 to 2030. Beginning in 2021, at least half of the offsets used for compliance must come from projects that benefit California directly (California Air Resources Board, 2019).
The majority of U.S. firms operate outside of such carbon pricing schemes, but many firms have started simulating the costs of such a program nonetheless. In some cases, private firms claim to use a CO2 shadow price for internal resource allocation mechanisms designed to provide useful metrics as a guide to business decisions related to CO2 emissions. In other cases, private-sector firms rely on external markets to execute their carbon emission reduction strategies (e.g., purchasing carbon offsets directly from independent brokers), and still in other cases, the shadow prices are used to tax internal business processes and reallocate resources within the firm. While shadow price methods are well developed within the theoretical literature, they continue to evolve in the empirical literature. Atkinson and Dorfman’s work (2005) work, published in the Journal of Econometrics, demonstrates some of the empirical challenges in computing appropriate shadow prices for CO2 emissions from electric industries that “produce bads” within their production process.
Economic and Political Trends in Energy Policy
Over the last three decades, energy consumption has made a significant shift from carbon-dense fossil fuels like coal to less carbon-dense fossil fuels like natural gas (EIA 2017). Although this is largely due to natural market forces related to the emergence of fracking technologies, government environmental policy has also shifted steadily in favor of wind and solar energy over the last decade. The Institute for Energy Research found that from 2010 to 2013, electricity related subsidies (involving renewable energies) increased 54 percent, reaching a total of $13.2 billion. Meanwhile, total U.S. direct energy tax credits and subsidies declined. In the specific case of fossil fuels, over the 2010-2013 period, tax credits and subsidies are reported to have fallen by 15 percent, to a total of $3.4 billion. (IER 2015). As carefully noted in the work of Sovacool (2017), the exact estimates for energy subsidies are complex and widely disputed. Sovacool’s research suggests that renewable energy investment faces significant disadvantages relative to the widely deployed array of explicit and implicit subsidies that benefit fossil fuel consumption and production. Furthermore, these subsidies present political challenges for other public and private efforts designed to limit greenhouse gas emissions.
In addition to the effect of direct and indirect subsidies on fossil fuels and renewable energy, it appears that renewable energy prices have fallen because of significant advances in production technologies. For example, a report by Lazard in 2017 found renewable energy to be cheaper than fossil fuels in many cases. That shift has helped renewable energy production to grow rapidly while fossil fuel-based energy production has slowed or even declined. Renewable energy production increased by 7 percent between 2010 and 2013 and accounted for 12 percent of the nation’s energy production in 2016 (Lazard 2017). Meanwhile, fossil fuel energy production has plateaued in recent decades. (EIA 2018b).
A recent study by the George Washington University Regulatory Studies Center (2017) found that green energy subsidies have increased in the last decade. This increase in subsidies is a corollary to the fact that SC-CO2 modelling frameworks have been more widely adopted by regulatory agencies and regulatory measures have increased in parallel. During the first year of the Trump administration, however, the New York Times reported that 67 rules affecting emissions reporting, fossil fuel regulations and green energy funding were rolled back or overturned (Popovich Albeck-Ripka, and Pierre-Louis 2018). While the effect of stronger environmental regulation remains a topic of ardent debate, it is a major factor in the design of business strategies when business costs are potentially impacted. A recent survey by the National Association of Manufacturers found that compliance with federal regulations was considered the largest future challenge affecting business (NAM 2017). Among federal regulations, another survey done in 2014 found that federal environmental regulation was the most costly to comply with, among federal regulations, for manufacturing firms (NAM 2014).
Private-sector emphasis on environmental awareness and green marketing is also increasing, but inconsistencies often arise between corporate public relations and corporate political actions (e.g., lobbying). A study by the Union of Concerned Scientists sampled 30 major energy, utility, industrial and materials companies. Of those 30 companies, 24 exhibited significant discrepancies between their public stances on climate change and their lobbying efforts. For example, ConocoPhillips publicly supports campaigns advocating cap and trade policies while their direct lobbying efforts focus on supporting members of Congress who consistently voted against legislation promoting climate change action, by significant margins. Another example is ExxonMobil, which made public statements both supporting the science substantiating climate change and committing to greenhouse gas reductions. However, the company’s lobbying expenditures consistently support organizations that openly oppose climate change action (Union of Concerned Scientists 2012).
Such inconsistencies could be attributed to “greenwashing”, or efforts designed only to cultivate perceptions of environmental responsibility. Another possible reason for the discrepancies is risk mitigation. Climate science is still openly challenged within the construct of the U.S. political climate, and U.S. policy makers have been slow to embrace broad-based applications of a carbon tax or regulatory policies. Many companies that seem to embrace conflicting strategies may be hedging their bets by supporting groups on both sides of the CO2-induced climate change argument so they can influence carbon tax policy if it is implemented.
Carbon Credits and Other Private Market Initiatives
A host of recent surveys suggest that consumers attach value to their perceptions of corporate environmental impacts. A Nielsen Company (2015) survey found that 72 percent of consumers were willing to pay more for products and services from companies committed to positive social and environmental impacts (an increase of 17 percent since 2014). A Tiller survey (2014) found that approximately four of five Americans (78 percent) agree that corporations have a responsibility to adopt “green behaviors” and that 72 percent of respondents said that they do not care why a company goes “green” as long as they do so. In addition a 2010 Environmental Leader survey of 370 of the respondents, mainly advertising and marketing executives, found that 82 percent of companies planned to expand green messaging in their marketing campaigns (Business Sector Media 2010).Furthermore, a 2017 Sustainable Brands survey found that 94 percent of Fortune 200 companies had specific sustainability targets, up from 77 percent in 2012 (Winston 2017). In a December 2016 speech to the Stanford Business School (Simmons 2016), Al Gore reportedly made the following assessment, “The sustainability revolution is increasingly driven by local projects closer to the ground and enlightened self-interest in the private sector. And central to that movement . . . is the role of investors in spotting opportunities and financing forward-looking businesses.” As an example, Apple recently celebrated its claim to be completely powered by renewable energy in the United States (Apple 2018).
One of the primary forms of strategic market posturing that companies utilize to communicate credible commitments to carbon neutrality is by the use of carbon offsets. Carbon offsetting is a system that provides companies with “carbon credits” as they invest in projects that mitigate the effects of their CO2 footprints on climate change (CDP 2017). The Clean Development Mechanism (CDM) is an organization that claims responsibility for certifying the measurement of a Certified Emissions Reduction Unit (CERS). One carbon credit is designed to offset the production of one metric ton of CO2 and it can be purchased or sold. Because it is relatively expensive for companies to offset their CO2 emissions inside the United States, a company can earn carbon credits by funding or purchasing projects in other countries. That option creates a framework wherein companies can make claims that they are committed to reducing global CO2 concentrations without changing their own domestic CO2 emissions. Through such offset projects, many companies have claimed “carbon neutrality” without reducing their environmental impact from emissions. Many experts have criticized carbon offsetting for this reason, claiming that it ultimately has no positive environmental effect and actually undercuts efforts to curb climate change directly (McGrath 2015).
As public opinion and policy have shifted towards reducing CO2-induced climate change, the demand for carbon offsets has increased. That rise in demand is reflected in the emergence of organizations that establish carbon offset projects, specialize in green advertising, or report on emissions and sustainability. For example, CDP, formerly the Carbon Disclosure Project, has surfaced as the largest reporting and sustainability planning organization in the world; it claims that the businesses reporting to CDP represent one fifth of global carbon emission (CDP 2019). Another example is TerraPass, a company that provides a certificate of carbon neutrality to companies and individuals. After businesses or individuals calculate their own carbon footprints, the equivalent in carbon offsets can be purchased from TerraPass, which then invests in climate change mitigation projects (TerraPass 2019). Finally, groups like Gold Standard monitor the effectiveness and validity of carbon offsetting projects (Gold Standard 2019). When it comes to marketing, companies that partner with CDP, TerraPass, and Gold Standard can claim to have a positive impact on the environment and can appear more prepared for policy changes, which may satisfy investors; however, there is an ongoing debate over the ultimate climate impact of such institutions and carbon offset suppliers in general.
Overview of CDP
CDP was established in 2000 by a group of environmental activists in the United Kingdom. In 2003, the organization sent out its first request for carbon data to many corporations and received 235 responses back. Six years later, in 2009, CDP received more than 6,000 responses from companies operating in over 60 countries (Newell 2010). In 2010, 82 percent of Global 500 companies responded to requests for disclosure to CDP (CDP 2017). As the trend of private organizations adopting formal reporting processes continues to expand in 2018, CDP claims that its reporting businesses experience a 67 percent higher return on equity than those companies that do not file reports.7We could not find any evidence of this claim being substantiated independently. CDP also claims that it has saved companies $53 billion dollars in direct CO2-related costs because of their investment in climate change programs (CDP 2019). In less than a decade, reporting to CDP has evolved into a standard for many companies. The CDP’s reporting process is comprehensive in scope and requires each organization to respond to a detailed set of questions. In that way, companies agree to be held accountable for reporting on estimated climate impacts, and mitigation efforts, throughout the year (CDP 2017).
The majority of companies that unilaterally choose to adopt a carbon pricing mechanism as part of their business strategies generally establish a baseline for carbon emissions and set a goal to reduce carbon emissions by a certain percentage by a target year (i.e., 2020). Companies normally formulate a plan of action to reach the desired goal. CDP then records such plans of action in their company reports. For example:
- AVANGRID is committed to maintain its position as one of the leading American companies with fewer CO2 emissions per GWh produced. The Company’s strategy is focused on gradually reducing its intensity of GHG emissions by continuing along the line of electricity generation based on renewable sources. The goal for 2020 is a 25 percent reduction in the intensity of emissions per kWh generated compared to the year 2015. (CDP 2017a)
Summary of CDP Data Used in the Analysis
8All analysis in this section is derived from the researchers’ own calculations and findings using CDP data from: “Companies: 2017 Corporate Responses,”( https://www.cdp.net/en/responses). The CDP report repository reflects the self-articulated climate-change focused strategy statements of more than 1,090 companies, 525 of which are based in the United States. (CDP 2017). The scope for this paper was limited to the 67 U.S. companies (61 public and 6 private) within the CDP database that currently report utilizing an internal price of carbon to make strategic business decisions. In comparison, 515 companies worldwide reportedly use an internal carbon price. As of October 10, 2018, the market capitalization for the 67 enterprises range from a low of $684 million (Dean Foods Company), to a high of approximately $833 billion (Microsoft Corporation). The average market capitalization for all public companies in the dataset is approximately $75 billion. This small though significant group of companies provides an initial look into the kinds of companies engaged in voluntary reporting and the methods, processes and motives behind specific climate change-oriented business strategies.
Analysis in this paper reflects information that companies reported to CDP for 2017. Data contained in the CDP climate change report consists of company responses to 15 different inquiry categories. The level of detail provided in the company reports reflects the chosen narratives scripted by company officials charged with reporting responsibility. Many sections of the report are related to internal pricing of carbon, but the categories of inquiry most vital to this analysis were those specifically related to business strategy (section two). In the strategy section, CDP prompts companies to disclose information about how climate change is integrated into their business strategies and whether or not the reporting company implements an internal price on carbon. This section of each company’s report provides a rich contextual repository of narratives relevant to how individual companies are articulating their carbon pricing strategies.
Analysis in this paper reflects information that companies reported to CDP for 2017. Data contained in the CDP climate change report consists of company responses to 15 different inquiry categories. The level of detail provided in the company reports reflects the chosen narratives scripted by company officials charged with reporting responsibility. Many sections of the report are related to internal pricing of carbon, but the categories of inquiry most vital to this analysis were those specifically related to business strategy (section two). In the strategy section, CDP prompts companies to disclose information about how climate change is integrated into their business strategies and whether or not the reporting company implements an internal price on carbon. This section of each company’s report provides a rich contextual repository of narratives relevant to how individual companies are articulating their carbon pricing strategies.
Company Profiles
The 67 companies included 61 companies that are publicly traded and 6 companies that are privately held. This distribution was no surprise; since public companies face stringent reporting requirements making them more sensitive to the need to fully inform investors and shareholders of potential climaterelated business risks that might exist within their planning horizons.
Table 1 U.S. Companies Internally Pricing Carbon by Industry9See appendix 1, 2, and 3 for details on individual companies.
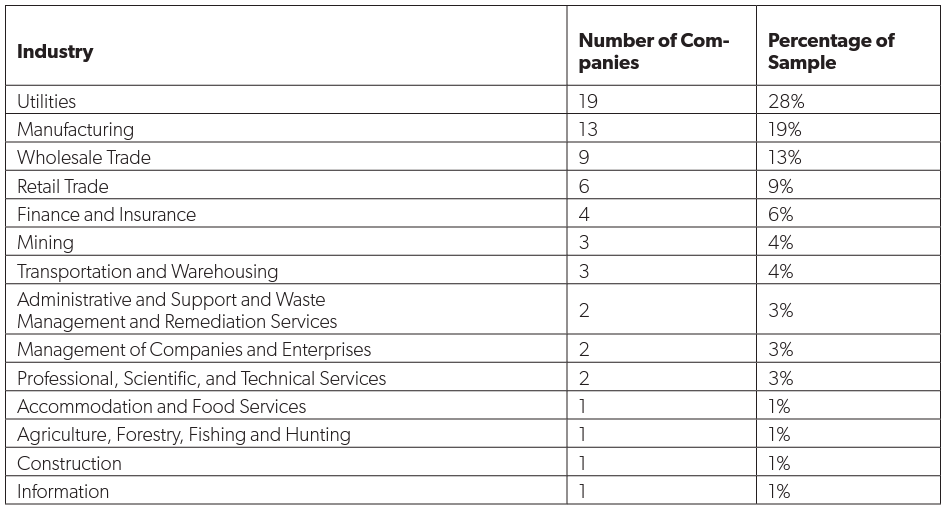
There was also a wide range of industries represented by the 67 companies (as determined by NAICS codes), the most common being utilities (28 percent), manufacturing (19 percent) and wholesale trade (13 percent). A full industry breakdown is provided in table 1.
While only a few preliminary industry trends can be identified from table 1, as more companies report to CDP, further research will allow for a more adequate examination of how carbon pricing motives and methods move along industry lines. It is also likely that the nature of these developments will depend heavily upon policy surrounding carbon pricing and the internal carbon pricing motives of each enterprise.
One immediately observable industry fact is the surprising diversity of industries involved in internal carbon pricing. Of the the 20 NAICS industry divisions, 14 include companies that are internally pricing carbon. It is less surprising, however, that utilities appear to be the most common industry internally pricing carbon. A 2018 survey by Utility Dive found that among utilities industry firms, 68 percent were worried about bulk power system reliability (which is highly susceptible to natural disasters), 68 percent expressed concern about integrating renewable energy (up 8 percent from 2017) into their production, and more than 50 percent were concerned about both state regulatory reform and state clean energy mandates (Gahran 2018).
Methodology
Analysis of company-specific CDP reports on the usage of carbon mitigation strategies was completed by the means of summative content analysis of the language used in each company report. Summative content analysis methodologies are explored in the work of Hsieh and Shannon (2005); although their particular application is within the context of medical research, it is directly applicable to the work in this paper. The research design in this paper attempts to identify language markers related to carbon pricing methods and motives reflected in the work of Ahluwalia (2017) that classify and categorize the descriptive language contained within each individual company’s CDP report. All reported information contained within CDP reporting sections 2.2c (Motives) and 2.2d (Methods) is reviewed to distill important summative insight about the motives and methods behind each organization’s deployment of carbon mitigation tools within the company’s strategic and tactical management approaches to mitigating the effects of carbon emissions.
Three research assistants were randomly assigned responsibility for analyzing the text in each of the two targeted reporting sections. Specific language markers were identified prior to the analysis. A sample of nine randomly selected reports were analyzed by all three research assistants. After their analyses and language categorizations were completed, the research assistants met and discussed commonalities and discrepancies in their individual categorizations. This created context for collaboratively harmonizing the language markers that would be included within each category. Appendices 1 and 2 provide specific content analysis for selected reports and how language markers were identified and categorized. The remaining 58 company reports were individually assigned to a research assistant for identification and categorization of both methods and motives for using carbon pricing schemes internal to each company.
Initially, summative content analysis was employed to synthesize publicly disclosed sustainability reports in conjunction with CDP reports from each of the 67 companies. This provided greater depth of information about each company. Sustainability reports are a common practice for businesses to market themselves to shareholders, government agencies, and even the public, but they contain little specific information about carbon pricing motives, and often appeared to be more aimed more at selling the company to investors and shareholders than detailing concrete motives and corporate strategy. Reports from CDP, on the other hand, were detailed, specific and arguably more credible. They are more credible, first, because CDP reports provided individual sections of their report that specifically addressed carbon pricing values and motives, whereas sustainability reports provided only general statements regarding sustainability goals. Second, because CDP is a third-party organization, bias is likely to be less prevalent as compared to sustainability reports which are designed and disseminated by individual enterprises. Finally, CDP has a rigorous process of reporting and verification, further validating the quality of their reports.10For more details, see CDP, “Verification,” https://www.cdp.net/en/guidance/verification.
Categories of Internal Carbon Pricing Methods
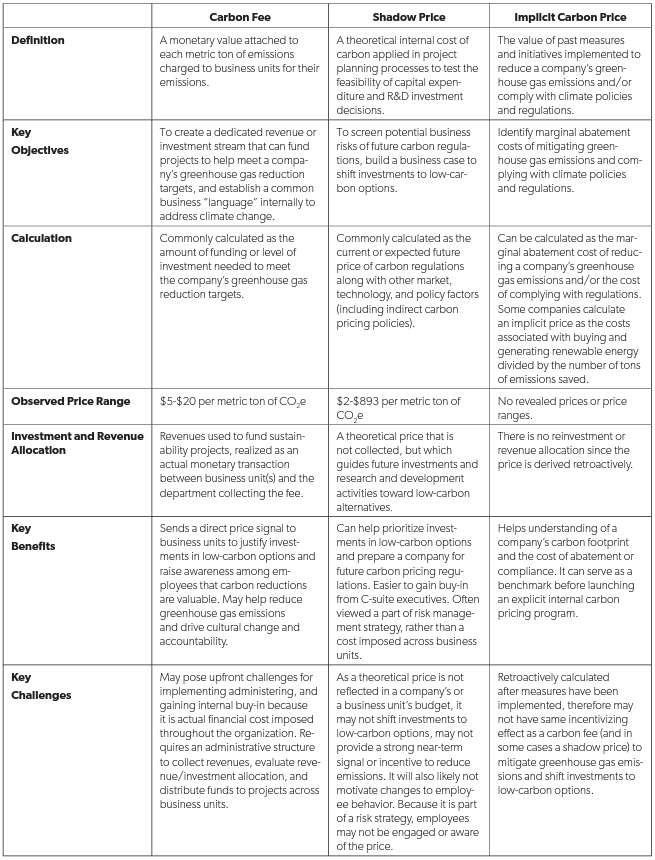
Ahluwalia (2017) outlines three of the most common methods of internally pricing carbon within private organizations: carbon fee, shadow price, and implicit price. Table 2 is reproduced from that research. Ahluwalia’s work included a broad scope of inquiry that included the following: a review of CDP reports filed by Fortune 500 companies reportedly considering or implementing internal carbon pricing, in-depth interviews with corporate executives and sustainability practitioners, an in-depth case-study review of four global multi-sector companies, and observations gleaned from an internal carbon pricing workshop. The motivation for our research is to add value to the work of Ahluwalia and provide an updated view of the evolving landscape of private-sector enterprise engagement with internal carbon pricing strategies, methods and motives. While the research approach used in this work is less comprehensive in scope than Ahluwalia (2017), the in-depth focus of this research on an updated database of all U.S. firms reporting a carbon pricing strategy to CDP adds value by refining our understanding of the evolving nature of private-sector strategic posturing in a world characterized by dynamic advances in the state of scientific knowledge and uncertainty about the timing and structure of potential government regulatory constraints on carbon.
Table 2. Methods of Pricing Carbon
Summative content analysis of CDP reports suggested two distinct means of utilizing a carbon fee methodology: “carbon offsetting” and “regulatory fee.” Table 3 depicts these suggestions. Both categories imply that the internal cost of carbon for a company depends on actual external costs. In the case of carbon offsetting, such external costs come from purchasing carbon credits, a process detailed earlier in the paper. A regulatory fee methodology incorporates the regulatory costs of carbon emissions into the company’s internal carbon pricing strategy.
It is important to keep in mind that each of the four methods (carbon offsetting, regulatory fees, shadow prices, and implicit prices) can be deployed independently or jointly, depending on the value that each provides within the organization’s strategic objectives. The analysis in this paper relies on the language used by organizations that are self-reporting on internal pricing methodologies. There is an extensive literature that defines both shadow prices11Methods for measuring shadow prices are closely related to the constrained optimization literature of mathematical programming. Within the constrained optimization framework, the shadow price (often called a ‘dual value’) is the change in the objective function of the optimal solution, which is the result of a small change in the value of a constraint. (see Bein, 1999) and implicit prices, and there is general agreement that implicit pricing is a subset of the broader category of shadow price theory. However, in the language utilized by self-reporting entities referenced in this analysis, and in the categorization provided by Ahluwalia (2017), shadow prices are theoretical constructs based on the modeling of trade-offs inherent in the deployment of “scarce” resources whereas implicit price is an empirically constructed value based generally on hedonic methods. Miranowski and Hammes (1984) provide an instructive example of implicit price methodologies. While table 2 from Ahluwalia does not give an observed price range for implicit pricing, many companies utilizing an implicit pricing strategy referred to empirical estimates such as Obama-era Social Cost of Carbon Estimates, which ranged from $36 to $42 per ton from 2015 to 2020 at a three percent discount rate (EPA 2017).
Table 3. Updated Methods
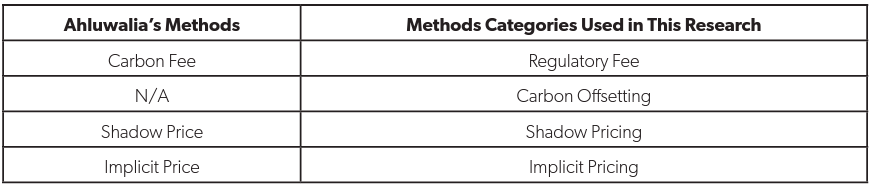
Methods of Internally Pricing Carbon
Figure 1 reports on the different carbon pricing methods that companies are utilizing as part of their internal carbon pricing strategies, including implicit prices, shadow prices and carbon offsetting and regulatory fees.
Figure 1. Methods of Internally Pricing Carbon
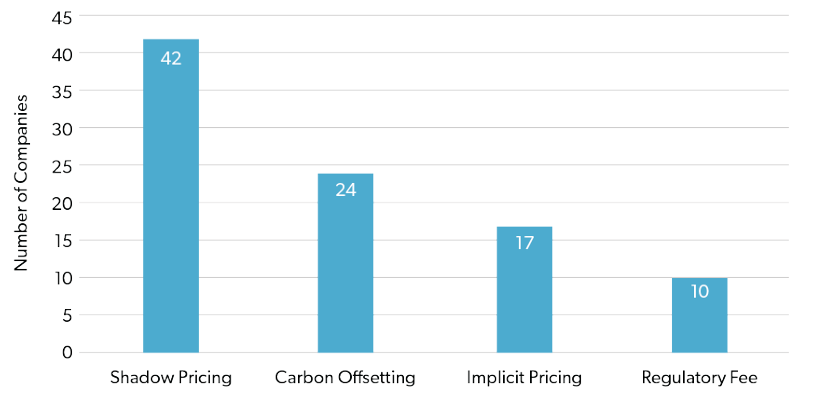
Shadow pricing dominates the methods most referenced in the CDP reports. Figure 2 examines the different combinations and frequencies of internal carbon pricing methodologies from the sample.
Figure 2. Combination of Methods by Popularity
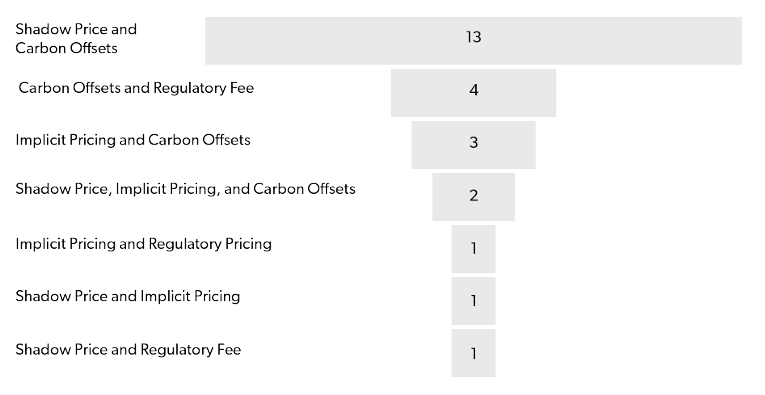
While shadow pricing and carbon offsets appear together with the most frequency, 44 of the 67 reporting companies use only one method for internally pricing carbon. Presumably because of cost and strategic complexity, it appears that most companies are very focused on targeting a specific method. Interestingly, regulatory fees are not a dominant factor in internal carbon pricing methodologies. While there has been evidence of a growing body of environmental regulation in the United States (at least up until the Trump administration), there appears to be limited political will to directly regulate carbon emissions—this is reflected largely in the scarcity of regulatory fees in our reported methodologies. Interestingly, many corporate CDP reports describe frustration with the lack of clarity regarding carbon pricing regulation. In the next section, CDP data will reflect that concern as companies identify the risk of future regulation as a common motive for internally pricing carbon.
Categories of Internal Carbon Pricing Motives
Just as companies differ in the methods they adopt for pricing carbon internally, the motives they offer for doing so differ markedly. Company motives are analyzed by responses to question CC2.2a of the CDP reporting template.122 The survey prompt for that section of the report is: “Please describe the process of how climate change is integrated into your business strategy and any outcomes of this process.” Again, the work of Ahluwalia (2017) provides a useful benchmark in providing six potential motives for internal carbon pricing. The motives are greenhouse gas reduction, carbon regulations, investor and shareholder relations, resilient supply chains, competitiveness, and corporate sustainability. Individual CDP reports suggested motives similar to those identified by Ahluwalia (2017). After carefully reviewing summative content of the CDP report narratives, adjustments to categories were made to and align with the precise statements of internal pricing motives in section 2.2 of each CDP report.
Table 4. Updated Motives
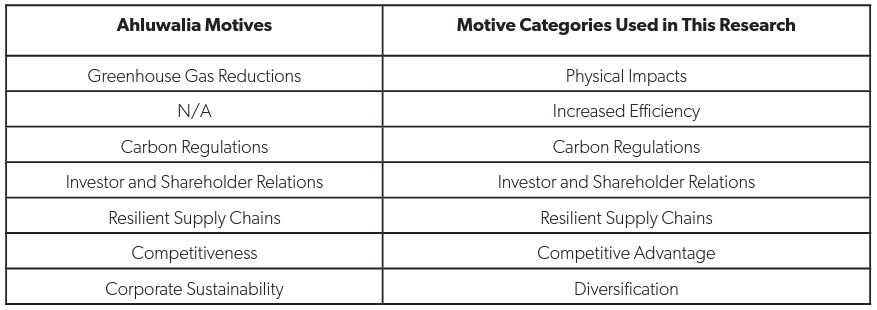
As seen in table 4, “corporate sustainability” was changed to “diversification.” This was necessary because “corporate sustainability” is so broad a term that other categories (addressing regulation, resilient supply chains, and physical impacts, for example) could fit within it. The unique aspect of corporate sustainability, not addressed by any other category, however, was diversification. In CDP report section 2.2, many corporations listed increasing diversification as a motive for integrating climate change into their business strategy.
Next, “competitiveness” was changed to “competitive advantage.” That change was made, again, because competitiveness is too broad a term and many companies listed having an “advantage over competitors” or another very similar statement as a motive for their sustainability strategy.
“Investor and shareholder relations,” “regulation,” and “resilient supply chains” were kept the same, but some additional clarification is needed for each category. Many companies stated that pleasing stakeholders (e.g., clients, customers, and investors) or maintaining their reputation was a motive for their sustainability strategy. Such statements fell under the category of “investor and shareholder relations.” Any statement specifically referring to current regulation or risk of regulation as a motive fell under the category of “regulation.” Company statements citing a concern for resilient supply chains (affected by climate change) were categorized in motive category “resilient supply chains.”
Lastly, the category “greenhouse gas emission” was divided into two categories: “increased efficiency” and “reduced physical impacts.” Yet again, this change was made for clarification of corporate statements to CDP, since virtually all companies reporting to CDP are attempting to reduce CO2 emissions in one way or another. Some companies stated a desire to become more efficient as a motive for their carbon pricing strategy while others stated concern over the physical impacts of climate change. Physical impacts cited include more frequent hurricanes, rising sea levels, and so on (note the difference between physical dangers of climate change and supply chain dangers of climate change as they are related but distinct categories).
Analysis of company motives was particularly challenging because all but 4 of the 67 companies had more than one motive for internally pricing carbon. The seven categories used for analysis proves effective because collectively they capture a comprehensive assessment of motives driving private-sector carbon pricing, yet each motive category is independent. Each company has multiple, independent motives for internally pricing carbon that fit clearly within the proposed motive categories (see appendix 1 for more in-depth analysis of linking statements in each CDP report to the seven categories).
Motives for Internally Pricing Carbon
In order to compare internal carbon pricing motives for the 67 companies, we identified the total number of companies that listed each motive explicitly. This resulted in each of the seven motives appearing in the carbon pricing strategies of between 25 to 51 companies. This allowed an accurate measurement of the most common motives behind company strategies to internally price carbon. Figure 3 reports on the most common company motives.
Figure 3. Motives for Internally Pricing Carbon
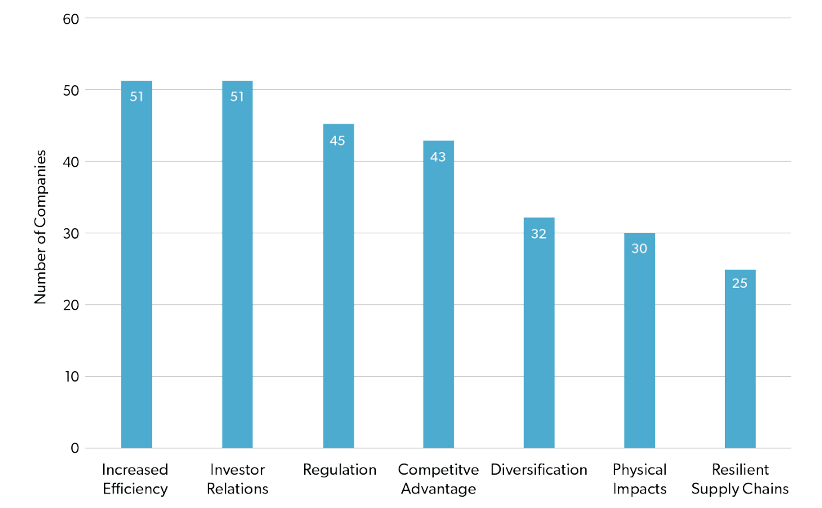
Investor relations and efficiency are the most common motives, followed closely by regulation and competitive advantage. As mentioned earlier, consumers are becoming increasingly sensitive to the environmental posturing of companies. This is likely animating greater investor interest in the market signals reflected in environmental reputation.
Still, these findings are counter to what many might expect—that regulation would be the primary driver behind private sector climate action. Chang (2017, 64) asks the question, “Why would firms adopt internal carbon pricing without external pressure from regulations?”. A possible answer is that prudent enterprise managers could be incorporating internal carbon pricing methods into their long-term business strategy if they perceive a future return risk to long-lived assets that might be subject to future regulation. It is also possible that managers perceive opportunities to increase operational efficiency in a world of climate change uncertainty; relying on the claims of climate science, they may actively manage reductions in carbon emissions as a way to mitigate perceptions of climate-related risk among various enterprise stakeholders.
While many companies, especially from the utilities sector, have voiced a desire for greater regulation of carbon emissions (Gahran 2018), there are a number of potential underlying motives. First, companies may be trying to maximize competitive advantage, a motive that was listed by 43 of the 67 companies. This makes intuitive sense, since utility companies that support carbon-related regulation—which likely would be implemented eventually regardless of their efforts—are more prone to influence such legislation in a way that favors themselves. Such an approach is designed to raise barriers to entry for other companies, maintain loopholes, and mitigate regulatory risk. Second, Chang’s previously cited research refers to the Porter Hypothesis in describing how environmental regulation may actually increase corporate profit by pushing corporate efficiency, which happened to be the most important motive category based on CDP reports.
The relationship between regulation and efficiency, as well as section 4 of Chang’s 2017 research, further emphasizes the interconnect ability and multiplicity of motives driving internal carbon pricing (though it is important to re-emphasize that each motive itself is unique and defined independently). Figure 4 gives the most common combinations of internal carbon pricing motives among the 67 companies reporting to CDP, with the least common motives combined in a “low frequency” category.
Figure 4. Top Five Motive Combinations by Popularity
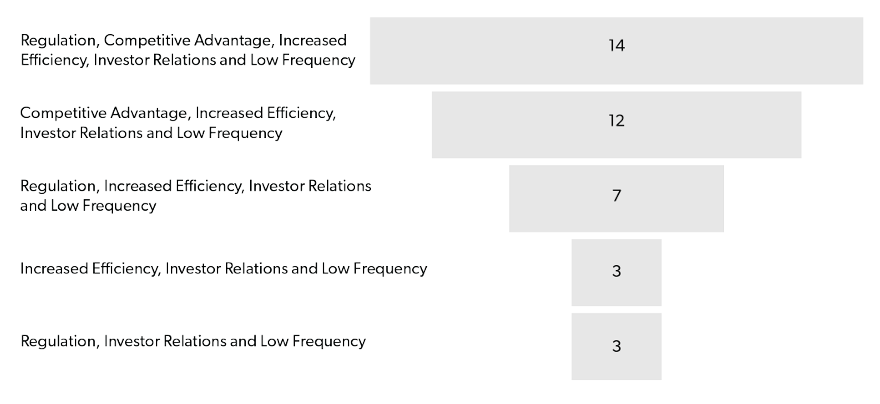
The conglomeration of certain combinations of motive categories suggests clusters of common environmental strategies among the 67 companies. One such common strategy (which is particularly noticeable and linked to the investor relations motive), is the substantial effort of companies to be perceived as environmentally friendly and have reputations of being “green.” Accordingly, many have criticized the private sector as being only mildly concerned about the direct environmental impacts of climate change and therefore guilty of greenwashing. Understanding the multiplicity of motives behind private-sector carbon pricing allows for a more nuanced analysis.
Included in the low frequency category in figure 4, both the “resilient supply chains” and “physical impacts” motive categories both refer to direct impacts of climate change. Interestingly, 43 of the 67 companies actually cited some direct form of environmental impact from climate change as a motive for their carbon pricing strategy. This suggests that the majority of the 67 companies internally pricing carbon are actually concerned about the cost implications that climate change will directly have on their business; depending on their methods of internally pricing carbon, the companies also appear to be committed to mitigating these risks. This is significant considering how slow public policy has been to implement such measures in a formal regulatory framework. The private sector may not only be capable of independently mitigating its own carbon emissions, but such private initiatives may also be more effective than if businesses were compelled to conduct CO2 mitigation solely through regulatory means. The range of privately determined internal carbon prices further supports this argument.
Range of Privately Determined Internal Carbon Prices
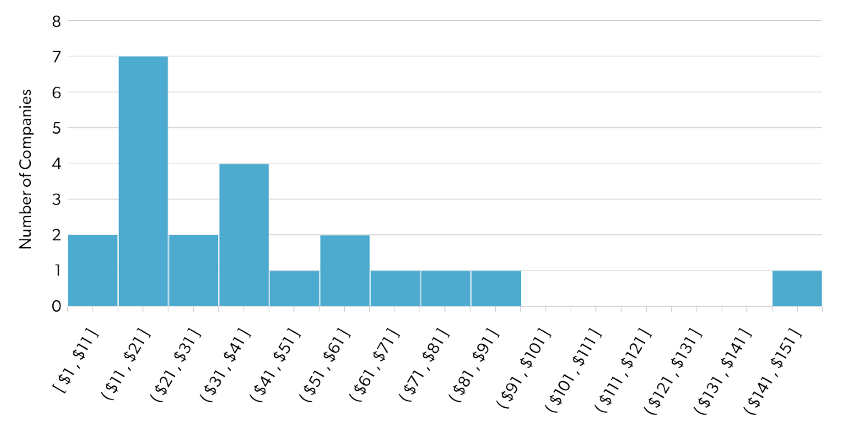
Of the 67 companies reporting use of an internal carbon price, only 22 disclosed a specific price in their CDP documentation. Figure 5 reports on the range of reported carbon prices across those 22 companies. It is interesting to note that companies are using a wide range of carbon prices as part of their strategic decision-making processes. This may be a reflection of the underlying uncertainty associated with various carbon price modeling approaches, independently revealed market prices for carbon, and individually determined risk factors. Reported prices range from $1 to $150 per ton, with an average price of $40.09 and a median price of $32.83.
The average internal carbon price of the 22 companies is remarkably close to the Obama-era SC-CO2 estimates of approximately $37 per ton at a standard 3 percent discount rate in 2016 (EPA 2017). The proximity of these price estimates suggests a number of important relationships. First, there may be correlation between SC-CO2 estimates and internal carbon prices. SC-CO2 estimates play a significant role in the threat of regulation, which remains a major motive for internal carbon pricing. Furthermore, the most common form of internal carbon pricing by far is shadow pricing, which accounts for the future regulated cost of carbon and would most likely rely upon SC-CO2 estimates. The proximity of SC-CO2 estimates and private-sector internal carbon pricing estimates speaks to the ability of the private sector to independently respond to both the politics and science of climate change. If internal SC-CO2 models provide the best dollar-value estimates of emissions available, the proximity of SC-CO2 estimates and internal carbon prices suggests that internal carbon pricing methods may also be useful in producing unitprice estimates of carbon emissions.
Figure 5. Distribution of Internal Prices on Carbon
Conclusion
In the 2018 State and Trends of Carbon Pricing report published by the World Bank, the topic of internal carbon pricing moved from a small subsection of the second chapter to the entire final chapter of the report. In that final chapter, the report states that “there is increasing pressure from stakeholders to better understand how companies are using internal carbon pricing” and that “financial institutions are not only paying more attention to the internal carbon pricing approach of companies that they invest in, but they are also increasingly using internal carbon pricing in their own decision-making” (World Bank and Ecofys 2018).
Needless to say, there is a pressing need to understand the precise motives, methods and prices used by the private sector for internally pricing carbon. This research quantifies how a self-identified sample of U.S. companies that report using internal carbon pricing strategies align with various CO2 mitigation motives and pricing methods. The most common motives for internally pricing carbon are investor relations and increased efficiency, followed by regulation and competitive advantage. By far the most common method for internally pricing carbon is shadow pricing, which is to be expected since it creates no direct costs to the company; however, there are a significant number of companies in our sample that utilize a carbon offset approach as well. Finally, the average internal carbon price reported by companies in our sample is $40.90, remarkably close to Obama-era SC-CO2 estimates of approximately $37 at a standard three percent discount rate in 2016.
Placing this research in the context of current trends—such as articulated consumer preference for greenoriented businesses and U.S. government failure to advance regulation of carbon emissions—creates a telling picture of private-sector carbon emission strategy in the United States. As the number of companies internally pricing carbon and reporting to the CDP increases, further research will be able to identify additional important trends in the private sector regarding the relationships between industry, location, and combinations of methods and motives, alongside the popularity of motives, methods and prices for internally pricing carbon. Even so, a number of compelling trends are identified, especially regarding the similarity of average internal carbon prices and SC-CO2 estimates, and the large number of companies that are motivated to price carbon due to the perception of real costs associated with carbon emissions. These findings suggest that the private sector may be capable of independently reducing their carbon emissions in response to natural market factors that are responding directly to the claims of climate science rather than solely as a result of direct regulation. As climate science progresses, as the regulatory environment evolves, and as private-sector business strategy continues to adapt, the motives, methods, and prices of private sector carbon pricing are likely to remain dynamic indicators of privatesector adaptability to market and regulatory risk.