
Introduction
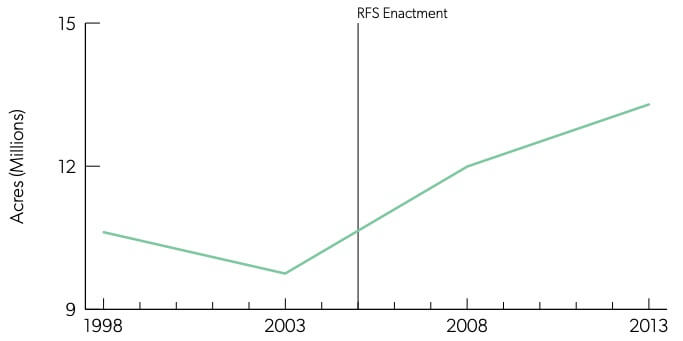
The Renewable Fuel Standard (RFS), created by the Energy Policy Act of 2005 and significantly expanded under the Energy Independence and Security Act of 2007 (EISA), requires US fuel blenders to mix ethanol into gasoline and other transportation fuels. The mandate is set as a volume requirement that does not adjust according to actual gasoline sales in a given year. The annual mandate increases through the year 2022 and tops out at 36 billion gallons.1Landon Stevens, Randy T Simmons, and Ryan M. Yonk, Ethanol and the Renewable Fuel Standard (Logan, UT: Institute of Political Economy, 2016): 6. While the RFS is not the only government policy favoring corn ethanol production, it is the most significant. Other policies are detailed in Stevens, Simmons, and Yonk, 10-11. While the Volumetric Ethanol Excise Tax Credit may have exceeded the RFS in importance to the corn ethanol industry during its time, it expired in 2011. Note that the portion of this mandate that can be satisfied with corn ethanol is capped at 15 billion gallons. As shown in figure 1, the RFS attempts a ten-fold increase in ethanol production from 2004’s 3.4 billion gallons in a time span of less than two decades.2 See citations provided in the footnote for Figure 1. From 2004 to 2016, domestic corn production grew by 3.3 billion bushels, or about 28%. While the RFS has not been the only driver of that precipitous increase in output, the rise in ethanol’s corn consumption from 1.3 to 5.4 billion bushels dwarfed the increase in every other use of corn over the same period.3Exports rose by 474.82 million bushels and feed and residual use dropped by 659.181 million bushels. Note that total production and ethanol use changes were reported in billions of bushels, numbers in this footnote are reported in millions of bushels. The most recent hard data (i.e. not based on projections) available is from 2016. Both measurements come from the US Department of Agriculture, Economic Research Service, “Feed Grains Database,” http://www.ers.usda.gov/data-products/feed-grains-database/
Figure 1: Real Ethanol Production pre-2005 vs. Renewable Fuel Standard Mandate
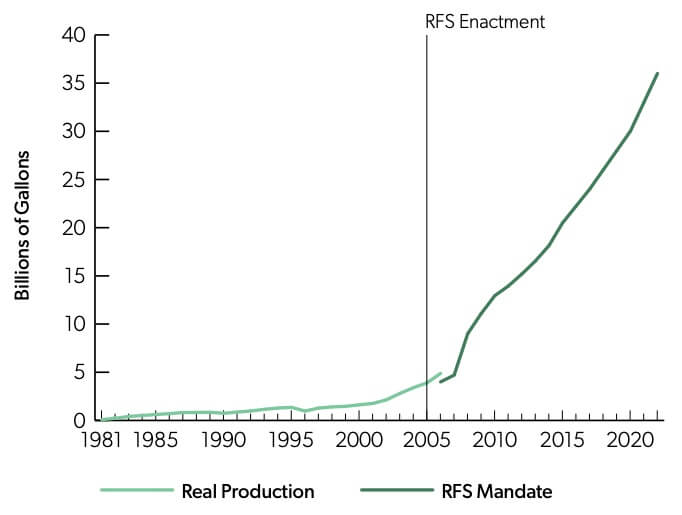
Source: US Department of Energy, Alternative Fuels Data Center, “U.S. Production, Consumption, and Trade of Ethanol,” https://www.afdc.energy.gov/data/10323; Randy Schnepf and Brent D. Yacobucci, “Renewable Fuel Standard (RFS): Overview and Issues” (CRS Report No. R40155, Congressional Research Service, Washington, DC, 2013): 3. Note: The RFS includes a small amount of biodiesel mandates in addition to ethanol. Data on historic production comes from the Department of Energy and data on mandate volumes comes from the Congressional Research Service, both cited above.
The Renewable Fuel Standard does not account for all the demand for ethanol. While the RFS escalated corn ethanol production dramatically, ethanol’s octane-enhancing qualities make it intrinsically useful as an additive to prevent engine knock, which can damage engine components.4 Soren T. Anderson and Andrew Elzinga, “A Ban on One Is a Boon for the Other: Strict Gasoline Content Rules and Implicit Ethanol Blending Mandates,” Journal of Environmental Economics and Management 67, no. 3 (2014): 260. Methyl tertiary butyl ether (MTBE), previously ethanol’s main fuel-octane-enhancement competitor, was eliminated from the US gasoline supply in 2006 owing to concerns about groundwater contamination, leaving ethanol with industry dominance.5Brent D. Yacobucci, “Alternative Fuels and Advanced Technology Vehicles: Issues in Congress” (Congressional Issue Brief for Congress No. 10128, Congressional Research Service, Washington, DC, 2008): 5; US Department of Energy, Alternative Fuels Data Center, “U.S. Consumption of Ethanol and MTBE Oxygenates,” https://www.afdc.energy.gov/data/10322. Federal and local governments also supplied the ethanol industry with various other supports, including trade restrictions, production subsidies, and financial assistance for distributional infrastructure buildout.6 Taxpayers for Common Sense, “Federal Subsidies for Corn Ethanol and Other Corn-Based Biofuels” (2017), https://www.taxpayer.net/energy-natural-resources/federal-subsidies-corn-ethanol-corn-based-biofuels/
While this report will focus exclusively on the environmental consequences of the RFS, different critics have written at length about other ethical and economic concerns.7For a review of food-versus-fuel scholarship, see Mark W. Rosegrant and Siwa Msangi, “Consensus and Contention in the Food-versusFuel Debate,” Annual Review of Environment and Resources 39 (October 2014): 271-94; for information on the impact of the RFS on rural communities, see Sean Gillon, “Fields of Dreams: Negotiating an Ethanol Agenda in the Midwest United States,” Journal of Peasant Studies 37, no. 4 (2010): 723-48. This report will similarly set aside many of the arguments of RFS proponents such as the Renewable Fuels Association, which tend to focus on energy independence and the economic importance of a strong corn market for small Midwestern communities. Moreover, while the RFS mandates the use of ethanol from advanced and cellulosic (i.e., non-corn) sources, this report focuses solely on corn ethanol. Each of these topics are worthy of further discussion but fall outside the scope of this report.
This review concludes that the RFS does considerable damage to the environment. It instigates land conversion to cropland and contributes to unsustainable land management practices. It requires the consumption of vast quantities of water and fertilizer in areas prone to drought and water quality issues. Finally, it delivers little or no net energy and does not significantly reduce carbon emissions. These results do not preclude any role for ethanol in the US energy mix, but they do suggest that any case for mandating ethanol use should not rely on arguments about its environmental benefits.
Changes in Land Use
Meeting the new demands of biorefineries under the RFS necessitated a drastic jump in corn production. To take advantage of the new market, farms expanded and attempted to squeeze more bushels out of each acre. Those expansions hurt already-sensitive habitats and released carbon being stored in soil. Intensified production interrupted many sustainable farming practices, with crop rotations and anti-erosive land management being among the sustainability measures cast aside. This section enumerates the land use changes associated with the RFS and their consequences for wildlife, greenhouse gas emissions, and erosion.
The RFS Drives Ecologically Detrimental Land Use Change
Driven substantially by ethanol policy, high corn demand since the passage of the RFS has pushed corn farming operations into previously unfarmed and fallow lands, rangelands, wetlands, and fields historically planted with other crops.8 Christopher K. Wright, “Recent Land Use Change in the Western Corn Belt Threatens Grasslands and Wetlands,” Proceedings of the National Academy of Sciences 110, no. 10 (March 2013): 4135-37; Tyler J. Lark, J. Meghan Salmon, and Holly K. Gibbs, “Cropland Expansion Outpaces Agricultural and Biofuel Policies in the United States,” Environmental Research Letters 10, no. 4 (2015): 3-8. Rates of land conversion throughout the Corn Belt are comparable to the rates of deforestation that plagued Brazil, Malaysia, and Indonesia during the 1980s and 1990s.9Wright, “Recent Land Use Change,” 4138. Of all grassland converted to other uses from 2010 to 2012 in the prairie pothole region (a threatened landscape), nearly 65% went to corn and soybean farming.10These landscapes are critical to the reproduction of American ducks. See Neal D. Niemuth, Kathleen K. Fleming, and Ronald E. Reynolds, “Waterfowl Conservation in the US Prairie Pothole Region: Confronting the Complexities of Climate Change,” PLoS One 9, no. 6 (2014): 1-2, 6; Ritvik Sahajpal et al., “Identifying Representative Crop Rotation Patterns and Grassland Loss in the US Western Corn Belt,” Computers and Electronics in Agriculture 108 (2014): 179. A University of Michigan report found that declines in both species diversity and species abundance of grassland birds in the prairie pothole region are attributable to habitat degradation caused by ethanol policies.11 Rebecca Brooke et al., Corn Ethanol and Wildlife: How Increases in Corn Plantings are Affecting Habitat and Wildlife in the Prairie Pothole Region (Washington, DC: National Wildlife Federation, 2009): 1, 11-12. Long-term unimproved grasslands, including prairie and range, constitute 22% of new corn acreage; this is particularly problematic because the soil in those regions stores large quantities of carbon that are released to the atmosphere when farmed.12Lark, Salmon, and Gibbs, “Cropland Expansion,” 5. Figure 2 shows the full breakdown of where new cropland was sown between 2008 and 2012.
The RFS technically requires that ethanol feedstocks come from land that was already being used in December 2007, but insufficient monitoring leaves that rule totally unenforced.13Lark, Salmon, and Gibbs, “Cropland Expansion,” 9. One rough calculation estimated that fueling an average US automobile entirely with ethanol for a year would take a hectare (roughly 2.5 acres) of corn. By contrast, feeding an average person for the same period of time takes only half a hectare.14 David Pimentel, Tad Patzek, and Gerald Cecil, “Ethanol Production: Energy, Economic, and Environmental Losses,” Reviews of Environmental Contamination and Toxicology 189 (2007): 31-32. The RFS cannot be blamed for all documented land conversion, but the extent of conversion is correlated with proximity to ethanol plants, suggesting that the RFS is a key factor.15 J. Christopher Brown et al., “Ethanol Plant Location and Intensification vs. Extensification of Corn Cropping in Kansas,” Applied Geography 53 (2014): 145.
Figure 2: Previous Use of New Cropland, 2008-2012
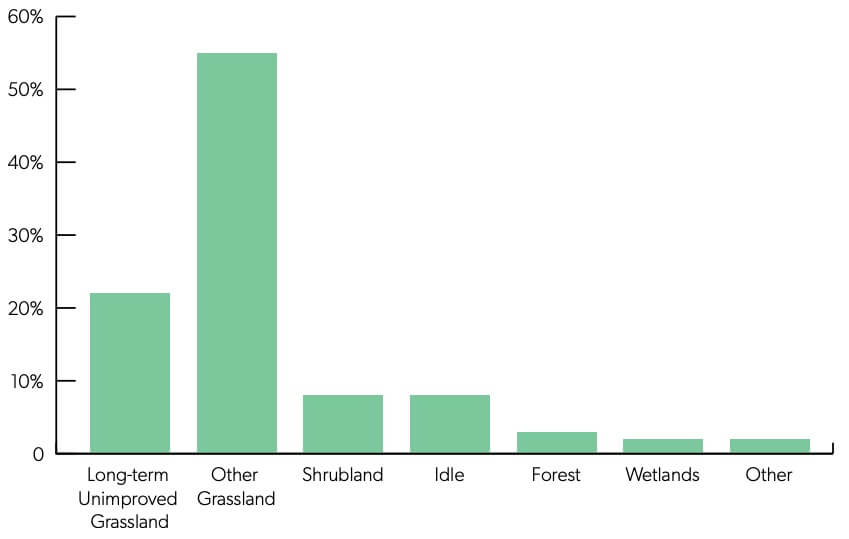
Source: Lark, Salmon, and Gibbs, “Cropland Expansion,” 5. Note: The figure includes all new cropland, not just that attributable to corn. Corn is, however, the predominant contributor.
The trouble with converting landscapes to cropland goes beyond habitat conservation. Soil acts as a major storehouse of carbon and holds significantly more carbon than the atmosphere.16 Zhangcai Qin et al., “Soil Carbon Sequestration and Land Use Change Associated with Biofuel Production: Empirical Evidence,” GCB Bioenergy 8, no. 1 (2016): 66. Turning over wild soil to prepare a corn farm releases large amounts of carbon; over ten years, forest-converted farmland can release 36 percent of the soil’s carbon.17 J.-F. Soussana et al., “Carbon Cycling and Sequestration Opportunities in Temperate Grasslands,” Soil Use and Management 20, no. 2 (2004): 223; Qin et al., “Soil Carbon Sequestration,” 70.
Land conversion for corn planting also acts in direct competition to the Conservation Reserve Program (CRP), a federal program that offers financial incentives to farmers to leave marginal lands unharvested and instead plant species that bolster environmental quality. Tracts of land enrolled in the CRP typically are at high risk of erosion or are otherwise environmentally sensitive. Given that summer drought risk is increasing across much of the Corn Belt, grassland conversion “introduces the potential for catastrophic soil erosion.”18Christopher K. Wright, “US Agricultural Policy, Land Use Change, and Biofuels: Are We Driving Our Way to the Next Dust Bowl?,” Environmental Research Letters 10, no. 5 (2015): 2; Sharmistha Swain and Katharine Hayhoe, “CMIP5 Projected Changes in Spring and Summer Drought and Wet Conditions Over North America,” Climate Dynamics 44, no. 9-10 (2015): 2746-49. In addition to preventing erosion, the CRP preserves grassland habitats and the diversity of species that rely on them. According to the Congressional Research Service, the CRP prevents 325 million tons of soil erosion each year, protects two million acres of wetlands, sequesters 52 million metric tons of carbon dioxide annually, reduces nitrogen and phosphorus use by hundreds of millions of tons, and provides enough habitat to produce 13.5 million pheasants and 2.2 million ducks each year.19 Megan Stubbs, “Conservation Reserve Program (CRP): Status and Issues” (CRS Report No. R42783, Congressional Research Service, Washington DC, 2014): 14.
The RFS counteracts the CRP’s efforts to remove environmentally sensitive land from farming. When corn prices increase following demand growth, as they have under the Renewable Fuel Standard, farmers pull land out of the CRP.20 Silvia Secchi et al., “Corn-Based Ethanol Production and Environmental Quality: A Case of Iowa and the Conservation Reserve Program,” Environmental Management 44, no. 4 (2009): 738-39. Between 2007, the year of the Energy Independence and Security Act’s passage, and 2013, 44 percent of the land under expiring CRP contracts did not re-enroll.21 Chad Hellwinckel et al., “Simulated Impact of the Renewable Fuels Standard on US Conservation Reserve Program Enrollment and Conversion,” GCB Bioenergy 8, no. 1 (2016): 247. The Renewable Fuel Standard is still projected to eliminate 3 percent of remaining CRP land.22Hellwinckel et al., 255. Figure 3 shows year-toyear changes in statewide CRP enrollment, with all Corn Belt states showing a loss of CRP acreage after the RFS’s 2007 expansion.
Figure 3: Yearly Changes in Statewide Enrollment of Conservation Reserve Program Acreage
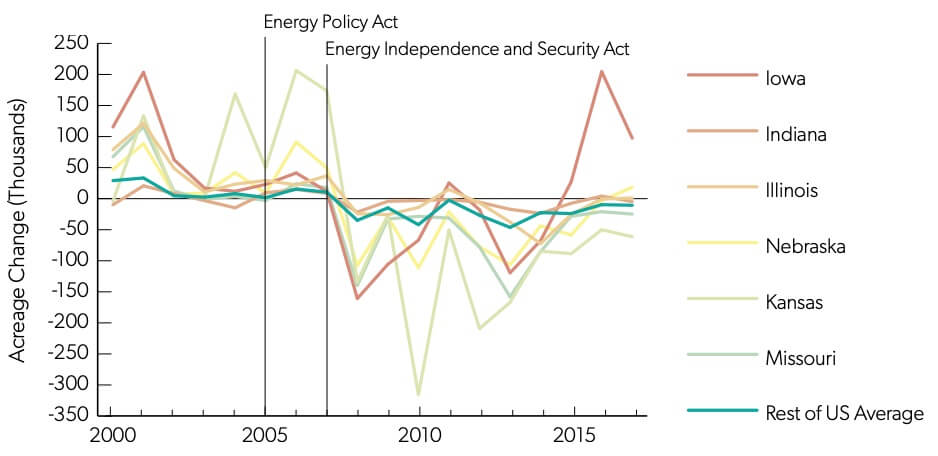
Source: US Department of Agriculture, Farm Service Agency, “CRP Enrollment and Rental Payments by State, 1986-2017,” https://www.fsa.usda.gov/programs-and-services/conservation-programs/reports-and-statistics/conservation-reserve-program-statistics/index.
The RFS also induces indirect land use change, which includes any land conversion other than new feedstock farms. For example, if farmers in the United States respond to the RFS by growing more corn and fewer soybeans, farmers abroad may step in to fill the gap by increasing soybean production and deforestation along with it.23While conversion in the United States is predominantly from grassland to corn, foreign land use change is more likely to involve destruction of natural forests. See Qudsia J. Ejaz et al., Are Land-Use Emissions Scalable with Increasing Corn Ethanol Mandates in the United States?, (Report No. 265, MIT Joint Program on the Science and Policy of Global Change, Cambridge, MA, April 2016): 14-17.
While varied and sensitive to differing assumptions, models generally agree that corn ethanol is responsible for millions of acres of international land use change and significant carbon emissions associated with that change.24 See Jerome Dumortier et al., “Sensitivity of Carbon Emission Estimates from Indirect Land-Use Change,” Applied Economic Perspectives and Policy 33, no. 3 (2011): 442-44; Amber Broch, S. Kent Hoekman, and Stefan Unnasch, “A Review of Variability in Indirect Land Use Change Assessment and Modeling in Biofuel Policy,” Environmental Science and Policy 29 (May 2013): 152, 155. Strong empirical links between the RFS and indirect land use change have yet to be established, but empirical work on Brazil’s domestic ethanol expansion has shown a significant long-term deforestation response.25Saraly Andrade de Sá, Charles Palmer, and Salvatore di Falco, “Dynamics of Indirect Land-Use Change: Empirical Evidence from Brazil,” Journal of Environmental Economics and Management 65, no. 3 (2013): 386-87.
The RFS Encourages Unsustainable Land Management Practices
The Renewable Fuel Standard’s effects on land use go beyond land conversion. New corn demand has driven owners of farmland already dedicated to corn production to begin using even more intensive farming techniques that reduce soil quality. Typically, soil nutrients are replenished by rotating fields every year between corn, which depletes soil nitrogen, and soybeans, which reintroduce nitrogen. Reducing the frequency of or even eliminating annual soybean crop rotations diminishes soil quality and necessitates the use of more nitrogen fertilizer, an issue discussed further in the Resource Use section of this report.
Before 2007, the year the EISA passed, the ratio of corn acreage to soybean acreage in the central United States was nearly 1:1. Afterwards, this ratio rose quickly, starting in 2007 when corn acreage outpaced soybean acreage by 40 percent. The ratio of corn to soybean acreage is shown in Figure 4 for Corn Belt states. Over the 2007-2010 period, 8 percent of all corn production occurred on land that has been growing corn for at least four consecutive years—far removed from the ideal biannual rotation schedule.26 However, the ratio of corn to soybean acreage has returned closer to 1:1 in recent years. One possible explanation could be that more intensive farming practices were only used until production could expand onto new land, at which point farms returned to appropriate rotations. This explanation is speculative and deserving of further investigation, but it is clear that unsustainable production continues, though manifested in alternative forms.
Figure 4: Corn-to-Soybean Planted Acreage Ratios for the Corn Belt
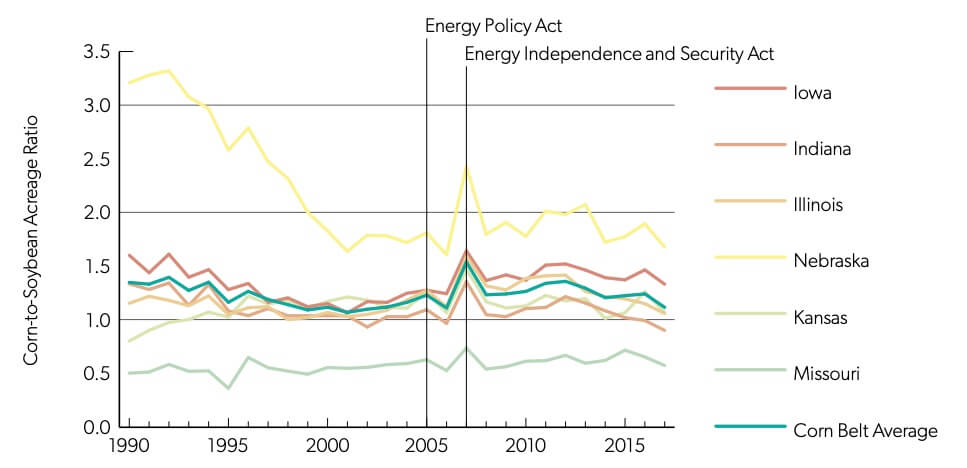
Source: US Department of Agriculture, National Agricultural Statistics Service, “Quick Stats Database,” https://quickstats.nass.usda.gov/.
Note: The plot shows the ratio of planted corn acreage to planted soybean acreage, calculated from crop-level acreage data.
The Renewable Fuel Standard is part of a broader portfolio of federal incentives that drive corn farmers to maximize production at the cost of soil erosion. Federal farm policy in the late 1980s and early 1990s subsidized both production and erosion prevention, which led farmers to implement technologies like grass strips that filter and slow the flow of runoff.26Craig Cox, Andrew Hug, and Nils Bruzelius, Losing Ground (Washington, DC: Environmental Working Group, 2011): 5. Since then, federal enforcement of erosion prevention waned, but massive production incentives, including the RFS, continue to push up production.27Cox, Hug, and Bruzelius, 6.
The consequence, especially in Iowa, is unsustainable levels of soil erosion. In 2007, townships comprising ten million of Iowa’s thirty-six million acres eroded faster than the government-defined sustainable rate, and six million acres eroded at double that rate.28Cox, Hug, and Bruzelius, 4-5. Despite having some of the most productive cropland in the country, Iowa has lost half of its topsoil over the last 150 years. Researchers at the USDA’s Economic Research Service specifically mention large biofuel production mandates as a cause for increasing erosion in the Northern Plains and Mississippi Delta.29 Scott Malcolm and Marcel Aillery, “Growing Crops for Biofuels Has Spillover Effects,” Amber Waves 7, no. 1 (2009): 14. Although topsoil is semirenewable, re-accumulation can take decades following surface disturbances and thousands of years after complete depletion.30Christine V. Evans, Delvin S. Fanning, and John R. Short, “Human-Influenced Soils,” in Managing Soils in an Urban Environment, eds. Randall B. Brown, J. Herbert Huddleston, and James L. Anderson (Madison, WI: American Society of Agronomy, 2000): 33. Topsoil degradation necessitates the application of yet more fertilizer, damages soil ecosystems, and reduces the ground’s ability to absorb rainwater.31David Pimentel, “Soil Erosion: A Food and Environmental Threat,” Environment, Development and Sustainability 8, no. 1 (2006): 124-27. The problem is worst in areas of continuous corn planting; without crop rotation, soil erodes 15 times faster than it can replenish.32 David Pimentel, “Corn and Cellulosic Ethanol Problems and Soil Erosion,” in Soil Quality and Biofuel Production, eds. Rattan Lal and B. A. Stewart (Boca Raton, FL: CRC Press, 2010): 128-29. Schemes to produce cellulosic ethanol with leftover corn residues (i.e. stems, leaves, and cobs) would exacerbate this problem “from 10- to 100-fold.”33Pimentel, “Corn and Cellulosic Ethanol Problems,” 130.
Resource Use
Much like land, other corn inputs—namely nitrogen fertilizer and water—are now being used in greater amounts throughout the Midwest thanks to the RFS. Both of these resources are already linked to regional environmental problems like toxic algal blooms and drought, and corn ethanol only worsens those issues. After discussing water and fertilizer, this section examines corn ethanol in the context of energy systems analysis. Using the concept of “Energy Returned on Energy Invested,” or EROI, corn ethanol is demonstrated to be an inefficient resource unsuitable for meeting the energy needs of a developed economy.
Corn Belt Farms Apply Large Amounts of Nitrogen Fertilizer
Corn production in the Midwest often uses large amounts of fertilizer—more than is applied in growing other crops—and allows up to 60 percent of applied nitrogen fertilizer to escape in runoff or into the atmosphere.34Fertilizer is considered in terms of pounds per acre. US Department of Agriculture, Economic Research Service, “Fertilizer Use and Price,” 2018, https://www.ers.usda.gov/data-products/fertilizer-use-and-price.aspx; Pamela A. Porter, Robert B. Mitchell, and Kenneth J. Moore, “Reducing Hypoxia in the Gulf of Mexico: Reimagining a More Resilient Agricultural Landscape in the Mississippi River Watershed,” Journal of Soil and Water Conservation 70, no. 3 (2015): 63A-64A; Thomas W. Simpson et al., “The New Gold Rush: Fueling Ethanol Production while Protecting Water Quality,” Journal of Environmental Quality 37, no. 2 (2008): 320. Runoff fertilizer enters surface waters and causes excessive algae growth, which in turn can cause dangerous algal blooms. These blooms sap oxygen from the water and produce toxins, which kill underwater life and threaten human health.35Bryan W. Brooks et al., “Are Harmful Algal Blooms Becoming the Greatest Inland Water Quality Threat to Public Health and Aquatic Ecosystems?,” Environmental Toxicology and Chemistry 35, no. 1 (2016): 7-8. Studies of pollution throughout the Mississippi River Basin find that the Corn Belt region is disproportionately responsible for nitrogen runoff.36 Mark B. David, Laurie E. Drinkwater, and Gregory F. McIsaac, “Sources of Nitrate Yields in the Mississippi River Basin,” Journal of Environmental Quality 39, no. 5 (2010): 1664. Each additional billion gallons of ethanol production enlarges the size of the Gulf of Mexico “hypoxic zone,”—an area that is inhospitable to aquatic life during the summer due to lack of oxygen—by 32.7 square miles.37Nathan P. Hendricks et al., “The Environmental Effects of Crop Price Increases: Nitrogen Losses in the U.S. Corn Belt,” Journal of Environmental Economics and Management 68 (2014): 522-23. Nitrogen use in the Corn Belt is a long-term and continuing issue. Although it is not unique to the RFS, insofar as the RFS encourages more corn production on more land, it magnifies the problem. Scientists writing in the Proceedings of the National Academy of Sciences concluded that mandated levels of ethanol production will make reducing nitrogen pollution in the Mississippi River “practically impossible” without major, improbable changes to farming practices.38Simon D. Donner and Christopher J. Kucharik, “Corn-Based Ethanol Production Compromises Goal of Reducing Nitrogen Export by the Mississippi River,” Proceedings of the National Academy of Sciences 105, no. 11 (2008): 4517.
Fertilization also stimulates microorganisms that emit nitrous oxide, a potent and long-lasting greenhouse gas that is the world’s largest ongoing anthropogenic cause of ozone depletion.39R. W. Portman, J. S. Daniel, and A. R. Ravishankara, “Stratospheric Ozone Depletion Due to Nitrous Oxide: Influences of Other Gases,” Philosophical Transactions of the Royal Society B: Biological Sciences 367, no. 1593 (2012): 1257, 1262. Nitrogen fertilization is the dominant contributor to nitrous oxide’s 20 percent atmospheric increase since 1750.40 S. Park et al., “Trends and Seasonal Cycles in the Isotopic Composition of Nitrous Oxide since 1940,” Nature Geoscience 5, no. 4 (April 2012): 261, 264. Because of the incentives the RFS creates for fertilizer-intensive corn farming, the mandate elevates nitrous oxide emissions. According to an international group of scientists in the journal Atmospheric Chemistry and Physics, the amount of nitrous oxide emitted from corn ethanol production outweighs any carbon dioxide reduction corn ethanol may otherwise cause, even using an incredibly optimistic measurement of the biofuel’s climate benefits.41 P. J. Crutzen et al., “N2 O Release from Agro-Biofuel Production Negates Global Warming Reduction by Replacing Fossil Fuels,” Atmospheric Chemistry and Physics 8, no. 2 (2008): 390-93.
Ethanol Demands Large Quantities of Water in Dry Areas
Ethanol production uses water at numerous points along the supply chain, including during farming, processing, and transportation. The single largest factor determining ethanol’s water consumption is whether the feedstock farm irrigates its fields.42 Carey W. King and Michael E. Webber, “Water Intensity of Transportation,” Environmental Science and Technology 42, no. 21 (2008): 7869. Many corn farms across the United States, especially within the Corn Belt, farm corn without irrigation, instead relying on ample rainfall. But, as corn expands to marginal, less-suitable lands, the need for irrigation increases commensurately. In Iowa, where only 1 percent of corn is irrigated, it takes 5.5 gallons of water to produce a gallon of ethanol; half of this water is used during refining. Farms in neighboring but drier Nebraska irrigate 56 percent of their corn and consume an average of 427 gallons of water per gallon of ethanol—seventy-seven times the amount required in Iowa.43 Xiaowei Liu, S. Kent Hoekman, and Amber Broch, “Potential Water Requirements of Increased Ethanol Fuel in the USA,” Energy, Sustainability and Society 7, no. 18 (2017): 7-8. While total irrigated acreage across the United States declined between 2008 and 2013, irrigated corn acreage increased.44Corn data are calculated from irrigated acreage totals available at the National Agriculture Statistics Service, Farm and Ranch Irrigation Survey (2013) (Washington, DC: US Department of Agriculture, 2014): 159; data on total agricultural irrigated acreage is available in the same source, p. 7. Before that, water consumption for ethanol production had already risen 246 percent from 2005 to 2008.45 Yi-Wen Chiu, Brian Walseth, and Sangwon Suh, “Water Embodied in Bioethanol in the United States,” Environmental Science and Technology 43, no. 8 (2009): 2688. Figure 5 uses the Farm and Ranch Irrigation Survey, collected every five years, to illustrate changes in irrigated corn acreage.
Figure 5: Irrigated Acres of Corn Harvested for Grain and Seed
Source: National Agriculture Statistics Service, Farm and Ranch Irrigation Survey, 90.
As seen in figure 6, ethanol production consumes more water than gasoline does, regardless of whether corn fields are irrigated, though irrigated corn ethanol demands orders of magnitude more.46 This is also discussed in Nicole T. Carter, “Energy’s Water Demand: Trends, Vulnerabilities, and Management” (CRS Report No. R41507, Congressional Research Service, Washington, DC, 2010): 27-28; similar results are reported in Kenneth Mulder, Nathan Hagens, and Brendan Fisher, “Burning Water: A Comparative Analysis of the Energy Return on Water Invested,” AMBIO 39, no. 1 (2010): 35-36. Extensive water use is particularly troublesome in the Midwest, where many aquifers are already overdrawn. Irrigation is a major contributor to the unsustainable use of the Ogallala Aquifer, an important source of water for a large swath of the Midwest.47 Jerald L. Schnoor, Water Sustainability in a Changing World (Fountain Valley, CA: National Water Research Institute, 2010): 8-9. The RFS only exacerbates that problem by adding yet another incentive to use overtaxed water resources for irrigating corn fields. Even for areas that principally rely on rainfall, groundwater consumption at the biorefinery is “an incremental withdrawal from an already unsustainable resource.”48 Water Science and Technology Board, National Research Council, Water Implications of Biofuels Production in the United States (Washington, DC: National Academies Press, 2008): 49.
Figure 6: Average Amount of Water Consumed per Mile (Light Duty Vehicles, Gallons)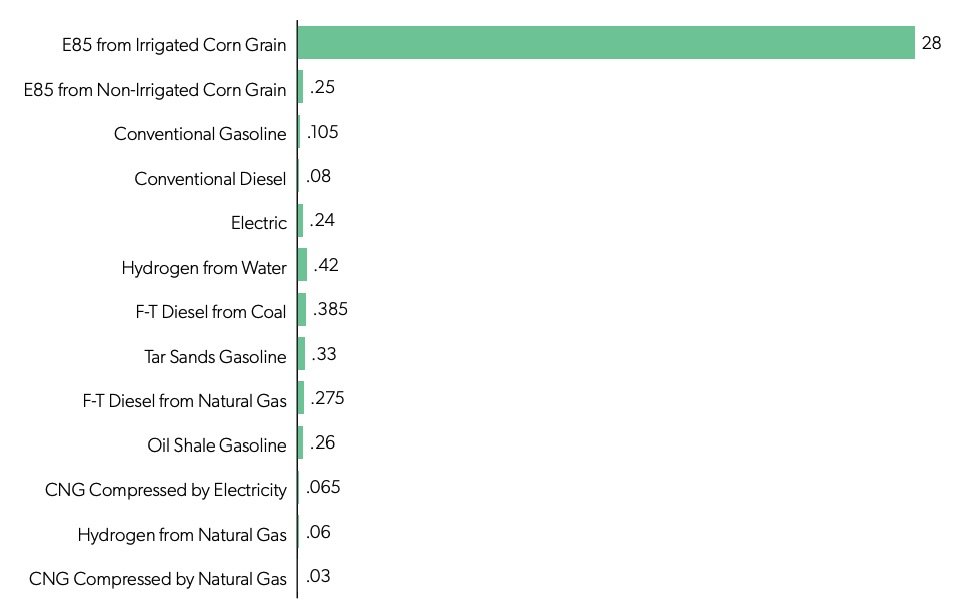 Source: King and Webber, “Water Intensity of Transportation,” 7867-69.
Net Energy Gain from Ethanol Production is Small at Best and Often Negative
To harness energy, whether from fossil fuels, from renewables, or from biofuels, some energy needs to be expended in extraction. The ratio of energy produced to energy consumed in resource extraction is known as EROI (short for “energy returned on energy invested”).49This equation, of course, uses “energy” to mean “electricity or other energy useful for human purposes” rather than using the definition from physics, so the law of conservation of energy does not apply. The system boundaries of EROI analysis are covered in David J. Murphy et al., “Order from Chaos: A Preliminary Protocol for Determining the EROI of Fuels,” Sustainability 3, no. 10 (2011): 1890-95. Further background on the history and applications of the EROI concept is available in David J. Murphy and Charles A. S. Hall, “Year in Review—EROI or Energy Return on (Energy) Invested,” Annals of the New York Academy of Sciences 1185, no. 1 (2010): 102-18. As an example, producing a barrel of crude oil requires energy to operate the drilling rig as well as energy investments to create the rig itself. The energy consumed during an extraction process, both directly and indirectly, can be thought of as an energy investment. The resulting barrel of oil should yield even more energy than was required to produce it—in other words, the oil product should have an EROI greater than 1:1, thereby making the investment worthwhile.
![\[\frac{\text { Energy Produced }}{\text { Energy Invested }}=E R O I\]](https://www.thecgo.org/wp-content/ql-cache/quicklatex.com-2a9947bf3cfebfd70cd2a047e2a76419_l3.svg "Rendered by QuickLaTeX.com")
An EROI greater than 1:1 means that net energy is created; you get more out of the system than you put in to it. While any number above 1:1 technically represents energy creation, EROIs close to 1:1 produce energy inefficiently—that is, the amount of energy investment is nearly equal to the energy return. Figure 7, which shows a chart commonly referred to as the “net energy cliff,” illustrates how as EROIs approach 1:1, the amount of energy that must be fed back into energy production increases rapidly. Even fuels with an EROI slightly above 1:1 generally fail to produce net energy over their lifetime because of the energy required for post-extraction distribution, transmission, and so on.
Figure 7: The Net Energy Cliff
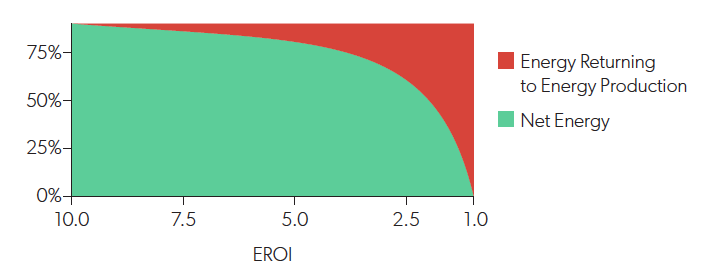
Note: EROI stands for Energy Returned on Energy Invested and is calculated as  .
.
Researchers estimate ethanol’s EROI to be somewhere between 0.87:1 and 1.27:1.50David J. Murphy, Charles A. S. Hall, and Bobby Powers, “New Perspectives on the Energy Return on (Energy) Investment (EROI) of Corn Ethanol,” Environment, Development and Sustainability 13, no. 1 (2011): 189. For a discussion on the source of variability in EROI estimates for corn ethanol, see Charles A. S. Hall, Bruce E. Dale, and David Pimentel, “Seeking to Understand the Reasons for Different Energy Returns on Investment (EROI) Estimates for Biofuels,” Sustainability 3, no. 10 (2011): 2413-20. Whether ethanol’s EROI is barely above or below 1:1 is a matter of heated academic debate, but even the highest EROI estimates for corn ethanol are not promising. Research on societal EROI (roughly, the EROI of the available energy mix for a country) finds that countries with high standards of living have EROIs of no less than 15:1.51Jessica G. Lambert et al., “Energy, EROI and Quality of Life,” Energy Policy 64 (2014): 164. Without this minimum level of energy productivity, societies would find it difficult to maintain the productive capacity conducive to higher standards of living.
All EROI estimates are approximate; the precise measure varies according to location, technologies used, and volume. Table 1 gives the range of estimates for various other fuel types across years and across countries as reported by EROI researchers in the journal Energy Policy.
Table 1: Ranges of Published EROI Estimates for Various Energy Types
Source: Charles A. S. Hall, Jessica G. Lambert, and Stephen B. Balogh, “EROI of Different Fuels and the Implications for Society,” Energy Policy 64 (2014): 145.
Note: EROI sta nds for Energy Returned on Energy Invested and is calculated as . Energy sources marked with an asterisk (*) have only one reported EROI estimate.
Furthermore, as ethanol continues to expand into less suitable land, its EROI is likely to decline; ethanol’s EROI is geographically dependent and at its highest when its feedstock is grown in fertile cropland in the core of the Corn Belt.52Murphy, Hall, and Powers, “New Perspectives,” 189. Figure 8, adapted from EROI experts David J. Murphy, Charles A. S. Hall, and Bobby Powers, shows EROI by county for every county that produced at least 1 percent of the U.S. corn harvest in 2005.
Figure 8: Estimated Corn Ethanol EROI, by County
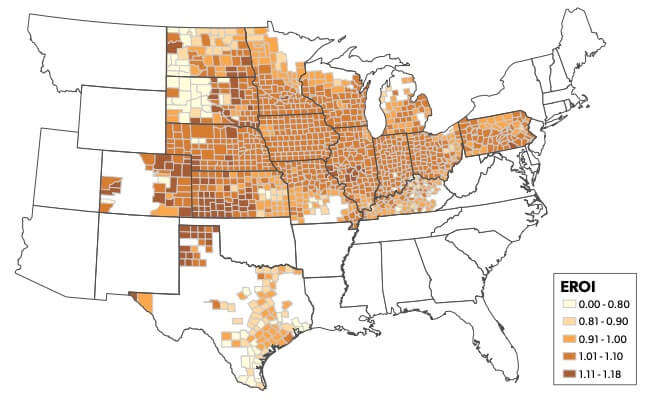 Source: Murphy, Hall, and Powers, “New Perspectives,” 189. Adapted with permission from Springer Nature.
All else equal, farmers naturally gravitate toward planting crops in optimal, fertile land first, moving to suboptimal lands only as first-choice areas become saturated. That dynamic, discussed in the Changes in Land Use section of this report, also affects EROI: as corn is planted in less and less suitable environments, corn ethanol’s average EROI is slated to decline.53 Murphy, Hall, and Powers, 182-83 For that reason alone, corn ethanol production cannot be scaled to provide significantly more of the United States’ transportation fuel.
Emissions
This third section discusses the chief environmental concern surrounding transportation fuels: emissions. Academic research on ethanol’s lifecycle greenhouse gas emissions is surprisingly unsettled but precludes any conclusion that ethanol is a drastic improvement over gasoline. After discussing ethanol’s disappointing greenhouse gas performance, this section briefly compares ethanol and gasoline’s contributions to other atmospheric pollutants.
The CO2 Emissions Reduction from Ethanol is Likely Small
RFS proponents originally held greenhouse gas (GHG) emissions reductions to be a key argument in support of the policy.54 For an early academic treatment, see Alexander E. Farrell et al., “Ethanol Can Contribute to Energy and Environmental Goals,” Science 311, no. 5760 ( January 2006): 56-58. Farrell et al.’s paper is critiqued directly in Mario Giampietro and Kozo Mayumi, The Biofuel Delusion: The Fallacy of Large-Scale Agro-Biofuel Production (London: Earthscan, 2009): 158-66. However, research published soon after the passage of the EISA undermined that argument, claiming that ethanol’s total carbon dioxide impact was nearly twice as large as that of normal gasoline.55 Timothy Searchinger et al., “Use of U.S. Croplands for Biofuels Increases Greenhouse Gases through Emissions from Land-Use Change,” Science 319, no. 5867 (February 2008): 1239. More recent analysis has tempered that conclusion, but the greenhouse gas output of ethanol production is still an unsettled question.
A vehicle burning one gallon of ethanol indisputably emits less carbon dioxide than the same vehicle burning one gallon of gasoline. That metric, however, is of little practical use, for two reasons. First, the energy content of ethanol and gasoline differ—unit for unit, ethanol will not power an engine as long as gasoline. Second, lifecycle emissions, which include production and processing in addition to use, differ among fuels. Measuring the lifecycle emissions of any fuel is exceedingly difficult, and measurements will vary substantially on the basis of what technologies are being employed, where the fuel is sourced, and other considerations. For these reasons, a wide variety of estimates exist for ethanol’s lifecycle emissions.
A meta-analysis considering a multitude of studies and datasets has estimated that ethanol delivers, on average, 0.19 kilograms of carbon dioxide savings per energy-equivalent liter relative to gasoline, with a 0.87 kilogram standard deviation.56Comparison is made with energy equivalent units because one liter of ethanol contains less energy than one liter of gasoline. Gal Hochman and David Zilberman, “Corn Ethanol and US Biofuel Policy Ten Years Later: A Systematic Review and Meta-analysis” (paper for presentation at the Annual Meeting of the Agricultural and Applied Economics Association, Boston, MA, July 31-August 2, 2016): 10-11. Burning a liter of gasoline releases 2.31 kg of carbon dioxide, so even if ethanol does provide any emissions benefit, it is relatively small, with a 10 percent ethanol mixture still producing 99.2 percent as much as plain gasoline according to the meta-analysis estimate. 57T. W. Davies, “Calculation of CO2 Emissions from Fuels,” http://people.exeter.ac.uk/TWDavies/energy_conversion/Calculation%20of%20CO2%20emissions%20from%20fuels.htm; [0.9*2.31+0.1(2.31-0.19)]/2.31=0.99177. Furthermore, net greenhouse gas emissions are expected to grow alongside ethanol volume mandates owing to land use change, both direct and indirect.58Ejaz et al., Are Land-use Emissions Scalable?, 14-17
Ethanol production also emits nitrous oxide, an even more potent greenhouse gas, as was discussed in the section on fertilization.
Ethanol Contributes to Harmful Atmospheric Ozone Emissions
Emissions from ethanol use also contain more ozone precursors than emissions from gasoline and will add significantly to atmospheric ozone concentrations if ethanol use continues to increase.59Mark Z. Jacobson, “Effects of Ethanol (E85) versus Gasoline Vehicles on Cancer and Mortality in the United States,” Environmental Science and Technology 41, no. 11 (2007): 4151; Jia Long, Xu YongFu, and Shi YuZhen, “Investigation of the Ozone Formation Potential for Ethanol Using a Smog Chamber,” Chinese Science Bulletin 57, no. 34 (December 2012): 4479-81. While stratospheric ozone is beneficial, ozone near the ground is environmentally detrimental and is responsible for respiratory illnesses.60US Environmental Protection Agency, “Health Effects of Ozone Pollution,” https://www.epa.gov/ozone-pollution/health-effects-ozonepollution. Because of ozone’s adverse health effects, Stanford air pollution researcher Mark Z. Jacobson projects that greater use of E85 (a blend of fuel with higher ethanol content for use in flex-fuel vehicles) through 2020 will increase ozone-related mortality by 4 percent in the United States relative to 2000 levels, not to mention additional respiratory-related hospitalizations.61Jacobson, “Effects of Ethanol (E85) versus Gasoline,” 4154. Ozone emissions are an important consideration for human health but tend to be overlooked due to the focus on ethanol’s greenhouse gas effects.
A Future for Ethanol
As this report makes clear, ethanol is currently being produced at levels detrimental to the environment. Though some of ethanol’s damaging effects are unavoidable at any level of production, many only become problems at high volumes. Environmental issues arising from irrigation, fertilization, and land use change would most likely disproportionately shrink if ethanol volumes dropped.
For the first few billion gallons produced, when corn is farmed in optimal locales, properly rotated with soybeans, and not irrigated, ethanol makes good sense as a fuel additive. At higher levels of production, the calculus begins to shift. Corn production moves onto less suitable land and reverses ethanol’s greenhouse-gas-reduction benefits in the process, sometimes to below zero. Economists call this phenomenon “diminishing marginal returns.” This point is made in a new working paper published by the Norwegian Institute of Business Economics, which finds that, although the average greenhouse gas emissions for corn ethanol are lower than for gasoline, ethanol’s marginal emissions are actually higher, even without considering land use change.62 Translated from Norwegian Institutt for Foretaksøkonomi: Xueqin Zhu et al., How to Measure Greenhouse Gas Emissions by Fuel Type for Binary Sustainability Standards: Average or Marginal Emissions? An Example of Fertilizer Use and Corn Ethanol (Working Paper FOR 03 2017, Institutt for Foretaksøkonomi, Bergen, Norway, 2017), 22.
Without the RFS, ethanol production would not fall back to pre-2005 levels. After the revelation that MTBE was leaking from underground storage containers and the consequent disappearance of MTBE as the primary fuel oxygenate in the United States, fuel blenders nationwide turned to ethanol. As figure 9 illustrates, ethanol consumption soared far beyond what we would expect if the rise were explained solely by the replacement of MTBE, but even a full repeal of the RFS would leave ethanol well above its pre-2005 consumption levels.63 For further analysis on the market viability of ethanol without the mandate, see Bruce A. Babcock, “Ethanol Without Subsidies: An Oxymoron or the New Reality?,” American Journal of Agricultural Economics 95, no. 5 (2013): 1317-24. In some sense, MTBE bans act as yet another subsidy for corn ethanol.64 Anderson and Elzinga, “A Ban on One Is a Boon for the Other.” Production resulting from undistorted market demand would be better suited to serving the environment than the current mandate.
Figure 9: US Consumption of MTBE and Ethanol Oxygenates, 1990-2014
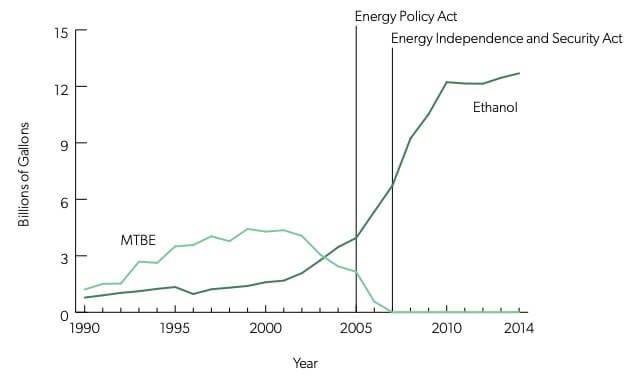
Source: Alternative Fuels Data Center, “U.S. Consumption of Ethanol and MTBE Oxygenates.”
Conclusion
Corn ethanol production prompted by the Renewable Fuel Standard harms the environment in myriad ways. Previously unfarmed lands enter intensive corn production and beneficial crop rotations are dropped in favor of continuous corn production. Important topsoil supplies are carried away by rainfall owing to poor anti-erosion practices. Ethanol’s already meager greenhouse gas benefits are offset by larger emissions elsewhere in the product’s lifecycle. Intensive corn farming eats up fertilizer and water, harming at-risk Midwestern environments and populations. To top it all off, the technology barely produces any net energy and, in some areas, even destroys energy on balance. In general, this report finds the environmental benefits of the RFS mandate to be lacking and its environmental consequences to be widespread.
Many of ethanol’s worst environmental problems stem from the artificially high demand driven by the RFS mandate. Despite the current mandate’s environmental problems, corn ethanol still plays an important role in the US energy mix, particularly as an octane enhancer. An unmandated market for ethanol would be more sustainable, producing enough ethanol to boost octane in the nation’s fuel supply without pushing corn cultivation into the Corn Belt’s periphery and disrupting the environment.