

Introduction
Economists agree that putting a price on carbon is an effective and economically efficient way to reduce the CO2 emissions that contribute to global climate change. Politically, however, carbon pricing is challenging because it explicitly raises consumer prices for things like gasoline and electricity.
This paper explores a modest but not insignificant opportunity to put a price on carbon that doesn’t raise consumer prices. As such it may be particularly appealing in conservative states such as Georgia and Nebraska. This opportunity arises in one key sector of the economy: the electricity sector—both in these states and in other jurisdictions that currently impose sales or other taxes on electricity.
The presence of these existing taxes—in 18 US states, some US municipalities, and many other countries—opens the door for two related policy ideas that give utilities an incentive to reduce carbon emissions while cushioning or eliminating the price impact on consumers:
- A Climate Action Tax Swap eliminates the existing tax on electricity and replaces it with a carbon tax on electricity.
- A Climate Action Tax Cut reduces the existing tax on electricity in line with reductions in the carbon intensity of that electricity.
In the short run, these policies are close to revenue-neutral, both in aggregate and for individual consumers. In the long run, they help to sunset regressive taxes on electricity and, simultaneously, electricity-sector carbon emissions. The long-run revenue impact is modest in comparison to both the impact of tax exemptions for other “necessities,” such as grocery store food, and the likely increase in tax revenues over time resulting from natural economic growth.
This paper provides an overview of the economics and political economy of climate change and then explores why our approach is suited for the electricity sector in particular. We describe the two policy options and explain why they are closely related to each other, even though at first glance a carbon tax sounds quite different from a sales tax cut. Case studies focus on Georgia and Nebraska, but we also summarize existing taxes on electricity in all 50 states as well as in key municipalities and internationally.
The Economics of Climate Change
Atmospheric concentrations of carbon dioxide (CO2) have been rising because of human activity, primarily the burning of fossil fuels.1NOAA US Department of Commerce, “Global Monitoring Laboratory – Carbon Cycle Greenhouse Gases,” https://gml.noaa.gov/ccgg/trends/; see also Climate Change 2021 – The Physical Science Basis, Intergovernmental Panel on Climate Change, 2021, https://www.ipcc.ch/report/ar6/wg1/downloads/faqs/IPCC_AR6_WGI_FAQs.pdf. Global average temperatures have also been rising, and the latest report from the Intergovernmental Panel on Climate Change concludes that “evidence is overwhelming that the climate has indeed changed since the pre-industrial era and that human activities are the principal cause of that change.”2Climate Change 2021 – The Physical Science Basis; see also “Climate at a Glance.” National Centers for Environmental Information (NCEI), https://www.ncdc.noaa.gov/cag/global/time-series. Potential risks include sea level rise, extreme weather events such as floods and droughts, and ocean acidification.
Economic analyses of climate change, including the Nobel prize winning work of Yale professor William Nordhaus, focus on the presence of an externality: The climate impacts associated with an activity that involves burning fossil fuels—such as driving, flying, or turning on the lights—are mostly borne by society as a whole and not by the individual engaging in the activity. This undermines the incentives that normally produce economically efficient outcomes—Adam Smith’s famous “invisible hand”—and the result is market failure.
Given this analysis of the problem, the obvious solution is to internalize the externality: to use market instruments to correct market failure by putting a price on carbon with a carbon tax or other price mechanism that acts as a surrogate for the missing market signal. A price on carbon that is set at the correct rate—the much-debated social cost of carbon—will correct the market failure by incentivizing individuals to act as if they were paying for the external costs of their actions.
In short, economists argue that a laissez faire free market approach will result in too much pollution and the way to get less pollution is to make polluting more expensive.
The Political Economy of Climate Change
Making polluting expensive, however, is not as easy in real life as it is in an economics textbook. That’s because every $10 per metric ton carbon tax increment raises the price of motor gasoline by about 10 cents per gallon, the price of natural gas by about five cents per therm, and the price of coal-fired electricity by about one cent per kilowatt hour.3 Marc Hafstead and Paul Picciano, “Calculating Various Fuel Prices under a Carbon Tax,” Resources for the Future, November 28, 2017, https://www.resources.org/common-resources/calculating-various-fuel-prices-under-a-carbon-tax/.
This poses a political challenge because voters and their elected representatives are sensitive to these prices. This is especially true in conservative states, where voters may be more sensitive to tax hikes. In these states, many elected officials have made anti-tax promises including signing the Americans for Tax Reform’s Taxpayer Protection Pledge, a pledge which requires politicians to vote against or veto any net tax increase.4“About the Pledge,” Americans for Tax Reform, https://www.atr.org/about-the-pledge/.
A related political challenge, one that is a policy challenge as well, is about regressivity. The Consumer Expenditure Survey shows that annual household expenditures on electricity, the focus of our proposal, average about $1,500, or almost 2% of household income.5“Consumer Expenditure Surveys,” Table 1203, US Bureau of Labor Statistics, https://www.bls.gov/cex/tables/calendar-year/mean-item-share-average-standard-error/cu-income-before-taxes-2020.pdf. This expenditure share is greater for lower-income households than for higher-income households, meaning that taxes on residential electricity are regressive.
In fact, figure 1 shows that taxes on residential electricity are even more regressive per dollar than taxes on grocery store food. (Figure 1 shows the impact by income quintile of a hypothetical revenue-neutral tax shift that—for an average household—replaces $100 in taxes on electricity with $100 in taxes on grocery store food. Because the shift is revenue-neutral, the columns sum to zero.)
The comparison is instructive because of the political treatment of groceries: Most US states with sales taxes exempt groceries,6Eric Figueroa and Julian Legendre, “States That Still Impose Sales Taxes on Groceries Should Consider Reducing or Eliminating Them,” Center on Budget and Policy Priorities, April 1, 2020, https://www.cbpp.org/research/state-budget-and-tax/states-that-still-impose-sales-taxes-on-groceries-should-consider. and a recent effort in Utah to raise the sales tax rate on groceries was repealed after encountering bipartisan opposition.7Benjamin Wood, “Utah Legislature Repeals Tax Reform in Pair of Overwhelming Votes,” The Salt Lake Tribune, January 28, 2020, https://www.sltrib.com/news/politics/2020/01/28/tax-referendum-hits/; see also Benjamin Wood, “Utah’s Gubernatorial Candidates Oppose Raising the Grocery Tax,” The Salt Lake Tribune, December 11, 2019, https://www.sltrib.com/news/politics/2019/12/11/utahs-gubernatorial/. Similar opposition is likely to await climate proposals that raise the price of gasoline or electricity.
Figure 1. Sales Taxes on Electricity are Even More Regressive Than Sales Taxes on Groceries
Savings by income quintile for a revenue-neutral sales tax shift that decreases electricity taxes and increases grocery store food taxes, each by $100 for an average household
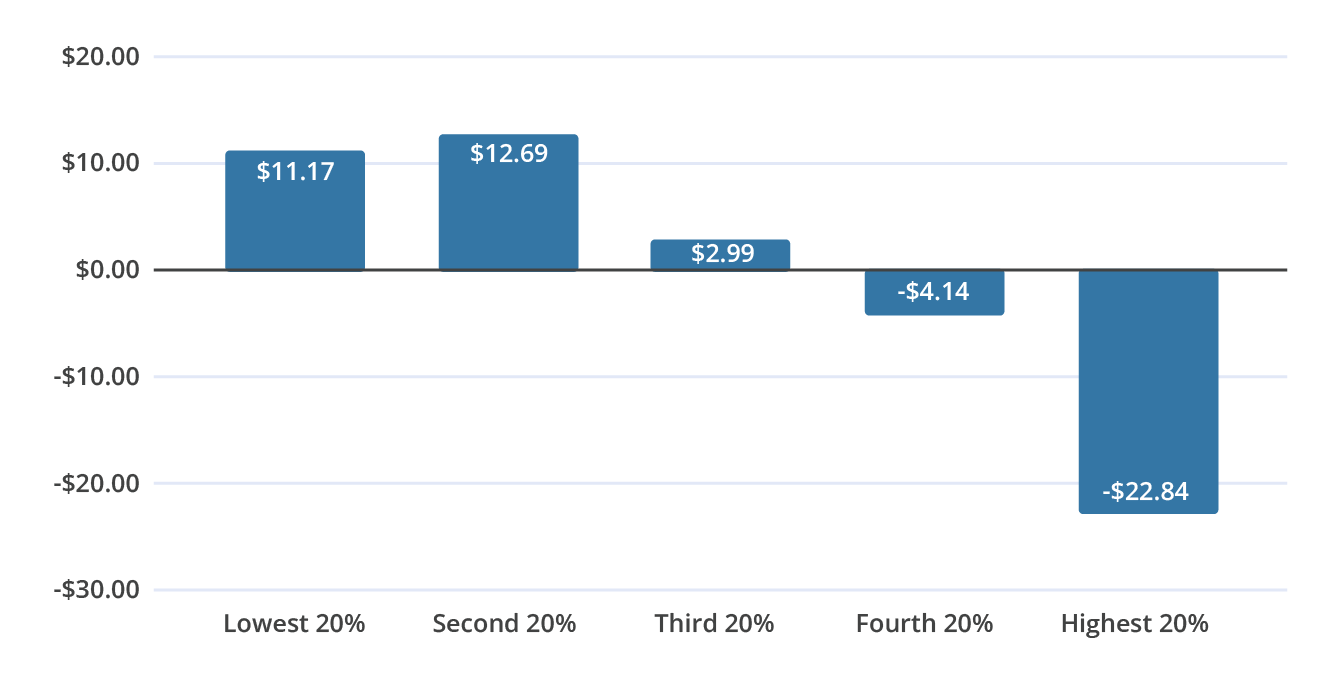
Source: CEX
It should be noted that economists and carbon tax advocates have a reasonable response to these concerns, namely that consumers can be made whole by using the revenue from carbon pricing to reduce existing taxes or fund a per capita dividend. Indeed, this is an option for officials who have pledged not to raise taxes: ATR’s website, as well as statements by Grover Norquist, the creator of the Taxpayer Protection Pledge, make it clear that revenue-neutral or revenue-negative tax swaps do not violate the pledge.8Common Questions Asked about the State Taxpayer Protection Pledge, Americans for Tax Reform, https://www.atr.org/sites/default/files/assets/StatePledgeQ%26A.pdf; see also “Norquist: Carbon-Tax Swap for Income-Tax Cut Wouldn’t Violate No-Tax-Hike Pledge”, National Journal, https://www.nationaljournal.com/s/89105/norquist-carbon-tax-swap-income-tax-cut-wouldnt-violate-no-tax-hike-pledge.
Reasonable though it may be, however, this response has not been convincing in practice. Hesitancy—if not outright opposition—on the part of voters and elected officials remains a significant hurdle for carbon pricing.
A third political challenge for carbon pricing is the attitude of businesses, notably electric utilities. Although many utilities—including investor-owned utilities such as Georgia Power, as well as publicly owned utilities such as Nebraska PPD—are pledging to reduce their carbon emissions, they also remain focused on keeping rates low, and so they are unlikely to be advocates for carbon pricing.9“Net Zero Transition,” Southern Company, https://www.southerncompany.com/sustainability/net-zero-and-environmental-priorities/net-zero-transition.html; see also “NPPD Board Approves Net-Zero Carbon Goal by 2050,” Nppd.com, Nebraska Public Power District, December 13, 2021, https://www.nppd.com/press-releases/nppd-board-approves-net-zero-carbon-goal-by-2050. These utilities are politically powerful. Georgia Power, for example, has made over $2.6 million in campaign contributions since 2006 and is known as a lobbying powerhouse.10“Campaign Reports Search | Georgia Government Campaign Finance Commission of Georgia,” https://media.ethics.ga.gov/search/Campaign/Campaign_ByContributionsearchresults.aspx?Contributor=Georgia%20Power&Zip=&City=&ContTypeID=0&PAC=&Employer=&Occupation=&From=&To=&Cash=&InK=&Filer=&Candidate=&Committee=; https://media.ethics.ga.gov/search/Campaign/Campaign_ByContributions.aspx Daniel Malloy, “Southern Company, a Lobbying Powerhouse, Fights New Carbon Rules,” The Atlanta Journal-Constitution, August 31, 2013, https://www.ajc.com/news/national-govt–politics/southern-company-lobbying-powerhouse-fights-new-carbon-rules/asjXSzcKsnYDRSuoFxmBJJ/; Kate Galbraith, “Why Is a Utility Paying Customers?” The New York Times, January 23, 2010, https://www.nytimes.com/2010/01/24/business/energy-environment/24idaho.html. Political insiders joke that the state is named after the company. (Similar jokes are made elsewhere.) Publicly owned utilities also hold a great deal of political sway, in part because they are so closely connected to customer utility bills.
These political realities have generally resulted in one of two outcomes, both of them economically inefficient. Left-leaning jurisdictions and administrations have tended to pursue regulatory approaches—“command and control” measures such as fuel economy standards or renewable portfolio standards—that can be costly and heavy-handed. In contrast, right-leaning jurisdictions and administrations have tended to favor laissez faire approaches that ignore the economics of externalities and the serious risks posed by climate change altogether.
Neither left nor right is enthusiastic about the economically efficient solution—putting a price on carbon—because of the political challenges associated with raising consumer prices for things like gasoline and electricity. These political realities motivate our approach, which is to put a price on carbon that doesn’t raise consumer prices on average, and will even lower consumer prices in the long run.
Our approach is suboptimal in many ways: It only works in one sector (electricity) and in certain jurisdictions (e.g., in Georgia, Nebraska, and the 16 other US states that have significant existing taxes on electricity); it only creates a modest price on carbon; and it coexists uneasily with one of the key precepts of tax policy, namely having a tax base that is as broad as possible.11Jeremy Horpedahl and Josh T. Smith, “What Should Be Included in a State’s Sales Tax Base?” The Center for Growth and Opportunity at Utah State University, June 22, 2021, https://www.thecgo.org/research/what-should-be-included-in-a-states-sales-tax-base/.
However, internalizing externalities is also a key precept of tax policy, and in a world of the second-best, we believe this proposal is worthy of consideration.
Climate Action Tax Swaps and Climate Action Tax Cuts
Our proposal focuses on the electricity sector in jurisdictions that impose significant sales taxes or other taxes on residential consumption of electricity. This includes 18 US states (see Table 1 below) as well as major metropolitan regions such as New York City. The burden imposed by these existing taxes creates an opportunity to incentivize emissions reductions using a carrot rather than a stick.
Climate Action Tax Swaps
A Climate Action Tax Swap eliminates an existing tax on electricity and replaces it with a carbon tax on electricity. In Georgia, for example, (discussed in more detail in the first case study below) the 4% state sales tax applies to most residential and commercial sales of electricity. Since the average price of electricity is about 11 cents per kWh ($110 per MWh), the sales tax amounts to about $4.40 per MWh.
That’s the equivalent of a carbon tax of $12 per metric ton of CO2 because a $12 carbon tax on Georgia utilities (which average about 0.37 metric tons of CO2 per MWh) would also average $4.40 per MWh. (This short-run revenue-neutrality would turn into a long-run tax cut as utilities reduce their carbon intensities. We argue below that this would be a positive development.)
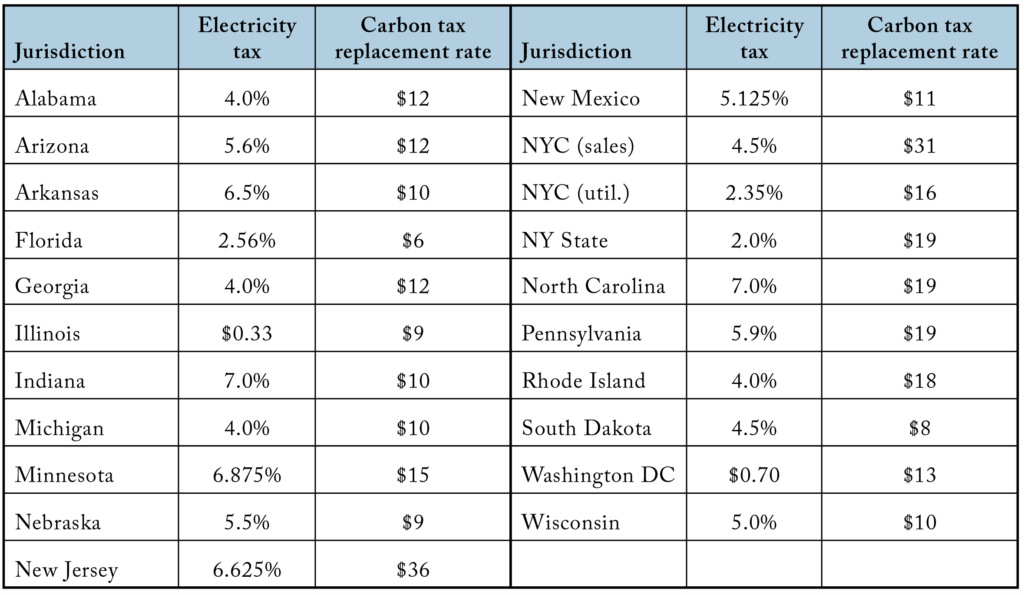
Table 1 shows existing tax rates on electricity in 20 US jurisdictions and the carbon tax equivalents of those taxes, that is, the carbon tax rate for which a tax swap would be revenue-neutral in the short run.
Table 1. Jurisdiction, Tax on Residential Electricity (per dollar or per kWh), and Carbon Tax Replacement Rate12State tax rates on electricity are based on (1) residential utility bills from all 50 states (data collected by the authors), (2) the authors’ analysis of state tax codes, and (3) Sales and Use Tax Chart: Taxability of Utilities in the State Sales Tax, https://house.louisiana.gov/tsmc/Documents/2015/Sep/Taxability%20of%20Utilities%20in%20the%20State%20Sales%20Tax%20-%20Scott%20Drenkard.pdf; Revenue from existing state taxes is calculated using these rates and “Electric Power Annual 2020 – US Energy Information Administration,” https://www.eia.gov/electricity/annual/; see in particular table 2.9, “Revenue from sales of electricity to ultimate customers by end-use sector, by state.” Carbon tax replacement rate is calculated using “Table 2.8. Sales of Electricity to Ultimate Customers by End-Use Sector by State, 2020 and 2019” SAS Output, US Energy Information Administration, https://www.eia.gov/electricity/annual/html/epa_02_08.html;
This tax-swap option explicitly connects our approach to a carbon tax and showcases the resulting benefits in terms of economic efficiency. However, it carries the political baggage of carbon taxes, it risks increasing taxes for customers of utilities with high carbon intensities, and there are legal complexities involved in creating a new tax.
A second option—Climate Action Tax Cuts—may be able to overcome these hurdles while maintaining a similar incentive structure.
Climate Action Tax Cuts
A Climate Action Tax Cut reduces the rate of the existing tax on electricity based on the carbon intensity of that electricity. In Georgia, for example, the state sales tax rate could remain at 4% for utilities with a carbon intensity of 0.4 MTCO2/MWh or more but go down to 3.9% for utilities with a carbon intensity of 0.39, and to 3.8% for utilities with a carbon intensity of 0.38, etc., leading ultimately to zero state sales tax for utilities with zero carbon emissions.
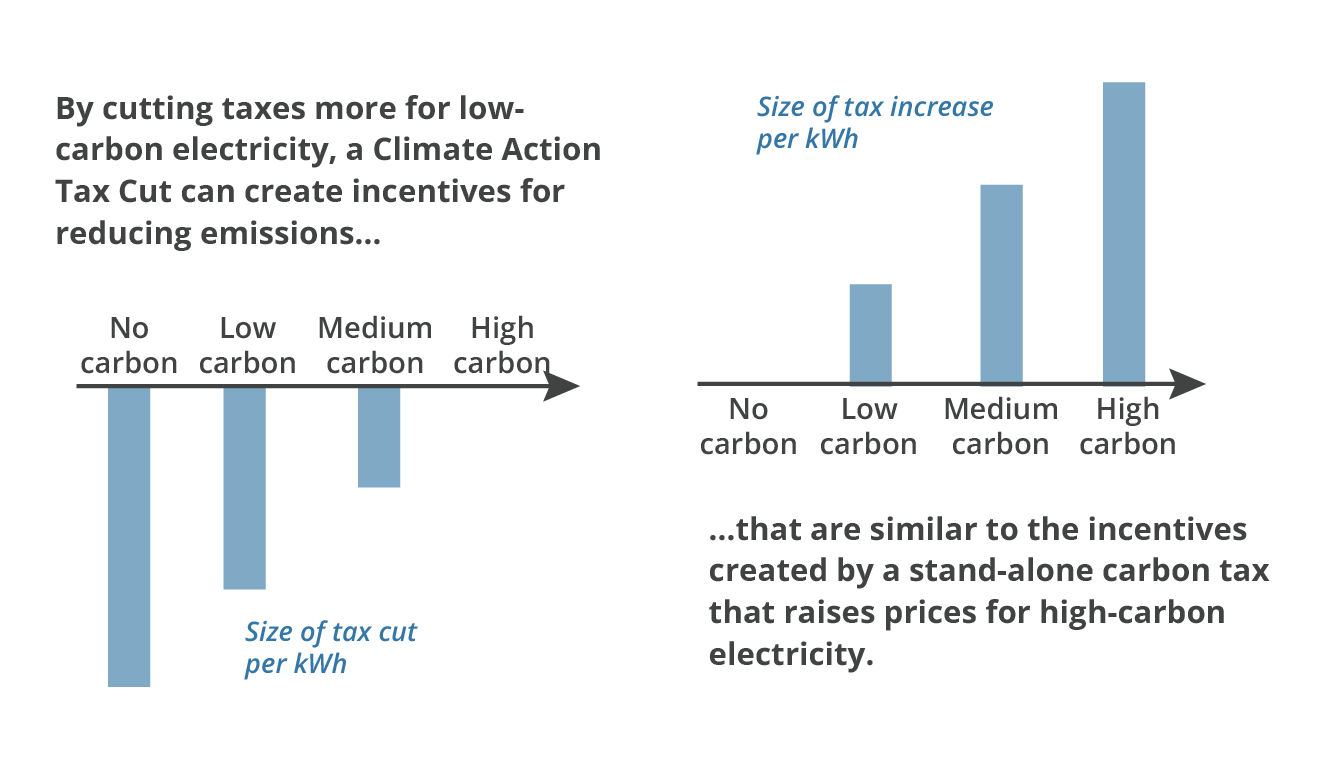
As suggested by figure 2, both the tax cut and the tax swap turn out to be quite similar in effect. For a numerical example, consider the impact of the Climate Action Tax Cut described above on a utility in Georgia with a carbon intensity of 0.3 MTCO2/MWh and prices equal to the statewide average of 11 cents per kWh or $110/MWh. Lowering emissions by 0.1 MTCO2/MWh would lower its sales tax rate by one percentage point, producing a tax savings of $1.10/MWh or $11 per MTCO2 reduction.
As a result, the incentive for this utility under the Climate Action Tax Cut is very close to the $12 per ton CO2 incentive created by the Climate Action Tax Swap. (In this case the difference is because Georgia’s average carbon intensity is actually 0.37, not 0.40, and we round up to 0.40 for the purpose of the Climate Action Tax Cut.)
Figure 2. Incentive Similarities of the Climate Action Tax Swap and the Climate Action Tax Cut
More generally, the two policies would differ somewhat in certain situations. One such example concerns utilities with carbon intensities that are “too high.” In the example described above, a Georgia utility with a carbon intensity of 0.5 wouldn’t see any sales tax reduction if it reduced its carbon intensity from 0.5 to 0.4, so the incentives would be different under a Climate Action Tax Cut compared to a Climate Action Tax Swap.
Another example concerns utilities with prices that are higher or lower than the statewide average: A $12 per ton CO2 Climate Action Tax Swap creates the same incentive for emissions reductions regardless of the utilities’ existing prices, but a Climate Action Tax Cut would create stronger incentives for utilities with high prices and weaker incentives for utilities with low prices. (In the extreme, a utility with prices approaching zero would generate sales tax revenues approaching zero, meaning that a Climate Action Tax Cut would become ineffective at that point.)
Additional Considerations
Measuring Carbon Emissions
Both approaches described above require measuring the carbon emissions associated with electricity. This is challenging because of the complicated nature of electricity markets, but fortunately there are a variety of established protocols currently used by companies, third parties, and governments. These protocols can be used to calculate carbon emissions and carbon intensities and to address complications such as Renewable Energy Credits (RECs) and spot-market purchases.
One option is the Electric Power Sector Protocol (EPS) available for free from The Climate Registry, a non-profit based in California whose members include Bonneville Power Administration, Pacific Gas & Electric, Seattle City Light, and various subsidiaries of Xcel Energy.13“Electric Power Sector Protocol | The Climate Registry,” https://www.theclimateregistry.org/tools-resources/reporting-protocols/electric-power-sector-protocol/; “CRIS Public Reports | The Climate Registry,” https://www.theclimateregistry.org/our-members/cris-public-reports/.
In many cases a delivery-based metric (such as EPS “Single System-Average Anthropogenic Delivery Metric”) is likely to be the best approach, but in some cases a generation-based metric (such as the EPS “Entity Average Generation Metric”) will be superior. For example, the utilities in Nebraska and South Dakota are members of the Southwest Power Pool (SPP). A delivery-based metric would simply yield the SPP average for these utilities, while a generation-based metric would establish a closer connection between each individual utility’s operations and their carbon emissions, as measured by the EPS protocol, thereby perhaps creating more appropriate incentives for these utilities.
Tax Incidence and Market Structure
We are assuming throughout that all taxes—carbon taxes as well as sales taxes—are fully passed through to customers. Given this assumption, it is worth asking whether utilities will be incentivized to act in a way that saves money for their customers. The answer is Yes—or at least the answer should be Yes—but the logic depends on which of three categories the utility is in.
First, there are publicly owned utilities: electric co-ops or municipal utilities such as Nebraska PPD or Dalton (GA) Utilities. These utilities are controlled by their customers (e.g., through board elections). The utility should therefore act in these public members’ interests. All else equal, if moving from (say) coal to renewables can reduce customer bills, then the board should pursue those moves, and if they don’t, then voters will have an incentive to replace the board.
Second, there are utilities in deregulated markets where customers can choose their electric supplier. In this case each supplier generates or contracts for the power it sells, so each supplier can be associated with a carbon intensity for the power it delivers. That carbon intensity will affect customer bills if our proposal is implemented, so the incentives should work smoothly in accordance with Adam Smith’s invisible hand. If the tax-inclusive price from supplier A is higher than the tax-inclusive price from supplier B, consumers should have an incentive to switch from A to B. The power of competition should consequently lead electricity suppliers to minimize costs for their customers by reducing their carbon emissions when possible.
Finally, there are regulated-monopoly, investor-owned utilities such as Georgia Power. In these cases, the utility is regulated by a public utilities commission (PUC) or similar public board.14“An Introduction to Your Georgia Public Service Commission,” The PSC, https://psc.ga.gov/about-the-psc/. The regulatory environment here can be a bit opaque, but there are at least two paths by which the policies we discuss could create incentives for utilities to reduce emissions.
First, many utilities have carbon-reduction goals, but these utilities also often target the goal of low-cost power, so our policies could help utilities make the case that low-carbon investments will also lower costs for customers. Second, the PUCs themselves could push utilities to reduce carbon emissions in ways that will lower the tax-inclusive price for customers.
Tax Revenue and Utility Investments
Economists generally believe that there’s no such thing as a free lunch, so it’s worth pointing out two of the costs associated with a successful implementation of our approach.
One such cost is a loss of state tax revenue if and when utilities reduce carbon emissions. We argue elsewhere in this paper that the long-run revenue impact is modest and is justified by considerations of both climate and tax regressivity, but it is nonetheless true that our approach would lower state government revenue relative to the status quo.
Another cost comes from utility investments. Under our approach, a utility may choose to (say) invest in renewables plus batteries to replace fossil generation because that would result in lower tax-inclusive prices for consumers. Despite these price reductions, it is still true that the investment in renewables comes at a cost. This can be easily seen by comparing our approach to an alternative that simply exempts electric utilities from sales taxes, no strings attached. (Of course, this alternative approach wouldn’t provide any incentives for emissions reductions.)
Why Is Electricity Special?
Could the types of policies we are suggesting work in other sectors besides electricity? One could imagine some possibilities—for example, replacing per-gallon taxes on motor gasoline with a carbon tax that would leave the cost of driving unchanged but give drivers an incentive to use lower-carbon fuels such as compressed natural gas—but for the most part we think the answer is No. For a number of reasons, we think electricity is a special case for which our approach—a carbon tax that doesn’t raise consumer prices on average, and may even lower them—makes sense even though the economic ideal is to fully internalize externalities so that both consumers and producers have the appropriate incentives.
First, demand for electricity is highly inelastic, especially for the residential and commercial customers that are the focus of our policy. Burke and Abayasekara (2018) estimate that the short-run elasticity of demand for electricity across all sectors is -0.1 on average, meaning that a 1% increase in the price of electricity is associated with just a 0.1% decrease in demand for electricity within the same year.15Paul J. Burke and Ashani Abayasekara, “The Price Elasticity of Electricity Demand in the United States: A Three-Dimensional Analysis,” The Energy Journal 39, no. 2 (April 1, 2018), https://www.iaee.org/energyjournal/article/3055.
They estimate long-run demand to be somewhat more elastic—about -1 for residential consumption and between -0.3 and -0.6 for commercial consumption—but they note that their results show more elasticity than most other studies.16See M. A. Bernstein and J. Griffin, “Regional Differences in the Price-Elasticity of Demand for Energy,” February 1, 2006, https://doi.org/10.2172/877655. The bottom line is that residential and commercial electricity consumers are not highly responsive to price changes.
As a result, there is limited real-world importance in the fact that our policy deviates from the textbook approach by cushioning the price impact on consumers rather than fully internalizing externalities. If consumers were highly price sensitive—if higher electricity prices made them turn off the lights—then our approach might be less attractive. But in reality, the main impact of a carbon tax in the electricity sector is not that it pushes consumers to turn off the lights, but that it pushes producers to lower carbon emissions by fuel-switching: substituting natural gas for coal or renewables for fossil fuels. This incentive remains in full force if policymakers implement our proposal.
Second, there is an important debate about whether electricity prices are too high or too low relative to the efficient level. They might be too low because of external costs, including those associated with climate change, that often are not incorporated in marginal costs. But they might be too high because fixed costs (notably, for transmission) often are incorporated in marginal costs. Borenstein and Bushnell (2019) argue that marginal prices are actually above marginal social cost (defined as marginal private cost plus climate and local pollution externalities) for much of the country.17Severin Borenstein and James Bushnell, Do Two Electricity Pricing Wrongs Make a Right? Cost Recovery, Externalities, and Efficiency, Working Paper, Energy Institute at Haas WP 294R (July 2021), https://haas.berkeley.edu/wp-content/uploads/WP294.pdf. (See figure 3 below, replicated from their paper.)
Figure 3. Marginal Price Minus Average Social Marginal Cost per KWh
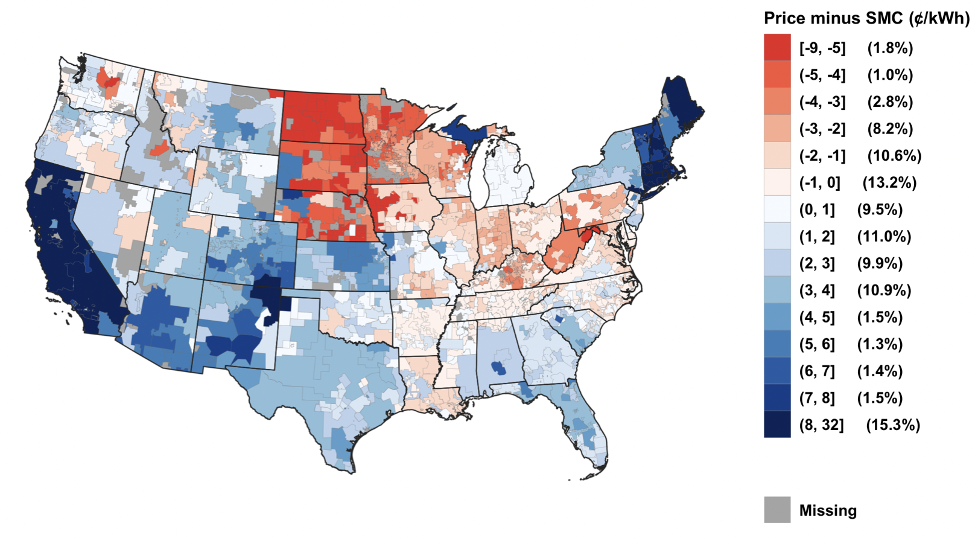
Source: Borenstein and Bushnell, 2019
Third, and connected, is an argument regarding relative costs. One likely path forward on climate change is to “electrify everything,” that is, decarbonize the electricity sector and then use electricity rather than fossil fuels to power other sectors, notably transportation and building heating and cooling systems. Efforts that drive up costs in the electricity sector but not in other sectors—such as Senator Ron Wyden’s 2021 proposal for a carbon tax that exempts motor gasoline, or non-pricing approaches such as renewable portfolio standards that focus on the electricity sector—would make the “electrify everything” approach more difficult by increasing the price of electricity relative to other forms of energy.
As economist Severin Borenstein puts it, such efforts could “undermine electrification by driving up power prices.”18Severin Borenstein, “It’s Time for Rooftop Solar to Compete with Other Renewables,” Nature Energy 7, no. 4 (April 2022): 298–298, https://doi.org/10.1038/s41560-022-01015-8. On Senator Wyden’s proposal, see Jonathan Weisman and Coral Davenport, “Democrats Consider Adding Carbon Tax to Budget Bill,” The New York Times, September 24, 2021, https://www.nytimes.com/2021/09/24/us/politics/carbon-tax-democrats.html. Our approach leaves relative prices unchanged in the short run, and in fact lowers the relative price of electricity if and when electricity-sector emissions (and consequently electricity-sector taxes) decline.
Fourth and finally, the regressive nature of taxes on residential electricity (discussed above) means that there is an equity argument for cushioning price increases for residential electricity.
Taking into consideration all of the above, the end result is that a tax swap that incentivizes producers to reduce emissions without increasing consumer prices on average makes sense in the electricity sector. The next two sections explore the ramifications and feasibility of our proposals with case studies of two states, Georgia and Nebraska.
Case Study: Georgia
Although Georgia elected two Democratic US Senators in 2021, the state legislature and governor’s office are currently controlled by Republicans. The Taxpayer Protection Pledge, which requires politicians to vote against or veto any net tax increase, has been adopted by eight out of 14 US congressional representatives, 22 out of 236 state legislators, and Georgia’s governor.19“About the Pledge;” “Pledge Database,” Americans for Tax Reform, https://www.atr.org/pledge-database/.
There is no consumer choice in the electricity market in Georgia. Roughly half of the state’s electricity is supplied by Georgia Power, an investor-owned utility that is a division of Southern Company. Most of the rest comes from co-op and municipal public power entities.
The 4% state sales tax in Georgia applies to residential and most commercial sales of electricity. There are exemptions for manufacturing and for sales to governments, hospitals, educational facilities, and certain other nonprofits.20See “Title 48 Revenue and Taxation,” Official Code of Georgia Annotated (OGCA), https://advance.lexis.com/documentpage/?pdmfid=1000516&crid=fbc8fe86-02f6-4b11-bd6d-7b212cf7c37d&nodeid=ABWAAB&nodepath=%2FROOT%2FABW%2FABWAAB&level=2&haschildren=&populated=false&title=TITLE+48+Revenue+and+Taxation&config=00JAA1MDBlYzczZi1lYjFlLTQxMTgtYWE3OS02YTgyOGM2NWJlMDYKAFBvZENhdGFsb2feed0oM9qoQOMCSJFX5qkd&pddocfullpath=%2Fshared%2Fdocument%2Fstatutes-legislation%2Furn%3AcontentItem%3A6348-G0H1-DYB7-W2S3-00008-00&ecomp=vg1_kkk&prid=6405b16f-b5e1-401a-8455-13e09443ef22, especially 48-8-2 and 48-8-3. Table 2 estimates $469 million in revenue from the state sales tax on electricity based on 2019 US Energy Information Administration (EIA) data on state electricity sales and revenue.21“Table 2.8. Sales of Electricity to Ultimate Customers by End-Use Sector by State, 2020 and 2019;” “Table 2.9. Revenue from Sales of Electricity to Ultimate Customers by End-Use Sector by State, 2020 and 2019.” SAS Output, US Energy Information Administration, https://www.eia.gov/electricity/annual/html/epa_02_09.html. (Note that the commercial sector estimate in the table is a bit high because it doesn’t account for any exemptions.)
Table 2. Estimated Electricity Sales Tax Revenue in Georgia
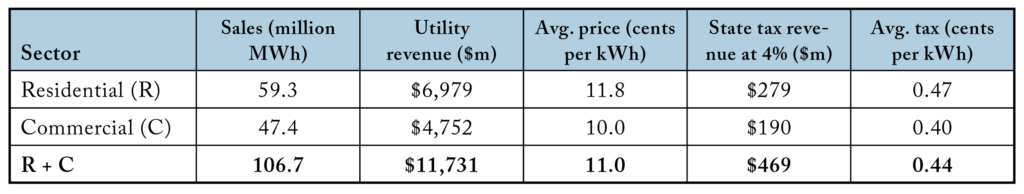
For context, that $469 million makes up:222019 Annual and Statistical Report, Georgia Department of Revenue, https://dor.georgia.gov/annual-and-statistical-report.
- 5% of total sales tax revenue in Georgia in FY 2019 ($6.3 billion);
- 0% of total state revenue collection ($23.8 billion);
- A bit less than the size of the sales tax exemption for grocery store food that was passed in 1996. (The state’s annual Tax Expenditure Report estimates the state sales tax exemption for groceries—which applies to state sales tax, not local sales tax—at $559 million for FY2019. It also says that all state sales tax proceeds go into the State General Fund.23Tax Expenditure Report – FY2019, Governor’s Office of Planning and Budget, Georgia, https://opb.georgia.gov/budget-information/budget-documents/tax-expenditure-reports.)
Climate Action Tax Swap
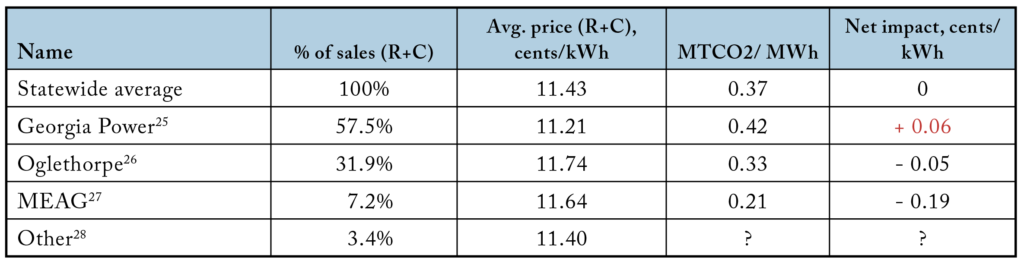
Table 3 has 2019 estimates of Georgia utilities’ percent market share for the residential and commercial sectors (R+C) and 2019 or other recent estimates of their carbon intensity (with coal-fired power and gas-fired power being roughly 1.0 and 0.5 MTCO2/MWh, respectively):24Volker Krey, Omar Masera, et al., “Annex II: Metrics & Methodology,” Climate Change 2014: Mitigation of Climate Change, Cambridge, MA: Cambridge University Press (2014), https://www.ipcc.ch/site/assets/uploads/2018/02/ipcc_wg3_ar5_annex-ii.pdf.
The statewide average is an estimated 0.37 MTCO2/MWh. The previous table shows 107 million MWhs of R+C sales, so based on those numbers a carbon tax of about $11.43 per ton CO2 would generate the same $469 million in revenue as the existing state sales tax.
Table 3. Impact of a Carbon Tax Swap on Major Georgia Utilities
25 2020 Financial Review: Annual Report of the US Investor-Owned Electric Utility Industry, Edison Electric Institute, https://www.eei.org/issues-and-policy/finance-and-tax.
26 “Where Power Originates – Oglethorpe Power Corp.,” https://opc.com/where-power-originates/#portfolio.
27 “Generation – MEAG Power,” https://www.meagpower.org/power/generation/.
28 “Electric Facilities,” Dalton Utilities, https://www.dutil.com/electric-facilities/.
Table 3 and figure 4 show the impact on consumer prices of a carbon tax swap given the current carbon intensity of Georgia utilities. There would be a slight increase for Georgia Power25 2020 Financial Review: Annual Report of the US Investor-Owned Electric Utility Industry, Edison Electric Institute, https://www.eei.org/issues-and-policy/finance-and-tax. customers (0.06 cents per kWh) and a slight decrease for the publicly owned utilities (e.g., -0.19 cents per kWh for MEAG customers). Overall the short-run impact on prices is quite modest.2626 “Where Power Originates – Oglethorpe Power Corp.,” https://opc.com/where-power-originates/#portfolio. 27 “Generation – MEAG Power,” https://www.meagpower.org/power/generation/. 28 “Electric Facilities,” Dalton Utilities, https://www.dutil.com/electric-facilities/.
In the long run, carbon intensities are likely to fall significantly, meaning that this tax swap will benefit consumers as emissions and electricity-sector taxes decline. One factor is that the Scherer Coal Plant Unit 4 is scheduled to close (replaced by gas with an option for solar) in 2022.29Brendan Rivers, “JEA Approves Plan to Close Unit at Plant Scherer, 1 of Nation’s Biggest Carbon Emitters,” WJCT News, June 26, 2020, https://news.wjct.org/first-coast/2020-06-26/jea-approves-plan-to-close-unit-at-plant-scherer-1-of-nations-biggest-carbon-emitters; “Plant Scherer” in Wikipedia, November 7, 2021, https://en.wikipedia.org/wiki/Plant_Scherer. An even bigger factor is that Units 3 and 4 of the Vogtle nuclear plant are supposed to come online in 2023.30Vogtle 3 & 4, Georgia Power Company, https://www.georgiapower.com/content/dam/georgia-power/pdfs/company-pdfs/Vogtle-Update-3-4-Fact-Sheet-03212022.pdf. All Vogtle units are co-owned by Georgia Power (45.7%), Oglethorpe (30%), MEAG (22.7%) and Dalton Utilities (1.6%).31“Home | Georgia Power,” https://www.georgiapower.com/; “Oglethorpe Power Corp.,” https://opc.com/; “MEAG Power,” https://www.meagpower.org/; “Dalton Utilities,” https://www.dutil.com/. Plant Vogtle Units 3 and 4 are expected to prevent 10 million metric tons of CO2 emissions annually.32“VOGTLE,” Energy.gov, https://www.energy.gov/lpo/vogtle.
Figure 4. Average of Residential and Commercial Electricity Prices for Georgia Utilities Under the Existing 4% State Sales Tax Versus an $11.43 Carbon Tax
Replacing the Georgia state sales tax with an $11.43 carbon tax would have very little impact on prices. (Georgia utilities by type and average residential/commercial price, sized by market share (aggregated))
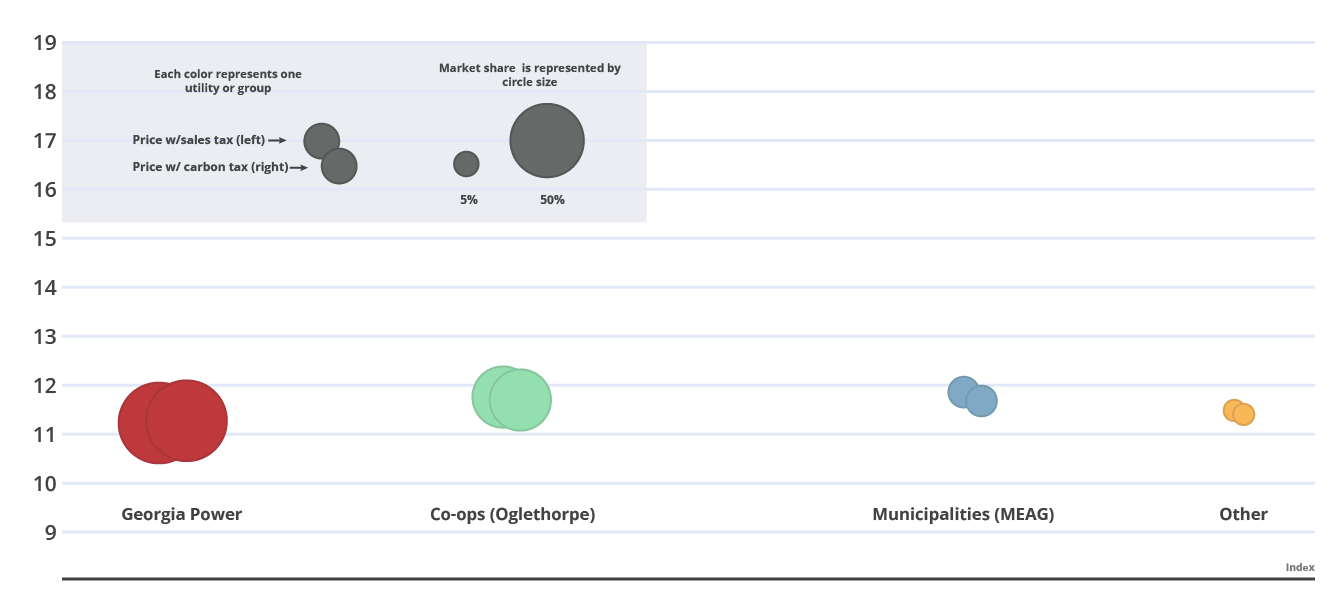
Note: This figure (and related figures) are better viewed online: Here’s prices with sales tax versus carbon tax (shown here), and here’s a detailed disaggregation.
Climate Action Tax Cut
The state sales tax in Georgia is 4%, and the table above shows a statewide carbon intensity of 0.37 MTCO2/MWh, so an obvious way to implement this option is to keep the 4% state sales tax rate for utilities with a carbon intensity of 0.4 or more but cut the rate to 3.9% for utilities that achieve a carbon intensity of 0.39, to 3.8% for utilities that achieve a carbon intensity of 0.38, etc. For a utility with prices equal to the statewide average of 11 cents per kWh, the resulting marginal incentive is equivalent to $11 per ton CO2. (At a price of 11 cents per kWh, or $110/MWh, lowering emissions by 0.1 MTCO2/MWh cuts the tax rate by one percentage point, producing a tax savings of $1.10/MWh or $11 per MTCO2 reduction.)
In the short run this would leave the state sales tax rate unchanged at 4% for Georgia Power, which has a current carbon intensity of 0.42. It would lower the sales tax rate modestly (to 3.3%) for the Oglethorpe co-ops and more significantly (to 2.2%) for the municipalities in MEAG. These initial tax reductions would reduce electricity sales tax revenues by about $47 million, or about 10%. (Whether or not these initial reductions are “fair” depends on your perspective about why some utilities are further along in their decarbonization efforts than other utilities.)
In the long run, sales tax rates would sunset along with electricity-sector carbon emissions. As with the Climate Action Tax Swap, these emissions would sunset faster because of the new tax incentive. And, as noted above, developments related to Units 3 and 4 of the Vogtle nuclear plant could play an important role.
Long-Run Revenue Considerations
Assuming that the electricity sector will eventually be carbon-free, our proposal concerns about $469 million per year, or 2.0% of total state revenue collection ($23.8 billion).33David M. Curry, Department of Revenue FY2019 Statistical Report, Georgia Department of Revenue, April 13, 2020, https://dor.georgia.gov/annual-and-statistical-report. This is not an insignificant amount, but it is relatively small compared to other tax reforms Georgia has made in recent years:
- Georgia’s long-standing sales tax exemption for grocery store food is estimated to cost the state $559 million per year.34Tax Expenditure Report – FY2019, Georgia, https://opb.georgia.gov/document/tax-expenditure-reports/tax-expenditure-report-fy-2019/download. (This estimate comes from the Consumer Expenditure Survey estimate discussed above. Another estimate, the Personal Consumption Expenditures from the National Income and Product Accounts, puts annual expenditures on “food purchased for off-premises consumption” at 50% more than the CEX estimate, so the revenue loss from the sales tax exemption for groceries could potentially be 50% more than the figure listed here.35“Consumer Expenditure Surveys (CE) CE/PCE Concordance,” Bureau of Labor Statistics, March 19, 2019, https://www.bls.gov/cex/cepceconcordance.htm.)
- In April 2022, Georgia’s governor signed HB 1437, which will replace Georgia’s graduated income tax with a flat tax of 5.49% in 2024, declining further to 4.99% by 2029.36Georgia Income Tax Table, Georgia Department of Revenue, 2020, https://dor.georgia.gov/georgia-income-tax-tables; Georgia General Assembly, Income Tax; Revise Rates of Taxation on Income, HB 147, 2021–2022 sess., https://www.legis.ga.gov/legislation/62346. The bill also increases the standard deduction and eliminates most tax deductions, along with a few other changes, for a total estimated cost of $1 billion in annual foregone revenue.37James Salzer, “Georgia House Quickly OKs $1 Billion Income Tax Cut, Rate Reduction,” Atlanta Journal-Constitution, March 9, 2022, https://www.ajc.com/politics/georgia-house-quickly-oks-1-billion-income-tax-cut-rate-reduction/FORI4URZJRGQFCRSOOBOYUZEEQ/. The flat tax provision alone would cost around $645 million each year, nearly $200 million more than a Climate Action Tax Cut. Furthermore, this flat tax provision would make Georgia’s tax structure more regressive, whereas our proposal would make it more progressive by phasing out a regressive sales tax on electricity.38Danny Kanso, “Letter Asking Lawmakers to Reject Risky Flat Tax.” Georgia Budget and Policy Institute, March 24, 2022, https://gbpi.org/letter-asking-lawmakers-to-reject-risky-flat-tax/.
Figures 5 and 6 show Georgia General Fund tax revenue, first in constant dollars per capita and then as a percentage of state GDP. (The data are for 2002–2019 and combine state budget data with Census Bureau population data and FRED data on GDP deflators and state GDP.39“Governor’s Budget Reports,” FY2007-2021, Governor’s Office of Planning and Budget, https://opb.georgia.gov/budget-information/budget-documents/governors-budget-reports; US Census Bureau, “Population and Housing Unit Estimates Datasets,” Census.gov, https://www.census.gov/programs-surveys/popest/data/data-sets.html; US Bureau of Economic Analysis, “Gross Domestic Product: Implicit Price Deflator,” FRED, https://fred.stlouisfed.org/series/GDPDEF; US Bureau of Economic Analysis, “Gross Domestic Product: All Industry Total in Georgia,” FRED, https://fred.stlouisfed.org/series/GANGSP.) Figure 5 shows that state General Fund taxes per capita decreased during the Great Recession but increased since 2010 by an average of $64 per year, adjusted for inflation and in 2019 dollars.40Nicholas Johnson, Catherine Collins, and Ashali Singham, “State Tax Changes in Response to the Recession,” Center on Budget and Policy Priorities, March 9, 2010, https://www.cbpp.org/research/state-tax-changes-in-response-to-the-recession. This revenue increase is due to economic growth since tax rates have consistently declined in Georgia over this time period.41“Budget In Briefs,” FY2004-2020, Governor’s Office of Planning and Budget, https://opb.georgia.gov/budget-briefs. In a zero-carbon future, presumably many years down the road, our proposal would entail an annual revenue loss of about $44 per capita, which we estimate would be made up by eight months’ worth of economic growth.
Figure 5. Georgia General Fund Revenue Per Capita (constant 2012 dollars)
The state sales tax on electricity generates about $469 million in revenue ($44 per capita).
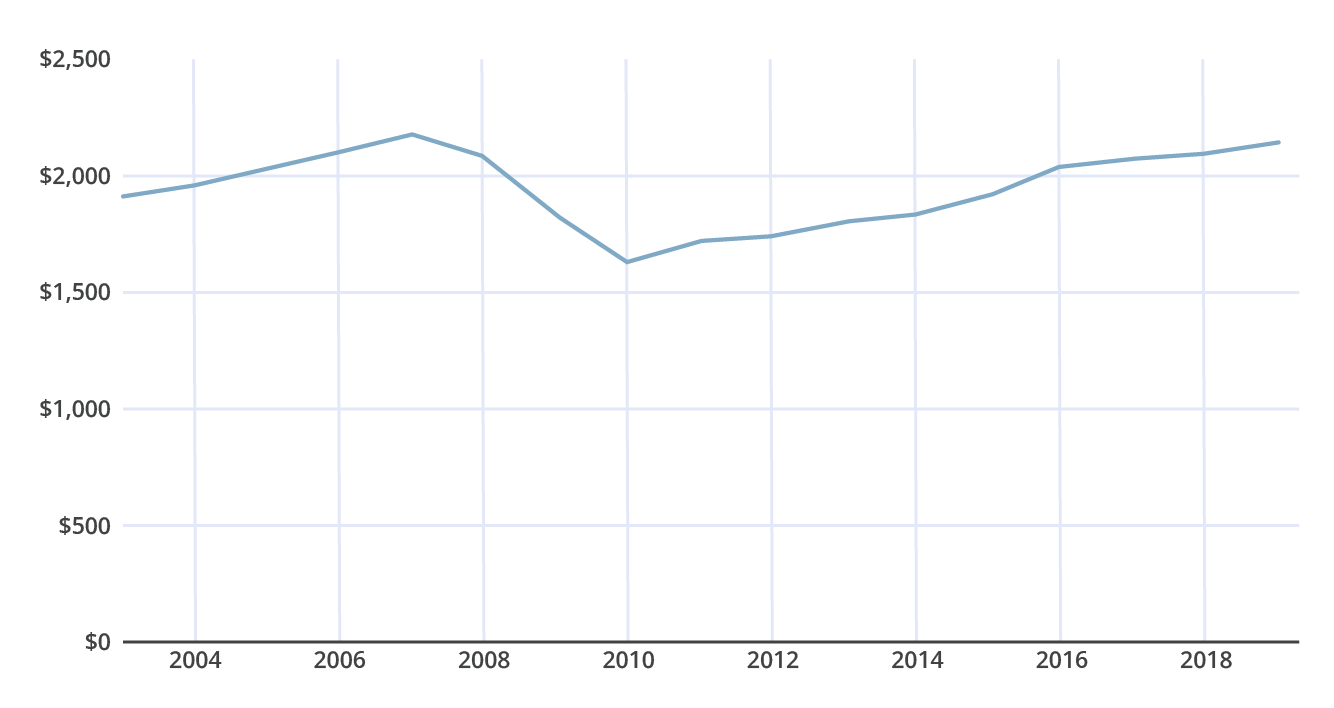
Figure 6 shows that General Fund tax revenue has declined from 4.85% of GDP in 2003 to 3.64% of state GDP in 2019, with the sharpest decrease occurring immediately following the Great Recession. In a zero-carbon future, our proposal would entail a revenue loss of just 0.07 percentage points, with the current value of 3.64% changing to 3.57%.
Figure 6. Georgia General Fund Revenue as a Percentage of State GDP
The state sales tax on electricity amounts to just 0.07% of state GDP. 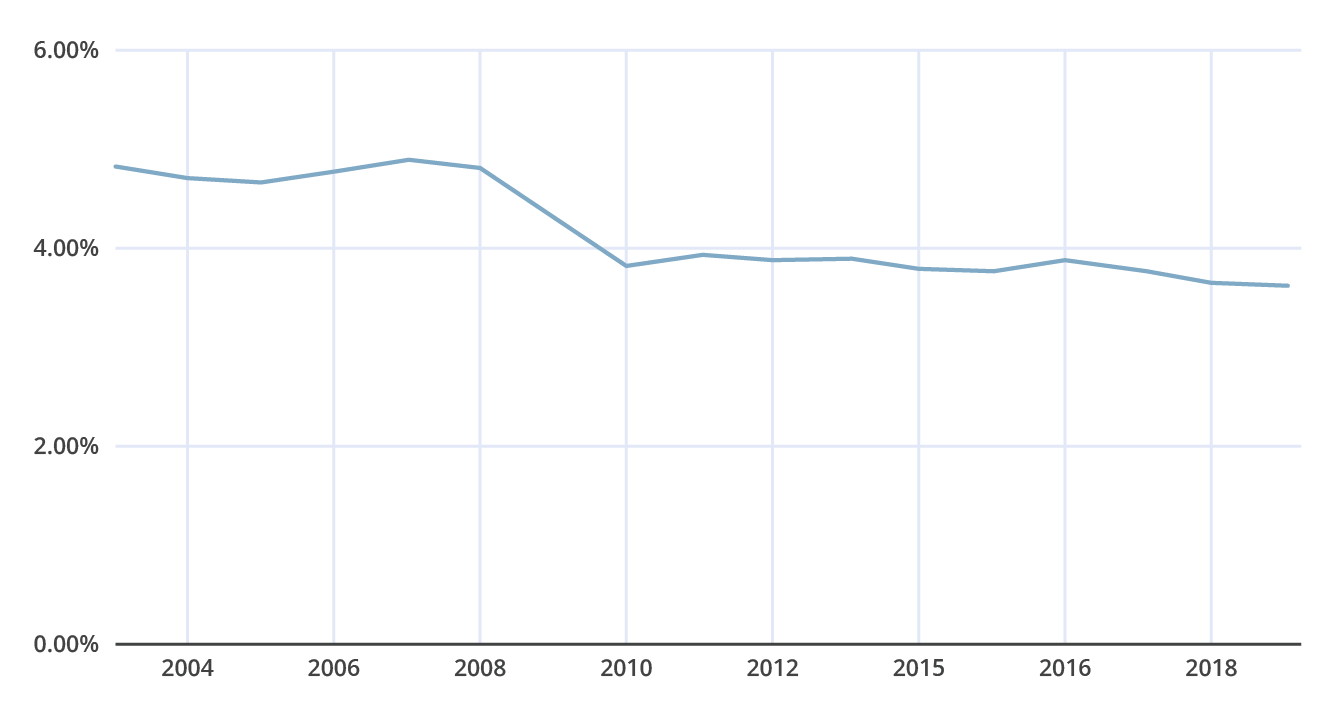
Case Study: Nebraska
Republicans control the Nebraska governor’s office as well as the state legislature, which has only one chamber. The Taxpayer Protection Pledge, which requires politicians to vote against or veto any net tax increase, has been adopted by both US senators, all three congressional representatives, and four out of 49 state senators, including the chair of the Revenue Committee.42“About the Pledge;” “Pledge Database.” Americans for Tax Reform, https://www.atr.org/pledge-database/; “Revenue Committee,” Nebraska Legislature, http://news.legislature.ne.gov/rev/.
There is no consumer choice in the electricity market in Nebraska. The state is unique in being 100% public power: all electricity is supplied by public entities.43“Public Power in Nebraska,” Nebraska City Utilities, https://www.nebraskacityutilities.com/general/public-power-in-nebraska/. The biggest utilities are Nebraska Public Power District (NPPD), Omaha Public Power District (OPPD), and Lincoln Electric System, all of which have made pledges to be net zero by mid-century.44Zoya Teirstein, “In a Red-State First, Nebraska Plans to Decarbonize Power Sector by Mid-Century,” Grist, December 10, 2021, https://grist.org/energy/in-a-red-state-first-nebraska-plans-to-decarbonize-power-sector-by-mid-century/. Some of the state’s power comes from Western Area Power Administration (WAPA), a federal hydropower program, and many of the state’s smaller PPDs get all of their non-WAPA power from NPPD.
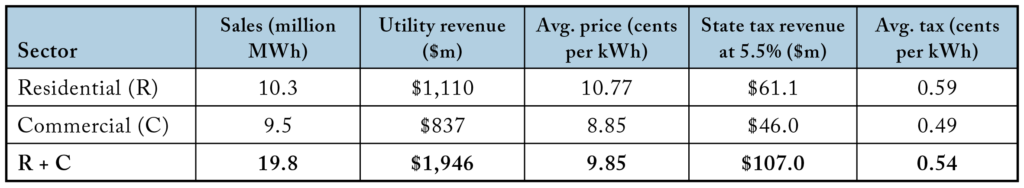
The 5.5% state sales tax in Nebraska applies to most residential and commercial sales of electricity. There are exemptions for manufacturing and for sales to governments, hospitals, educational facilities, and certain other nonprofits.45See Chapter 77, especially 77-2703 and 77-2704. Nebraska Revised Statutes Chapters, Nebraska Legislature, Chapter 77, https://nebraskalegislature.gov/laws/browse-chapters.php?chapter=77. Table 4 estimates $107 million in revenue from the state sales tax on electricity based on 2019 EIA data on state electricity sales and revenue.46“Table 2.8. Sales of Electricity to Ultimate Customers by End-Use Sector by State, 2020 and 2019;” “Table 2.9. Revenue from Sales of Electricity to Ultimate Customers by End-Use Sector by State, 2020 and 2019.” (The commercial sector estimate in the table is a bit high because it doesn’t account for any exemptions.)
Table 4. Estimated Electricity Sales Tax Revenue in Nebraska
For context, that $107 million makes up:47“General Fund Receipts,” Nebraska Department of Revenue, April 18, 2019, https://revenue.nebraska.gov/research/general-fund-receipts.
- 8% of General Fund sales tax revenue in Nebraska in fiscal year 2019 ($1.85 billion);
- 2% of total General Fund revenue ($4.87 billion);
- Roughly half the size of the sales tax exemption for groceries that was passed in 1983. (Page A9 of the 2020 Tax Expenditure Report estimates the state sales tax exemption for food at $206 million for FY2019.48Tony Fulton, State of Nebraska 2020 Tax Expenditure Report, Nebraska Department of Revenue, October 15, 2020, https://revenue.nebraska.gov/sites/revenue.nebraska.gov/files/doc/research/tax-expenditure/2020_Tax_Expenditure_Report.pdf.)
Climate Action Tax Swap
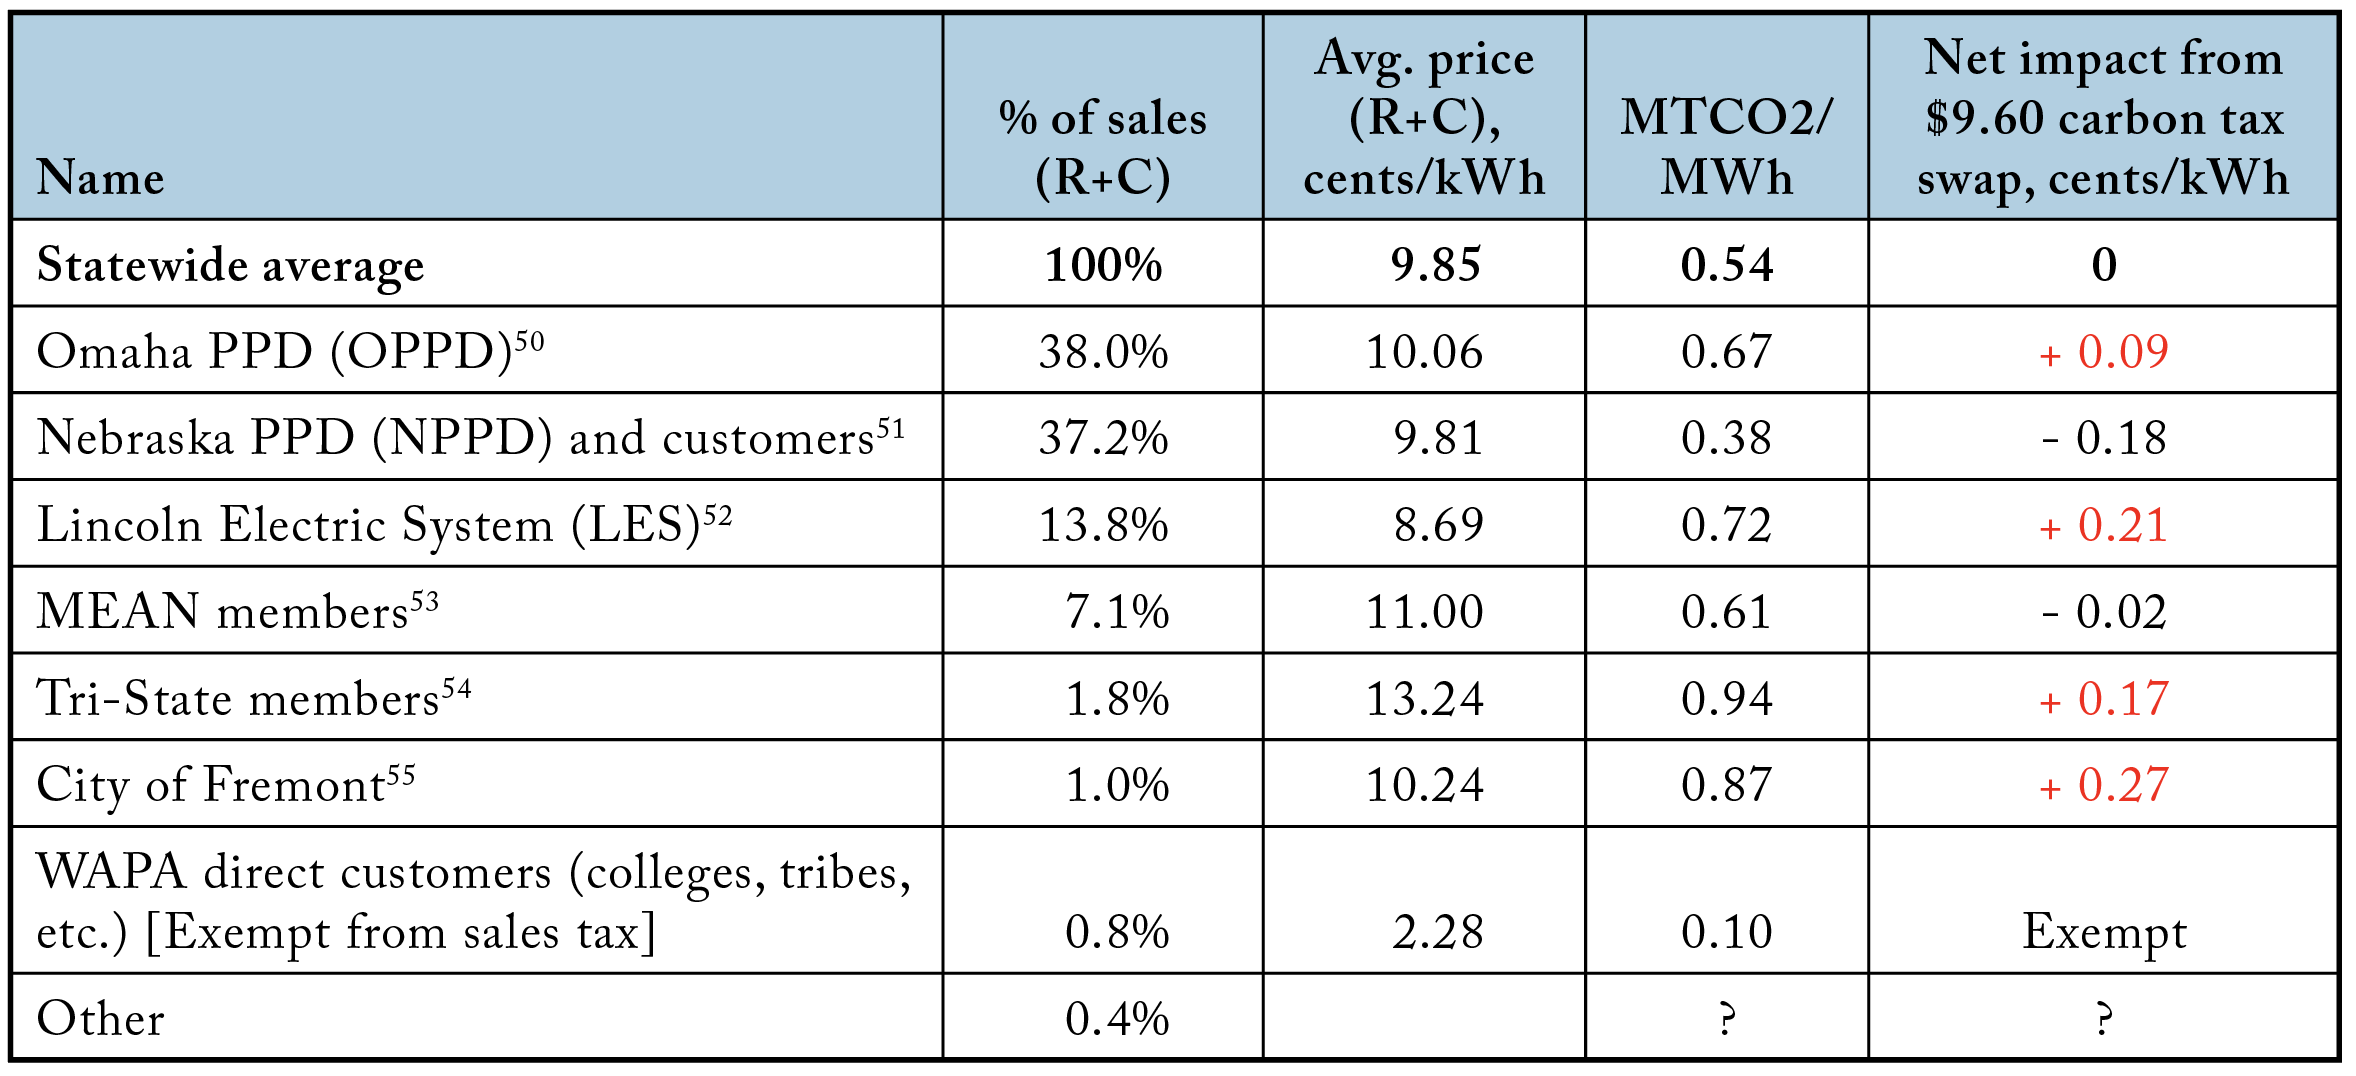
It can be difficult to find carbon intensity data for public utilities. However, table 5 has 2019 estimates of Nebraska utilities’ percent market share for the residential and commercial sectors (R+C) and our best estimates of their 2019 carbon intensity (with coal-fired power and gas-fired power being roughly 1.0 and 0.5 MTCO2/MWh, respectively).49Krey, Masera, et al., “Annex II: Metrics & Methodology.” The statewide average is an estimated 0.54 MTCO2/ MWh. Table 4 shows 20 million MWhs of R+C sales, so based on those numbers a carbon tax of about $9.60 per ton CO2 would generate the same $107 million in revenue as the existing state sales tax.
Table 5. Impact of a Carbon Tax Swap on Major Nebraska Utilities
50 OPPD Quick Facts, Omaha Public Power District, 2021, https://www.oppd.com/media/216550/quick-facts.pdf.
51 Nebraska Public Power District, 2018 Integrated Resource Plan, https://assets.website-files.com/5a26c42ac0c9b00001479372/5b5770b5caf86259c6c1c753_2018IntegratedResourcePlan.pdf.
52 “Generation Resources,” Lincoln Electric System, https://www.les.com/company/generation-resources.
53 “Power Supply Resources,” Municipal Energy Agency of Nebraska, https://mean.nmppenergy.org/about/power-supply-resources.
54 “Benchmarking Air Emissions of the 100 Largest Electric Power Producers in the US,” MJ Bradley & Associates, https://www.mjbradley.com/content/emissions-benchmarking-emissions-charts.
55 Integrated Resource Plan 2018 to 2022, City of Fremont, Nebraska,” https://www.fremontne.gov/DocumentCenter/View/5093/Final-Integrated-Resource-Plan-2018-8242018.
Table 5 and figure 7 show the impact on consumer prices of a carbon tax swap given the current carbon intensity of Nebraska utilities. There would be a slight increase for some utilities (e.g., 0.21 cents per kWh for LES) and a slight decrease in others (e.g., -0.18 cents per kWh for NPPD). Overall, the short-run impact on prices is modest. In the long run, carbon intensities will fall significantly if utilities fulfill their net-zero pledges, meaning that this tax swap will benefit consumers.50 OPPD Quick Facts, Omaha Public Power District, 2021, https://www.oppd.com/media/216550/quick-facts.pdf. 51 Nebraska Public Power District, 2018 Integrated Resource Plan, https://assets.websitefiles.com/5a26c42ac0c9b00001479372/5b5770b5caf86259c6c1c753_2018IntegratedResourcePlan.pdf. 52 “Generation Resources,” Lincoln Electric System, https://www.les.com/company/generation-resources. 53 “Power Supply Resources,” Municipal Energy Agency of Nebraska, https://mean.nmppenergy.org/about/power-supply-resources. 54 “Benchmarking Air Emissions of the 100 Largest Electric Power Producers in the US,” MJ Bradley & Associates, https://www.mjbradley.com/content/emissions-benchmarking-emissions-charts. 55 Integrated Resource Plan 2018 to 2022, City of Fremont, Nebraska,” https://www.fremontne.gov/DocumentCenter/View/5093/Final-Integrated-Resource-Plan-2018-8242018
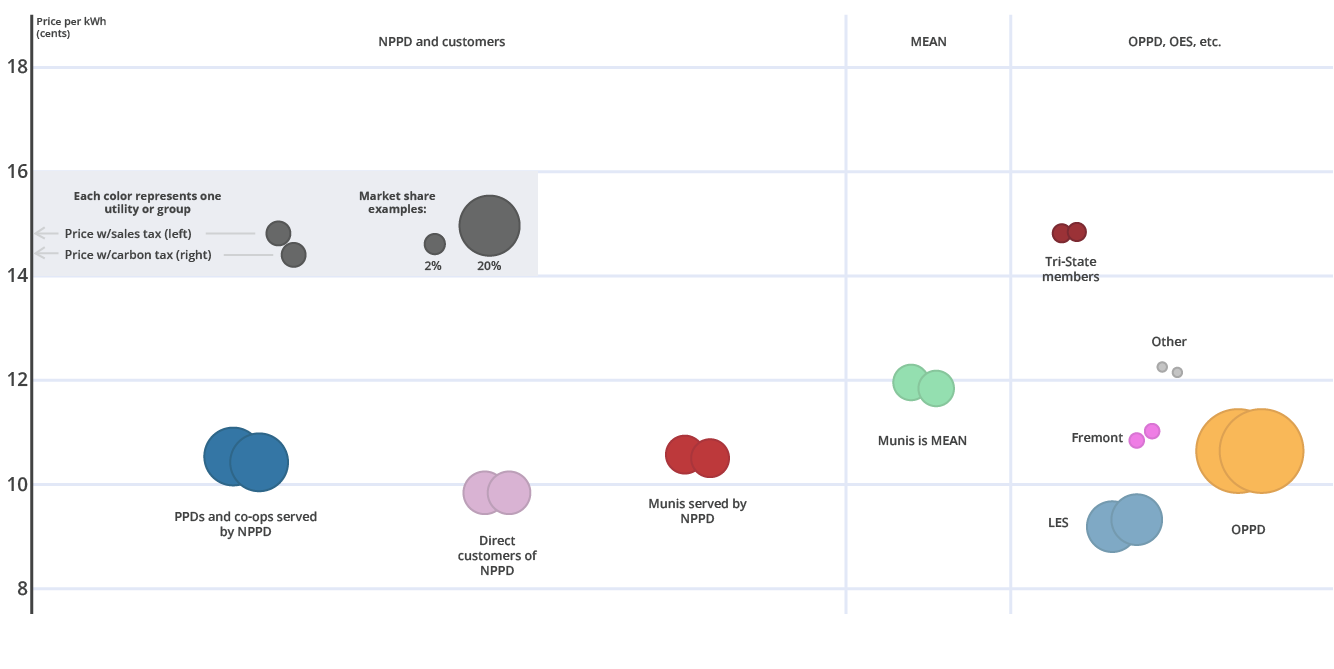
Figure 7. Average of Residential and Commercial Electricity Prices for Nebraska Utilities Under the Existing 5.5% State Sales Tax Versus a $9.60 Carbon Tax
Replacing the Nebraska state sales tax on electricity with a $9.60 carbon tax on electricity has little impact on prices. (Nebraska utilities by type and average residential/commercial price, sized by market share (aggregated), excludes state institutions)
 Note: This figure (and related figures) are better viewed online: here’s prices with sales tax versus carbon tax (shown here), and here’s a detailed disaggregation.
Climate Action Tax Cut
The state sales tax in Nebraska is 5.5%, and table 5 shows a statewide carbon intensity of about 0.54 MTCO2/MWh, so an obvious way to implement this option is to keep the 5.5% state sales tax rate for utilities with a carbon intensity of 0.55 or more, but cut the rate to 5.4% for utilities that achieve a carbon intensity of 0.54, to 5.3% for utilities that achieve a carbon intensity of 0.53, etc. For a utility with prices equal to the statewide average of 10 cents per kWh, the resulting marginal incentive is equivalent to $10 per ton CO2. (At a price of 10 cents per kWh or $100/MWh, lowering emissions by 0.1 MTCO2/MWh cuts the tax rate by one percentage point, producing a tax savings of $1.00/MWh or $10 per MTCO2 reduction.)
In the short run this would leave the state sales tax rate unchanged at 5.5% for utilities such as OPPD, which has a current carbon intensity of 0.67. It would lower the sales tax rate modestly (to an average of 3.8%) for direct and indirect customers of NPPD, for whom the average carbon intensity is 0.38. Those initial tax reductions would reduce electricity sales tax revenues by about $7 million, or about 6%.
Whether or not these initial reductions are “fair” depends on your perspective about why some utilities are further along in their decarbonization efforts than other utilities. It is also worth repeating that the estimates above are not exact: the estimate for Tri-State is based on generation only—not purchased power—and seems quite high given that Tri-State aims to be 50% renewables by 2024.56“Increase Clean Energy,” Tri-State Generation and Transmission Association, https://www.tristate.coop/increasing-clean-energy. Another example is the estimate for NPPD, which comes from “native load” calculations in its 2018 Integrated Resource Plan that seem likely to produce a carbon intensity that is lower than the number that would result from following an independent protocol such as the one from The Climate Registry’s Electric Power Sector Protocol.57Nebraska Public Power District, 2018 Integrated Resource Plan; “Electric Power Sector Protocol,” The Climate Registry, https://www.theclimateregistry.org/tools-resources/reporting-protocols/electric-power-sector-protocol/.
In the long run, sales tax rates would sunset along with electricity-sector carbon emissions. As with the Climate Action Tax Swap, these emissions would sunset faster because of the new tax incentive.
Long-Run Revenue Considerations
Assuming that the electricity sector will eventually be carbon-free, our proposal entails a long-run loss of about $100 million per year, or roughly 2% of the $4.7 billion in state General Fund tax revenue. This amount is certainly not insignificant, but it is small relative to two other tax-related measures:
- The state’s sales tax exemption for food, passed in 1983, is estimated to cost the state $206m per year.58Fulton, State of Nebraska 2020 Tax Expenditure Report. As noted in the Georgia case study, this figure is based on Consumer Expenditure Survey data. Data from another estimate, the Personal Consumption Expenditures from the National Income and Product Accounts, suggests that the revenue loss could be 50% higher.59“Consumer Expenditure Surveys,” US Bureau of Labor Statistics, March 19, 2019, https://www.bls.gov/cex/cepceconcordance.htm.
- In April 2022, Nebraska’s governor signed LB 873, described by the Omaha World-Herald as a tax measure that would “ratchet down the state’s top corporate and individual income tax rates over five years, expand income tax credits offered to property taxpayers and phase out income taxes on Social Security benefits.”60Nebraska State Legislature, “Change Provisions Relating to Corporate and Individual Income Taxes, Taxation Of Social Security Benefits, and Property Tax Credits Legislative Document,” LB 873, 2022 sess., https://nebraskalegislature.gov/bills/view_bill.php?DocumentID=47318; Martha Stoddard, “’Transformative’ Nebraska Tax Cut Package Advances After Stumbling Twice,” Omaha World Herald, March 30, 2022, https://omaha.com/news/state-and-regional/govt-and-politics/transformative-nebraska-tax-cut-package-advances-after-stumbling-twice/article_73d9211c-b036-11ec-94cc-f77434ca0850.html. The bill’s fiscal note estimates a loss in General Fund revenue of $116 million in fiscal year 2023, rising to $948 million in fiscal year 202761Keisha Patent, LB 873 Fiscal Note, rev. 2, Nebraska State Legislature, April 5, 2022, https://nebraskalegislature.gov/FloorDocs/107/PDF/FN/LB873_20220405-105310.pdf.
It is also important to note that the long-run revenue loss from our proposal will likely phase in over a decade or more, meaning that normal economic growth will help balance it out. Figures 8 and 9 show Nebraska General Fund tax revenue, first in constant dollars per capita and then as a percentage of state GDP. (The data are for 2002–2019 and combine state budget data with Census Bureau population data and FRED data on GDP deflators and state GDP.62“Annual Budgetary Reports FY 1999–2019,” Nebraska Department of Administrative Services, https://das.nebraska.gov/accounting/annual-budget-report.html; US Census Bureau, “National Population Totals and Components of Change: 2010–2019,” Census.gov, https://www.census.gov/data/datasets/time-series/demo/popest/2010s-national-total.html; US Census Bureau, “State Intercensal Tables: 2000-2010,” Census.gov, October 8, 2021, https://www.census.gov/data/tables/time-series/demo/popest/intercensal-2000-2010-state.html; US Bureau of Economic Analysis, “Gross Domestic Product: Implicit Price Deflator,” FRED; US Bureau of Economic Analysis, “Gross Domestic Product: All Industry Total in Nebraska,” FRED, https://fred.stlouisfed.org/series/NENGSP.
Figure 8 shows that state General Fund taxes per capita have increased by about $23 per person per year, which we believe is largely, if not entirely, due to economic growth and not to changes in the tax code.63“Major Legislative Changes 2010–2021,” Nebraska Department of Revenue, https://revenue.nebraska.gov/about/information-guides/legislation/major-legislative-changes. (The trend may be even larger if you account for the Great Recession or for the tax cuts that may have taken place during that period.) In a zero-carbon future, our proposal would entail a loss of $50 per capita—that is, the lost revenue would be equal to the expected gain in revenue from about 2 years’ worth of economic growth.
Figure 8. Nebraska General Fund Revenue Per Capita (constant 2012 dollars)
The state sales tax on electricity generates about $100 million ($50 per capita).
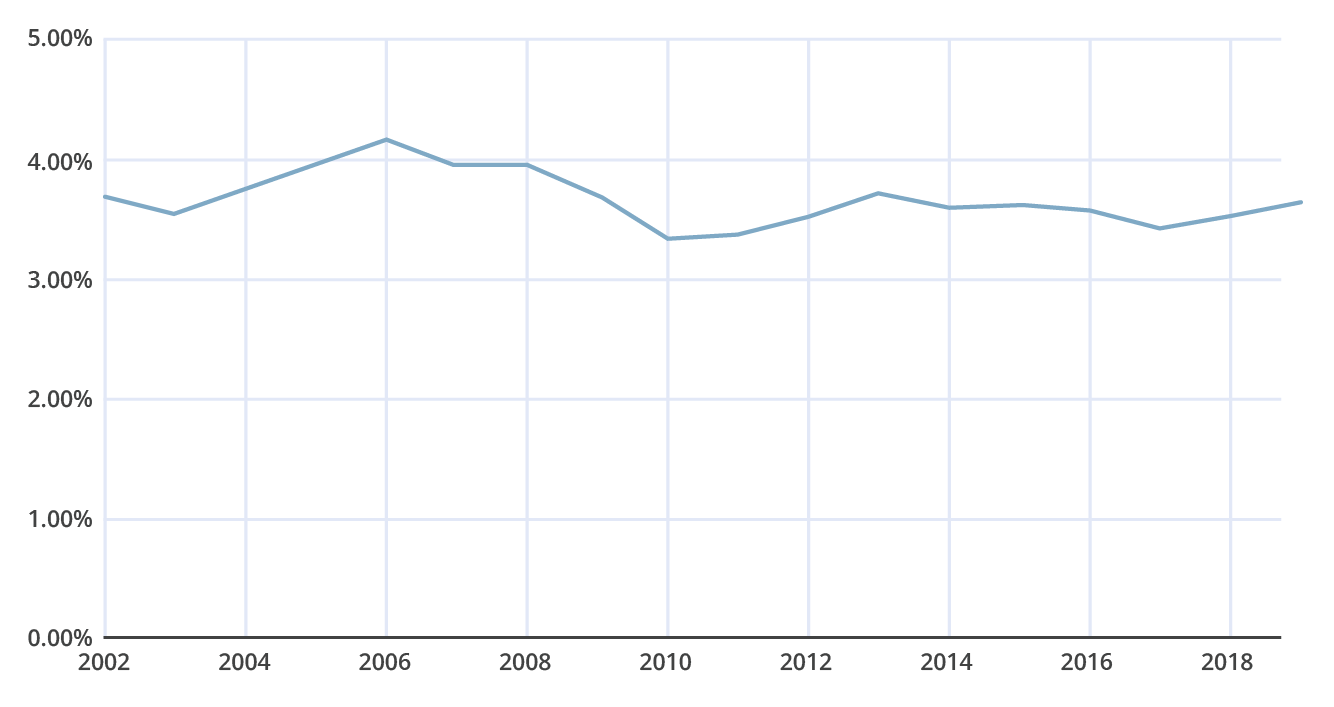
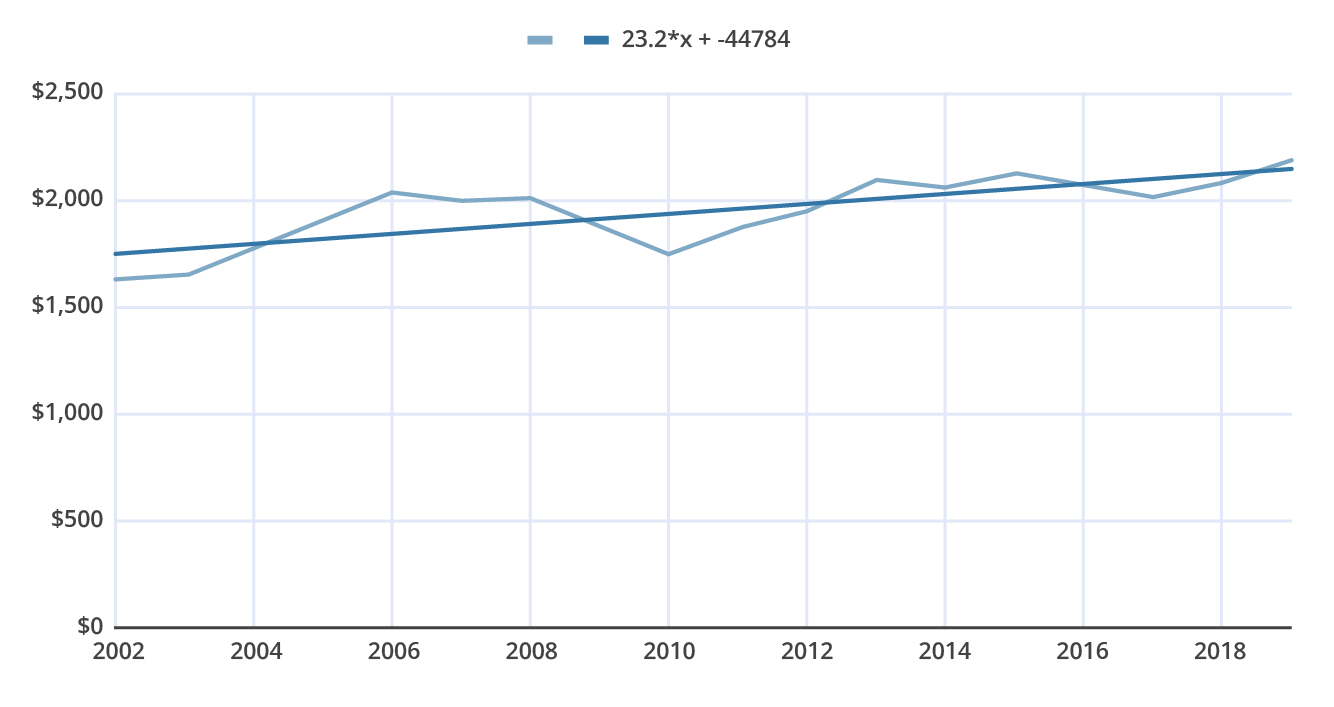 Figure 9 shows that General Fund tax revenue has varied between 3.3% and 4.2% of state GDP. In a zero-carbon future, our proposal would entail a revenue loss of less than 0.1 percentage points, with the current value of 3.65% changing to 3.58%.
Figure 9. Nebraska General Fund Revenue as a Percentage of State GDP
The state tax on electricity amounts to less that 0.1 percentage points of state GDP.
Applications in Other Jurisdictions
It might be possible to implement this sort of tax swap at the municipal level. For example, many local jurisdictions in Utah impose a 6% municipal energy tax.64Utah State Tax Commission, Frequently Asked Questions: Municipal Energy Sales and Use Tax, https://tax.utah.gov/selfreviews/municipalenergy/faq.pdf. However, municipalities might be highly dependent on this sort of revenue. If the revenue could be made up elsewhere, some municipalities have high enough sales taxes that a tax swap could make a big difference. For instance, as seen in table 1, New York City’s electricity taxes are the revenue equivalent of a hefty $47 carbon tax.
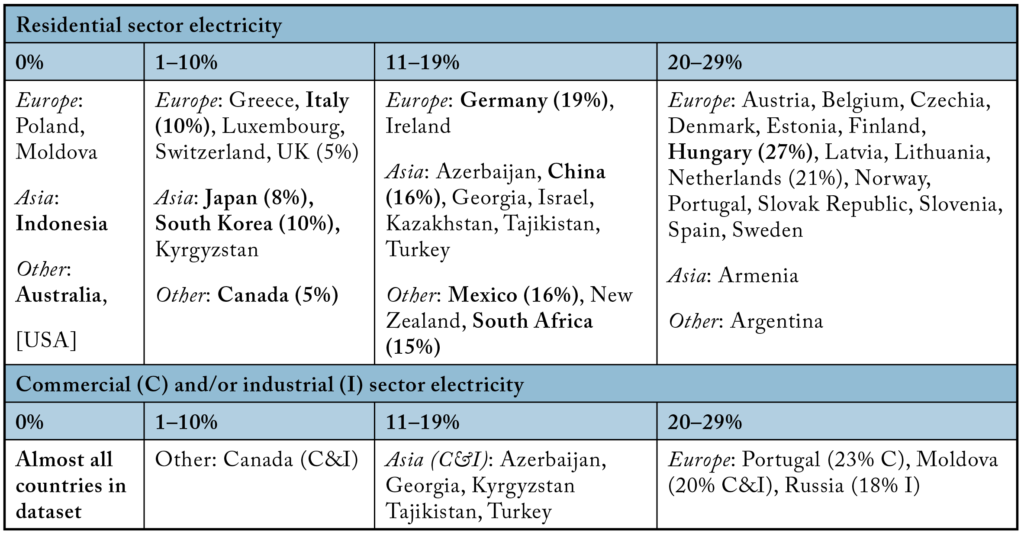
It might also be possible to implement this sort of tax swap internationally. Table 6 highlights value added tax rates on residential electricity in 2019 as listed in International Energy Agency’s (IEA) 2020 World Energy Prices Report.65Energy Prices: Overview, International Energy Agency, https://www.iea.org/reports/energy-prices-overview/energy-taxation; see in particular the “Taxation information file” linked from this page. Some of these international jurisdictions could be especially promising opportunities for emission reductions because their value added tax rates are much higher than state sales tax rates in the US, meaning the revenue-equivalent carbon tax rate would likely be higher.
Table 6. Value Added Taxes on Electricity in IEA Energy Prices Taxation Database, 2019
Conclusion
The policies we propose in this paper are a modest but not insignificant effort toward pocketbook-friendly, economically sensible climate action. These policies are close to revenue-neutral in the short run and hold the promise of sunsetting regressive electricity taxes in the long run. And they share one of the key advantages that come with all market-based policies: they create a menu of choices rather than restricting choices in the manner of a command-and-control-style regulatory approach.
Replacing a sales tax with a carbon tax, or reducing the sales tax rate in line with carbon intensity, doesn’t force utilities to cut emissions. If there are concerns about the reliability or cost of lower-carbon power sources, utilities can simply continue their current operations: no harm, no foul. But if a lower-carbon alternative does make sense, our approach creates a financial incentive to pursue it.