

“All people in the U.S. (regardless of race, color, religion, sex, age, ethnicity, or immigration status) are guaranteed protection from abuse under the law.”
-U.S. Citizenship and Immigration Services
1. Introduction
Almost 2 million individuals were deported between 2009 and 2013 as a consequence of intensified immigration enforcement (Vaughan, 2013). Police testimony, anecdotal reports, and empirical research suggest local police involvement in immigration enforcement increases fear and mistrust among immigrant communities, reducing their willingness to engage with the police (Nguyen and Gill, 2015). In response, some states and localities have limited the cooperation of their police with immigration authorities via what have been labeled as sanctuary policies.1Los Angeles Police Department. 2009. “The LAPD Fights Crime, Not Illegal Immigration.” LA Times, Oct. 27. Available at http://articles.latimes.com/2009/oct/27/opinion/oe-bratton27. This paper provides the first empirical evidence on how domestic violence reporting by immigrants, as measured by self-petitions for legal permanent residence under the provisions of the Violence Against Women Act (VAWA), responds to sanctuary policies.2See Appendix A for the definition of domestic violence.
Domestic violence is a serious underreported crime in the United States (Huecker and Smock, 2020), with 20 people being physically abused by an intimate partner every minute.3Domestic violence national statistics retrieved from www.ncadv.org. Immigrant women can face greater challenges than their native counterparts when reporting a domestic violence episode for various reasons. Aside from frequently depending economically on their partners when they lack work permits, immigrant women often rely on their husbands for adjusting their immigration status.4 For example, H4 visas holders were not allowed to get employment authorization until 2015.,55 See https://www.nationallatinonetwork.org/safety-planning/systems-based-safety-and-security-from-the-aggressor/143-english/facts-statistics. In addition, many of these immigrant women have U.S. born children (Migration Policy Institute, 2019). Fear of losing custody of their kids in a legal battle may further prevent them from reporting domestic violence or from seeking help (Kasturirangan, Krishnan, and Riger, 2004). Acknowledging these facts, in 1994 the U.S. Congress introduced special provisions for immigrant women in a federal law against domestic violence (Violence Against Women Act, henceforth VAWA). Under VAWA, immigrant women can self-petition for the adjustment of their immigration status, as well as their children’s immigration status. However, recent changes in immigration policy might have affected immigrant women’s reporting of domestic violence by altering the costs and benefits of reporting abuse. This situation might have become worse following the administration’s decision on June 11, 2018, to disallow protection from deportation on the grounds of domestic violence.6See https://www.nytimes.com/2018/06/11/us/politics/sessions-domestic-violence-asylum.html.
Understanding how the reporting of domestic violence by immigrants is affected by the new policy context is crucial for various reasons. First, it may help us address the high economic and social cost of domestic violence worldwide.77 The World Health Organization describes violence against women as a “global public health problem of epidemic proportions.” For a detailed discussion of these costs and the urgency of this problem, please visit http://www.who.int/mediacentre/news/releases/2013/violence_against_women_20130620/en/. In the United States, the direct costs of domestic violence exceeded an estimated $3.6 trillion (2014 U.S. dollars) (Florence et al., 2018).8This estimate includes medical services ($2.1 trillion), lost work productivity ($1.3 trillion) and criminal justice ($73 billion), among other costs. This figure represents a lower bound because costs to employers and insurance companies are not included, and neither are reduced tax revenue and lost work productivity. In addition to the effects on women, this problem also negatively impacts their children, who are mainly U.S. citizens (Migration Policy Institute, 2019).9https://www.unicef.org/media/files/BehindClosedDoors.pdf,10Twenty-six percent of U.S. children live in immigrant families. Learning how the reporting of domestic violence is affected by immigration policy could help us avoid present, as well as long-term or future costs. Second, a growing share of the U.S. population might be impacted by the changing immigration policy. Approximately 21 million female immigrants reside in the United States, making up over 13 percent of the nation’s female population.1111 See: https://statusofwomendata.org/immigrant-women/ The share of married couples with at least one non-citizen partner has been rising (see Figure 1) over the last 20 years. Hence, gaining a better understanding of how immigrant victims respond to domestic violence in the new immigration policy environment is key in the design of any criminal justice response.
People are more likely to report a crime when they trust the police (Kwak, Dierenfeldt, and McNee- ley, 2019). By limiting the cooperation of the local police with Immigration and Customs Enforcement (ICE), sanctuary policies may alter immigrant women’s trust in the police and, thereby, facilitate their reporting of ongoing domestic violence. To gauge if this is the case, we gather state-level VAWA self-petitions data through a Freedom of Information Act request and merge it with data on sanctuary policies. We then exploit the temporal and geographic variation in the adoption of sanctuary policies using a difference-in-differences approach to identify their impact on domestic violence reporting among immigrants, as captured by the filing of VAWA self-petitions. We find that sanctuary policies boost the VAWA self-petition rate by roughly 2 percent. The impact, which proves robust to several identification and robustness checks, appears to be driven by victims’ increased willingness to report cases and leave their abusers.
To our knowledge, this is the first study examining how sanctuary policies might affect the reporting of domestic violence by immigrants, as captured by their VAWA self-petitions. As such, it contributes to a growing literature that has analyzed the factors and policies affecting domestic violence. Studies have shown that economic independence, bargaining power, arrest laws and police demography all have an effect on domestic violence (see, for example, Aizer, 2010; Stevenson and Wolfers, 2006; Iyengar, 2009; Miller and Segal, 2019). Yet, we lack evidence on how the more recent sanctuary policies are affecting the reporting of domestic violence by immigrants. Understanding the role played by sanctuary policies is crucial given the high economic and social cost of domestic violence, the heightened level of interior immigration enforcement over the past decades, and the administration’s decision to no longer consider domestic violence as proper grounds for protection from deportation.
2. Institutional Background and Conceptual Framework
2.1 Domestic Violence Among Immigrants
Domestic violence has a high prevalence in the United States, especially among women (Bureau of Justice Statistics, 2018). One in four women, as opposed to one in nine men, experience some type of domestic violence during their lifetimes.12See: https://ncadv.org/statistics The same holds true among minority women (Breidling et al., 2014), which is not completely unexpected. In the case of foreign-born women, the situation might be exacerbated by their immigration status as well as cultural and language barriers. Immigrant women are more likely to experience social isolation. In addition to having cultural differences, they often have left their family and friends behind in their home countries (Kasturirangan, Krishnan, and Riger, 2004). They are also more likely than native women to be economically dependent on their husbands, as they frequently lack work eligibility. Finally, immigrant women often depend on their husbands to adjust their immigration status. According to the Immigration and Nationality Act (INA) provisions, foreign spouses of U.S. citizens and lawful permanent residents (LPRs) can be sponsored by their spouses if they are living together. This requirement tends to discourage immigrant spouses from leaving abusive marriages and, instead, appears to reinforce the prevalence of domestic violence. In this regard, Raj et al. (2005) show how the odds of intimate partner violence reporting are higher for immigrant women who had spousal dependent visas, or whose partners either refused to change their immigration status or threatened them with deportation, when compared to other immigrant women.13 While both men and women can be the victims of domestic violence, women are more likely to be the victims (Nelson, Bougatsos, and Blazina, 2012). Other key demographic traits include age, minority and immigrant status (Breidling et al., 2014). According to prior studies, 48 percent of Latinas report that their partner’s violence against them increased after they immigrated to the United States. Similarly, a survey of immigrant Korean women to the United States found that 60 percent had been battered by their husbands (Tjaden and Thoennes, 2000). This situation could be exacerbated when immigrant women have U.S. born children—because they may fear losing custody of the children in a legal confrontation. All these factors contribute to the higher risk of domestic violence endured by immigrant women when compared to the general population (Family Violence Prevention Fund, 2007).
To address this problem, the 103rd Congress included three provisions related to abused women in the Violence Against Women Act (VAWA) of 1994:14VAWA is Title IV of the Violent Crime Control and Law Enforcement Act of 1994, P.L. 103-322. The Violence against Women Act (VAWA) of 1994 and its subsequent reauthorizations in 2000 and 2005 authorized funding related to domestic violence for enforcement efforts, research and data collection, prevention programs, and services for victims. (1) self-petitioning by abused spouse and children, (2) suspension of deportation, and (3) cancelation of removal. The House Judiciary Committee explained that “the purpose of permitting self-petitioning is to prevent the citizen or resident from using the petitioning process as a means to control or abuse an alien spouse.”15U.S. Congress. House Committee on the Judiciary. Violence Against Women Act of 1993, report to accompany H.R. 1133, 103rd Cong., 1st Sess., H. Rept. 103-395, p. 37. The 1994 VAWA was the first federal law addressing domestic violence crimes in mixed-status marriages. This has been critical given the increase in this type of marriages. As shown in Figure 1, the share of marriages between a citizen and a non-citizen grew from slightly over 7 percent in 2001 to more than 10 percent in 2016.
Under the new legislation, battered immigrant spouses and children can gain lawful permanent residency (i.e., apply for a “green card”) independent of their batterers. Specifically, immigrant spouses can self-petition for their status adjustment if they can prove the following:
1. The abuser is a U.S. citizen or has lawful permanent resident status,16VAWA I § 40701(a)(1)(C)(iii).
2. The petitioner resides in the United States with the spouse,17VAWA I §§ 40701(a)(1)(C)(iii), 40701(a)(2)(B)(ii).
3. The petitioner entered marriage “in good faith,”18VAWA I § 40701(a)(1)(C)(iii)(1).
4. The petitioner’s deportation would result in “extreme hardship” to either her/himself or to her/his children,19VAWA I § 40701(a)(1)(C)(iv)(II).
5. The petitioner is a person of “good moral character,”20VAWA I § 40701(a)(1)(C)(iii). and
6. The petitioner and/or a child are or have been the subject of domestic violence or extreme cruelty perpetrated by the spouse during the marriage.21VAWA I § 40701(a)(1)(C)(iii)(I).
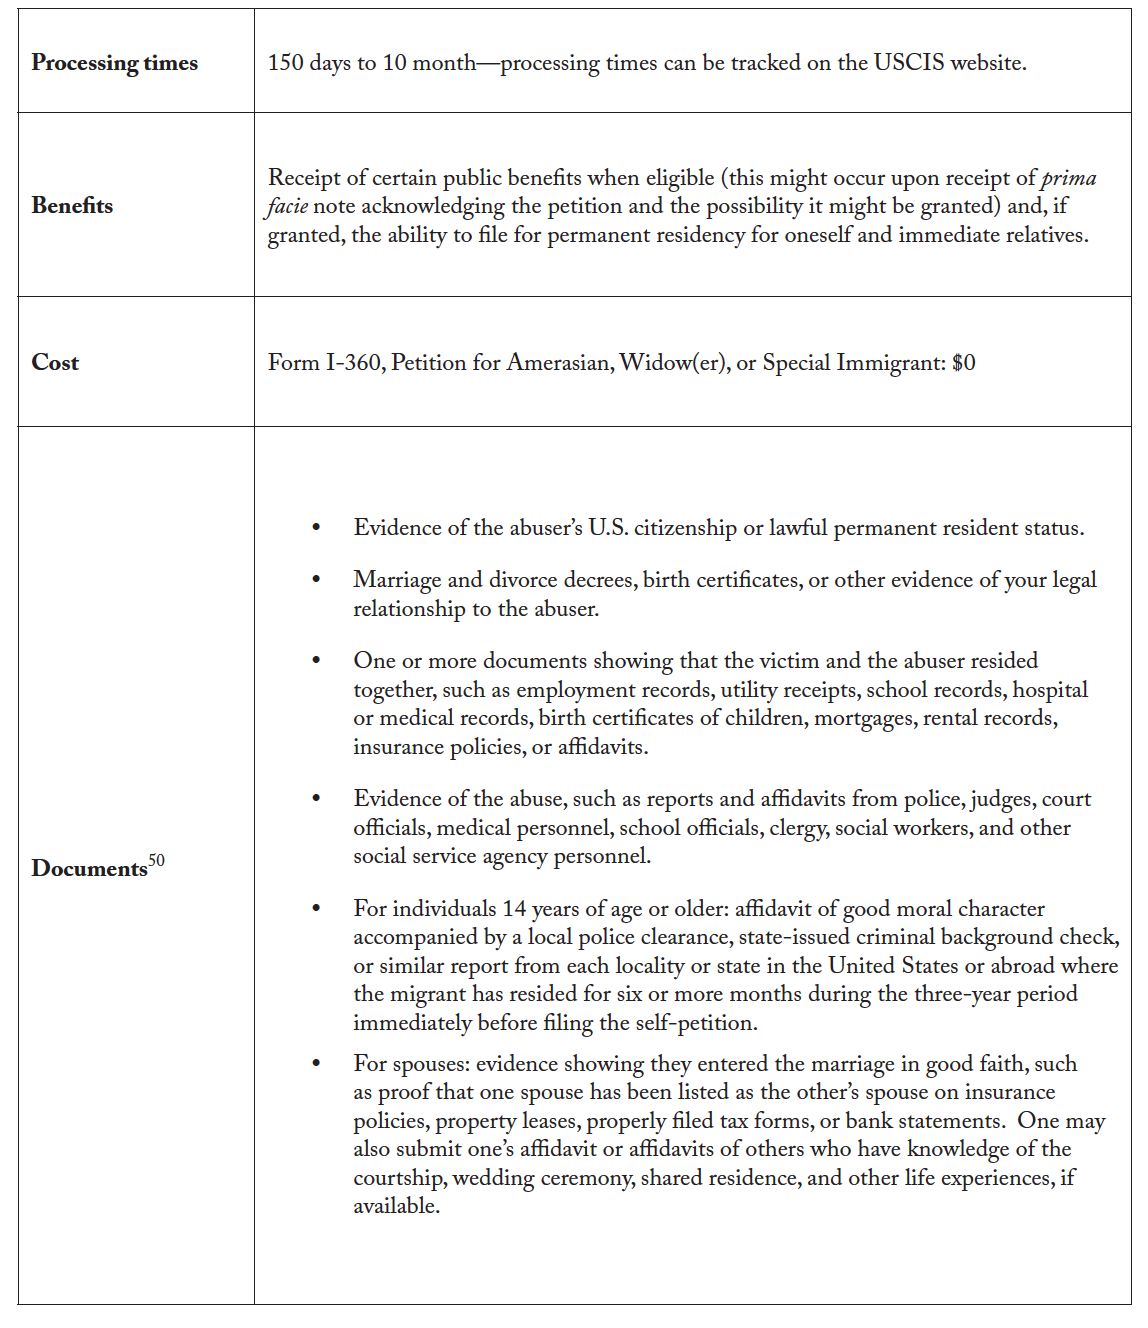
There are two steps to applying for a green card (or self-petition to adjust one’s immigration status) without the support of an abusive spouse under VAWA. First, one has to file Form I-360, along with the supporting evidence included in Table B1 in Appendix B, to the U.S. Citizenship and Immigration Services (USCIS). After USCIS receives the I-360 petition, it acknowledges receipt and starts to review the application. If USCIS believes the petition will be granted with the information provided, it will send a “Prima Facie Approval” letter. While no status adjustment has taken place yet, the migrant can use that letter to qualify for some types of public assistance. Once USCIS approves the I-360, the migrant can take the second step—namely, to apply for status adjustment (i.e., green card or lawful permanent residency) using Form I-485 and supporting documents.22If married to a U.S. citizen, both steps can be done concurrently. ,23The approval rate has remained constant since 1997 The overall processing time (until a final decision has been reached) usually takes anywhere between 150 days and 10 months.
2.2 The Link between VAWA Self-Petitions and Sanctuary Policies
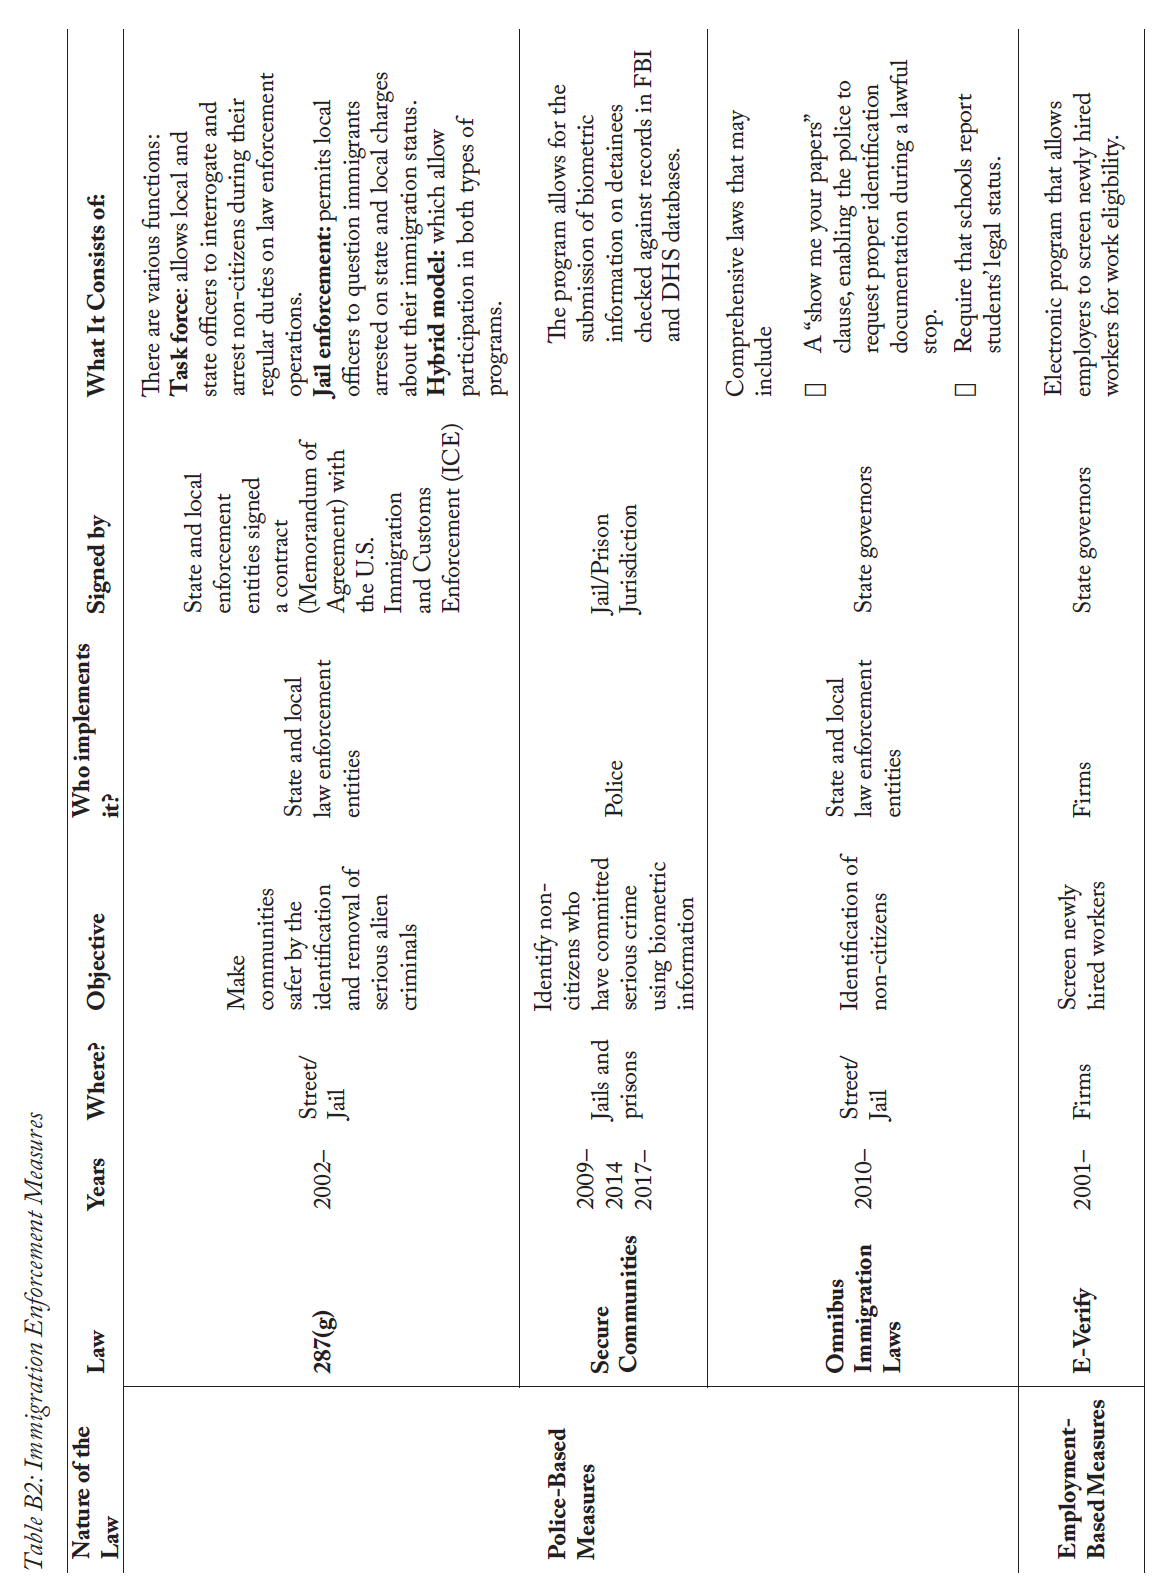
Following the 9/11 terrorist attacks, the United States embarked on an impressive buildup of interior immigration enforcement. Between 2003 and 2013, funding for Immigration and Customs Enforcement (ICE)—the federal agency responsible for interior immigration enforcement—rose by 80 percent, the number of apprehensions more than doubled, and the number of interior removals increased three-fold.24U.S. Department of Homeland Security, Budget in Brief, fiscal years 2003–2013 (http://www.dhs.gov/dhs-budget). Data on apprehensions can be found at http://www.dhs.gov/yearbook-immigration-statistics-2013-enforcement-actions, Table 33. Data on interior removals can be found in http://www.migrationpolicy.org/research/deportation-and-discretion-reviewing-record-and-options-change. Importantly, the growth in deportations largely relied on the collaboration between ICE and the local/ state police through a number of immigration enforcement initiatives (Nguyen and Gill, 2015),25Starting in 2002, state and local law enforcement agencies started to partner with the federal government under joint Memoranda of Agreement that deputized officers for them to exercise immigration enforcement within their jurisdictions—the so-called 287(g) agreements between local enforcement agencies and Immigration and Customs Enforcement (ICE). Between 2006 and 2010, the budget for 287(g) agreements increased from $5 million to $68 million, with the number of participating officers rising to over 1,500 (Nguyen and Gill, 2015). Several interior immigration enforcement initiatives followed soon after—see Table B2 of Appendix B. Altogether, the various programs were responsible for 1.8 million deportations from 2009 to 2013 alone (Vaughan, 2013). as well as on the use and observance of ICE detainers or “holds.”
By issuing a detainer, ICE requests the local jail to detain the arrestee for 48 hours beyond her/his lawful release date (excluding weekends and holidays). This additional time allows ICE to obtain more information about the arrested migrant, and to arrange a transfer of custody to begin removal proceedings if deemed appropriate. Many jurisdictions have complained about the lack of community cooperation with the police due to the increased police involvement in immigration enforcement (Khashu, 2009). Police testimony, anecdotal reports, and empirical research seem to provide support for this concern, with allegations that immigration enforcement raises fear and mistrust of the police, negatively impacting immigrant crime reporting (Abrego, 2011; Burnett, 2017; Muchow and Amuedo-Dorantes, 2020; Nguyen and Gill, 2016; Vidales et al., 2009; Vishnuvajjala, 2012). Specifically, police departments in jurisdictions with sizeable immigrant communities grew concerned that their involvement with ICE could jeopardize decades of advances in community policing, reducing residents’ willingness to contact the police, report crimes, or assist in police investigations (Magnus, 2017; Burnett, 2017). For instance, in cities like Los Angeles, which is home to 1.5 million immigrants, the Los Angeles Police Department stressed the damage that compliance with many of ICE’s requests had on Latinos’ willingness to engage with the police (Gorman, 2017).26 This claim has been confirmed empirically. Using data on calls for service dispatched to LAPD patrols from 2014 through 2017, Muchow and Amuedo-Dorantes (2020) assess if heightened awareness of immigration enforcement, as captured by a novel Google Trends index on related searches, is associated with reduced calls to report domestic violence in predominately Latino non-citizen neighborhoods. The study finds that domestic violence calls per capita dropped in LAPD reporting districts with a higher concentration of Latino non-citizens as awareness about immigration enforcement increased. As such, some localities have resisted fully cooperating with ICE, enacting laws (as in the case of Trust Acts27When a Trust Act, or state-wide sanctuary policy, is enacted, the local police cannot comply with immigration detainers or warrants not issued by a judge. The local police are also not supposed to stop, search, or arrest anyone based on their immigration or citizenship status. For instance, California Senate Bill 54 effectively makes California a “sanctuary state” by legalizing and standardizing state-wide non-cooperation policies between California law enforcement agencies and federal immigration authorities (https://leginfo.legislature.ca.gov/faces/billNavClient.xhtml?bill_id=201720180SB54).) as well as ordinances, resolutions, and/or regulations aimed at limiting the observance of ICE’s hold requests in order to ensure community trust and cooperation with the police. These policies became known as “sanctuary policies.”
At this juncture, it is worth noting that sanctuary policies and interior immigration enforcement are distinct policies that do not overturn or cancel each other. Interior immigration enforcement policies are focused on the identification and apprehension of undocumented immigrants, whereas sanctuary policies focus on the follow-up detention process at local jails. For example, local law enforcement may arrest an individual following a traffic violation. Under the auspices of a 287(g) agreement, the police might gather information about the immigration status of the detainee or, once at the local jail, gather her/his fingerprints. Under the auspices of the Secure Communities program, the registered information is checked against a database shared by the Department of Homeland Security and the Federal Bureau of Investigation to assess if the individual has any prior criminal records, as well as her/his immigration status.
The functionality of the 287(g) agreement and the Secure Communities program end at that point. In contrast, the role of sanctuary policies starts right after. In the absence of a sanctuary policy, if it is found that the detained individual is not legally in the United States, ICE will be automatically made aware of it, and the agency may issue a detainer or “hold” request. If there is a sanctuary policy in place, the local jail might choose not to observe ICE’s detainer request nor notify ICE of when the detainee is released. Because sanctuary policies come into play after the apprehension and detention of the individual by law enforcement—interior immigration enforcement policies and sanctuary policies can and, most often, co-exist.28For example, California is covered by the Secure Communities Program and has a Trust Act. In contrast, Arizona, also covered by Secure Communities, does not have a Trust Act. Accounting for the level of immigration enforcement (as a proxy for the existing immigration climate) is important when gauging responsiveness to sanctuary policies. However, our goal is to assess if sanctuary policies increase VAWA self-petitions filed by immigrant victims of domestic violence either by facilitating the reporting of domestic abuse by immigrant victims to the police, and/or by altering the abusive behavior of their offenders.
2.3 Conceptual Framework and Testable Hypotheses
Immigrants’ VAWA self-petitions will inevitably hinge on victims’ valuation of the costs and benefits associated with filing Form I-360, which will depend on how offenders respond to immigration policies in the first place. Sanctuary policies could either bolster or curtail the VAWA self-petition rate. We envision two different scenarios.
On one hand, migrant victims may feel more comfortable coming forward to the police or to other public agencies obliged to inform the police about domestic violence complaints. In that case, underreporting is likely to be somewhat tempered, and sanctuary policies might result in more VAWA self-petitions. On the other hand, potential offenders, aware of their victims’ increased willingness to come forward, might be more reticent to commit any abuse for fear the crime might be reported to the authorities. The decreased incidence of domestic violence might result in a negative coefficient on sanctuary policies.
In sum, whether sanctuary policies increase (via increased reporting by victims) or decrease (via reduced incidence of domestic violence) VAWA self-petitions remains an empirical question.
3. Data
Our aim is to learn about the impact that sanctuary policies might be having on immigrants’ VAWA self-petitions. To that end, we combine data on VAWA self-petitions over the 2000–2016 period with data on sanctuary policies. Data on VAWA self-petitions were obtained from the United States Citizenship and Immigration Services (USCIS) through a Freedom of Information Act (FOIA) request. For confidentiality reasons, the data are only made available at the state level and on a yearly basis. On average, as shown in Table 1, annual VAWA self-petitions at the state level averaged 36 per 100,000 non-citizens over the period under consideration.
We also gather data on the enactment of state-wide Trust Acts and on the adoption of sanctuary policies at the county level. A non-negligible number of cities, counties, and states have either adopted formal laws limiting the cooperation of their law enforcement with ICE through the enactment of Trust Acts29For instance, California Senate Bill 54 effectively makes California a “sanctuary state” by legalizing and standardizing state-wide non-cooperation policies between California law enforcement agencies and federal immigration authorities. See https://www.fairus.org/legislation/state-local-legislation/california-sanctuary-state-bill-sb-54-summary-and-history. or, alternatively, through ordinances, resolutions, or regulations by which they choose whether to ob- serve an ICE detainer and inform ICE of the release of an arrestee.30An ICE detainer—or “immigration hold”—is one of the tools used by ICE to apprehend individuals who encounter local and state law enforcement. It is a written request that a local jail or other law enforcement agency detain an individual for an additional 48 hours (excluding weekends and holidays) after his or her release date in order to provide ICE agents extra time to decide whether to take the individual into federal custody for removal purposes Sanctuary policies, most of which flourished following the implementation of the Secure Communities Program, were aimed at increasing community trust and cooperation with the police, particularly in immigrant communities.31Data on sanctuary policies is publicly available at https://cis.org/Map-Sanctuary-Cities-Countikes-an1d-State1s
We combine information on state- and county-level sanctuary policies into an index to better gauge their overall impact. To that end, we first construct individual indexes for state-wide and for county-level sanctuary policies. Each index  takes into account (1) the number of months during which sanctuary policy
  was in place in year
  , as well as (2) the share of the state’s population affected by the policy when it is not a state-wide policy. Specifically, for each initiative (i.e., state-wide or county-level policy), we construct the following index:
(1) 
where = 2. The term  indicates if county
  had a sanctuary policy in place in month
  . We use this information to learn the fraction of year during which the policy was in place. In addition, to construct a population weighted index, we use information on the population of the county
  and that of the state
  in the 2000 Census—that is, prior to the adoption of most sanctuary policies.
Next, we construct an overall proxy for the level of sanctuary offered by state  in year equal to the sum of the two state-wide and county-level sanctuary policy indexes, that is
(2) 
Figure 2 shows the temporal and geographic variation in the sanctuary policy index, which ranges from 0 to 1.6. It takes the value of 0 when the state has not adopted a state-wide Trust Act, plus no county in the state has enacted a local sanctuary policy. It takes the value of 1.6 when the state has a state-wide Trust Act, and 60 percent of its population is covered by a county-level sanctuary policy in that year.
Finally, we include information on other state-level traits potentially affecting the filing of VAWA self-reports. First, we gather and merge data on several interior immigration enforcement initiatives rolled out during the period under examination and detailed in Table B2 of Appendix B. Accounting for the enforcement climate to which immigrants might be exposed is important, as it could affect their response to sanctuary policies. To that end, we also create an index—namely, IEs,t. The index is constructed similarly to our main sanctuary policy variable.32Specifically, we first derive a population-weighted index for each enforcement initiative  , where
  ) is an indicator function that informs about the implementation of a particular policy in county during month in year . The index
  takes into account: (1) the number of months during which policy was in place in year , as well as (2) the size of the state’s population affected by its implementation. Next, we construct an index indicative of the overall enforcement to which immigrants living in state and year are exposed. That index is computed as the sum of the indexes for each enforcement initiative at the (state, year) level:
  . Aside from capturing the intensity of the enforcement climate in the state, the index provides a couple of important advantages. It addresses the distinct geographic coverage of the various measures (some at the county level, others at the state level) through the construction of a population weighted measure of immigration enforcement, while accounting for the number of months each measure was in place in that particular year. In addition, the index captures the correlation among various immigration enforcement initiatives, while providing a more convenient and comprehensive way of signaling the immigration enforcement climate.
Second, we include information on each state’s population composition in terms of gender, race, and ethnicity, as well as on its economic conditions using data gathered from the corresponding years (2000 through 2016) in the American Community Survey (see Table B3 in Appendix B for more detail). Specifically, we account for the ratio of female to male wages,33Following Aizer (2010), we construct the ratio of female to male wages. This measure overcomes the endogeneity of individual wages and accounts for the theoretical prediction that potential, not actual, wages affect domestic violence. The ratio is informative of the exogenous demand for female and male labor, and it is based on the index of labor demand originally proposed by Bartik, (1991). Exploiting the history of sex and race segregation by industry, we construct measures of local labor market wages of women (men) that are based on wage changes in industries dominated by women (men). Hence, average annual wages are calculated as follows:  , where
  is the share of female (or male) workers with no more than a high school diploma of a given race working in industry
  in county . The vector:
  is the annual wage in industry in the state, excluding county in year . It is gathered from the Bureau of Economic Analysis annual survey of employers. the annual unemployment rate, and the natural log of per capita income in a state and year. Additionally, we include information on homicides, other than domestic ones, to address secular trends in violent crime (see, for example, Aizer, 2010) using data gathered from the Unified Crime Reports.34 Table B3 in Appendix B defines each variable and indicates its source. We also include the share of female officers in each state and year to address the unique role played by female officers in the fight and prevention of domestic violence (Miller and Segal, 2019). Finally, we also include a control for the share of households in each state with internet access as one of the main methods to gather information about news, developments, and policies nowadays.
4. Methodology
To learn about the impact of sanctuary policies on the rate of VAWA self-petitions, we exploit the tempo- ral and geographic variation in the adoption of the policy:
(3) 
where  is our outcome variable—namely, a share capturing the number of VAWA self-petitions per 100,000 non-citizen population in state and year . The vector
  represents our sanctuary policy index, as described in equation (2).
In addition to our key controls, equation (3) includes a vector of state-level time-varying characteristics (i.e.  ) known to influence domestic violence, including the intensity of immigration enforcement in the state, as well as population composition, economic, crime, and law enforcement controls shown to be correlated with crime. Specifically, the vector includes the share of Hispanics, blacks, and Asians, as well as the natural log of women aged 15 to 44 in the state each year. Economic conditions and opportunities available in the state are captured by the ratio of female to male wages, the annual unemployment rate, and the natural log of per capita income detailed earlier. To account for secular crime trends and the presence of female law enforcement potentially easing the reporting of domestic violence by female victims, we include information on the natural log of homicides (other than domestic ones) and the share of female officers in each state and year. Finally, we also account for the share of households with internet access, giv- en today’s reliance on the web as a means of accessing news and, in turn, learn about any policy changes.
Aside from the abovementioned time-varying state-level controls, equation (3) includes a series of state and year fixed effects, as well as state-specific linear trends. Combined, they help capture a variety of statewide policy changes, such as welfare reform, expansions in the Earned Income Tax Credit (EITC), changes in Medicaid eligibility, or state laws potentially correlated to domestic violence rates but not included in , as well as linear trends in domestic violence in any given state. Observations are weighted by the non-citizen population in the (state, year) cell, and standard errors are clustered at the state level.35These results prove robust to using the foreign-born population in the (state, year) as an alternative weight.
Our interest is in the estimated coefficient, β1, which captures the impact of sanctuary policies on the VAWA self-petition rate. As hypothesized in Section 2.3, β1>0 would indicate that migrant victims are more willing to report domestic violence and self-petition to adjust their status when sanctuary policies ameliorate their perception of how helpful the authorities will prove in addressing their complaints. In contrast, β1<0 would indicate that offenders fear to perpetrate further attacks on their victims, because the offenders are aware of the victims’ increased willingness to report.
5. Sanctuary Policies and VAWA Self-Petitions
5.1 Main Findings
Results from estimating three model specifications of equation (3) are shown in Table 2. We start with a baseline model that exclusively focuses on sanctuary policies. Subsequently, we include information on a series of demographic, economic, and crime/enforcement state-level controls in specification (2). This allows us to better gauge the impact of any potentially endogenous regressors. Finally, in specification (3), we include information on the share of households with internet access as an additional control for information accessibility. All model specifications include state and year fixed effects, as well as state-specific time trends to account for any unobserved state-level time-varying traits not accounted for in our modeling.
Regardless of the model specification used, the estimated coefficients reveal the important role played by sanctuary policies on VAWA self-petitions. A one standard deviation increase in sanctuary policies boosts the VAWA self-petition rate by 2.24 percent.36Computed as (0.24*3.37/36.05)*100 = 2.24 percent, where 0.24 is the standard deviation of our sanctuary policy index (see Table 1), 3.37 is the estimated coefficient for sanctuary policies in the most complete model specification of Table 2, and 36.05 is the mean of our dependent variable. The fact that sanctuary policies bolster the share of VAWA self-petitions is already suggestive of the mechanism at play. As hypothesized earlier, if potential offenders, aware of their victims’ increased willingness to come forward in the presence of a sanctuary policy, are less likely to offend for fear that victims might report them to the police, we would expect a negative coefficient on sanctuary policies. In contrast, we find that sanctuary policies are associated with an increase in the share of VAWA self-petitions, suggesting that migrant victims might feel more comfortable with coming forward. In other words, by tempering the underreporting of domestic violence, sanctuary policies raise the share of VAWA self-petitions.
The interpretation above is further bolstered by the estimated impact of intensified interior immigration enforcement. A one standard deviation increase in the intensity of immigration enforcement, as captured by our index, is associated with a 10 percent lower VAWA self-petition rate.37Computed as [0.79*(-4.5272)*/36.05]*100 = 9.92 percent, where 0.79 is the standard deviation of our interior immigration enforcement index (see Table 1). The negative coefficient confirms the important role of intensified immigration enforcement in interfering with the reporting of domestic violence to the police by immigrant victims, as documented by prior studies (e.g., Muchow and Amuedo-Dorantes, 2020). In addition, it further underscores the important role of sanctuary policies in making victims more comfortable with coming forward amid an intensified immigration enforcement climate working in the opposite direction. Finally, the results in Table 2 also reveal the role of internet access in facilitating information flow and the filing of petitions, with a 1 percent increase in the share of households with access to internet boosting the share of VAWA self-petitions by 2.16 percent.38Computed as [(0.01*0.62)*125.0835/36.05]*100 = 2.15 percent, where 0.62 is the mean of the share of households with internet (see Table 1).
5.2 Identification Challenges
In this section, we address several identification challenges. To start with, we focus on the one assumption made by most analyses exploiting the temporal and geographic variation in the adoption of policies for identification purposes, i.e., the lack of differential pre-trends in the outcome variable across treated vs. control units. In our case, this assumption requires the adoption timing of sanctuary policies, while non-random, to be uncorrelated with pre-existing differences in VAWA self-petitions trends across treated and control states. As recommended for difference-in-differences analyses with variation in the treatment timing (e.g., de Chaisemartin and D’Haultffuille, 2019; Borusyak and Jaravel, 2017), we conduct an event study. Specifically, we re-estimate equation (3) as follows:39As recommended by the literature, this model does not include unit-specific time trends to avoid biased estimates (e.g., Borusyak and Jaravel, 2017).
(4) ![\begin{equation*} y_{s,t}=\alpha+\Sigma^{-2}_{\tau=-4 \phi \tau}\cdot 1(SP>0)_{s,\tau}+\Sigma^{2}_{\tau=0 \rho \tau} \cdot [1(SP>0)_{s,\tau} \cdot SP_{s,t}]+X'_{s,t}\beta_{2}+\gamma_{s}+\theta_{t}+\varepsilon_{s,t} \end{equation*}](https://www.thecgo.org/wp-content/ql-cache/quicklatex.com-774bcd5312f5f4a00fe5444a5b95f981_l3.svg "Rendered by QuickLaTeX.com")
where the indicator function  represents the τth year before or after the sanctuary policy index first turned positive in the state. We examine the existence of pre-trends up to four years prior, as reflected by the coefficients ρτ (periods that are at least four years before the sanctuary policy index turned positive are used as the base group). The coefficients ρτ measure the dynamics of sanctuary policy effects up to two years after their implementation. They are interacted with to capture intensity impacts.
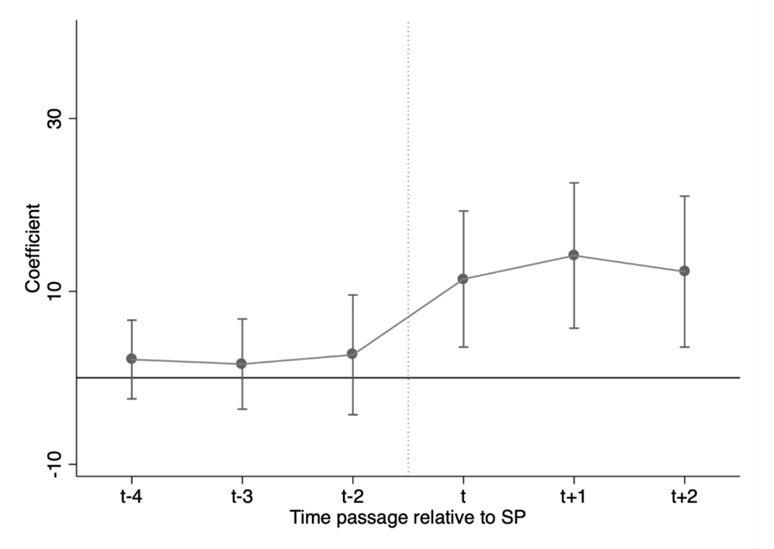
Figure 3A, as well as Panel A in Table 3, display the results from the event study (the dashed lines represent robust 95 percent confidence intervals). There is evidence of a clear break in the trend in VAWA self-petitions surrounding the adoption timing of sanctuary policies. Specifically, the VAWA self-petition rate averaged close to zero during the years preceding the policy implementation; however, they rise immediately after. The estimates corresponding to the year when sanctuary policies are adopted and the year after are statistically significant at the 1 percent level, suggesting a relatively quick policy impact. This is not surprising given the yearly temporal unit of analysis, and the publicity these policies have received in the press.40See, for example https://www.nytimes.com/2012/06/22/opinion/californias-trust-act.html, or https://www.ocregister.com/2016/12/21/being-a-sanctuary-city-what-it-means-what-cities-can-do-and-what-they-cant/. In addition, the effect of sanctuary policies is not short-lived. Rather, the policies still raise the VAWA self-petition rate one and two years after their adoption. Finally, we repeat the event study using an alternative specification in which the post-policy implementation periods are not interacted with the sanctuary policy index. The results, depicted in Figure 3B and included in Panel B of Table 3, prove remarkably robust.
A second identification challenge in policy evaluations refers to the non-random adoption of policies. While no policy is ever adopted randomly, for inference-making purposes, the concern is about the endogeneity of the policy with respect to the outcome itself—namely, the rate of VAWA self-petitions, at a prior date. To assess if this should be a matter of concern in our case, we exploit the information on the adoption timing of sanctuary policies at the county level,41Using county-level measures provides us with more variation in the timing of sanctuary policies, as well as more observations (otherwise, the analysis only has 50 observations, i.e., 1 per state). and estimate the following regression:
(5) 
where  is the year in which the sanctuary policy index first turned positive in a given county . Using county-level data allows us to more accurately assess the extent to which the state’s VAWA self-petition rate might help predict the adoption timing of sanctuary policies. The vector
  is the VAWA self-petition rate for state in the year 2000—that is, prior to the adoption of most sanctuary policies. The vector
  contains information on all other state-level controls in equation (3)—namely, the state’s level of interior immigration enforcement, ratio of female to male wages, unemployment rate, natural log of per capita income, share of Hispanics/blacks/Asians, natural log of women ages 15 to 44, natural log of homicides, share of female officers, and share of households with internet access. The goal with the estimation of equation (5) is to gauge if the state’s VAWA self-petition rate prior to the adoption of sanctuary policies can help us predict the adoption timing of such policies.
The results from this exercise are displayed in Panel A of Table 4. The rate of VAWA self-petitions in the state does not help us predict the adoption of sanctuary policies, as captured by the year when the index first turns positive. As such, while they are non-random, sanctuary policies do not appear to be driven by the state’s VAWA self-petition rate.
Finally, one might be concerned about the results being driven by the selective location of immigrants in certain states. For instance, migrants might have a preference to reside in states potentially seen as more welcoming, such as those with a sanctuary policy in place. Or, if there are fewer deportations in states offering a greater degree of sanctuary, there might be relatively more opportunities for domestic violence involving non-citizen victims and, potentially, more prospects for VAWA self-petitions. Although this is less likely to be an explanation given that most deportations are of men (Rosenblum and Mccabe, 2014), as opposed to women (who are more likely to be victims of domestic violence), we assess the link between the degree of sanctuary offered by the state and its population composition. As can be seen in Panel B of Table 4, we are unable to find any evidence of sanctuary policies playing a significant role in explaining states’ population composition as captured by their share of non-citizens or the share of married couples with a non-citizen partner. As such, there is no empirical evidence supporting the notion that non-citizens selectively locate in states offering a greater degree of sanctuary.
5.3 Robustness Checks
Thus far, we have demonstrated that the adoption of a sanctuary policy raises the share of VAWA self-petitions in the state—a response that fits well with the explanation that these policies might increase trust in the police and reduce underreporting of domestic violence by immigrants. In addition, we have shown that the suggested impact did not predate the adoption of sanctuary policies, with the policy adoption leading to a clear break in the trend of VAWA self-petitions. Moreover, states’ VAWA self-petition rates prior to the adoption of any sanctuary policy do not help predict the implementation timing of sanctuary policies, and there is no evidence of the results being driven by the selective location of non-citizens (whether voluntarily or involuntarily) in specific states. All the above identification checks palliate concerns regarding endogeneity biases affecting our policy estimate. In what follows, we address additional concerns related to how the share of VAWA self-reports is computed and the robustness of the results to changes in how sanctuary policies are measured.
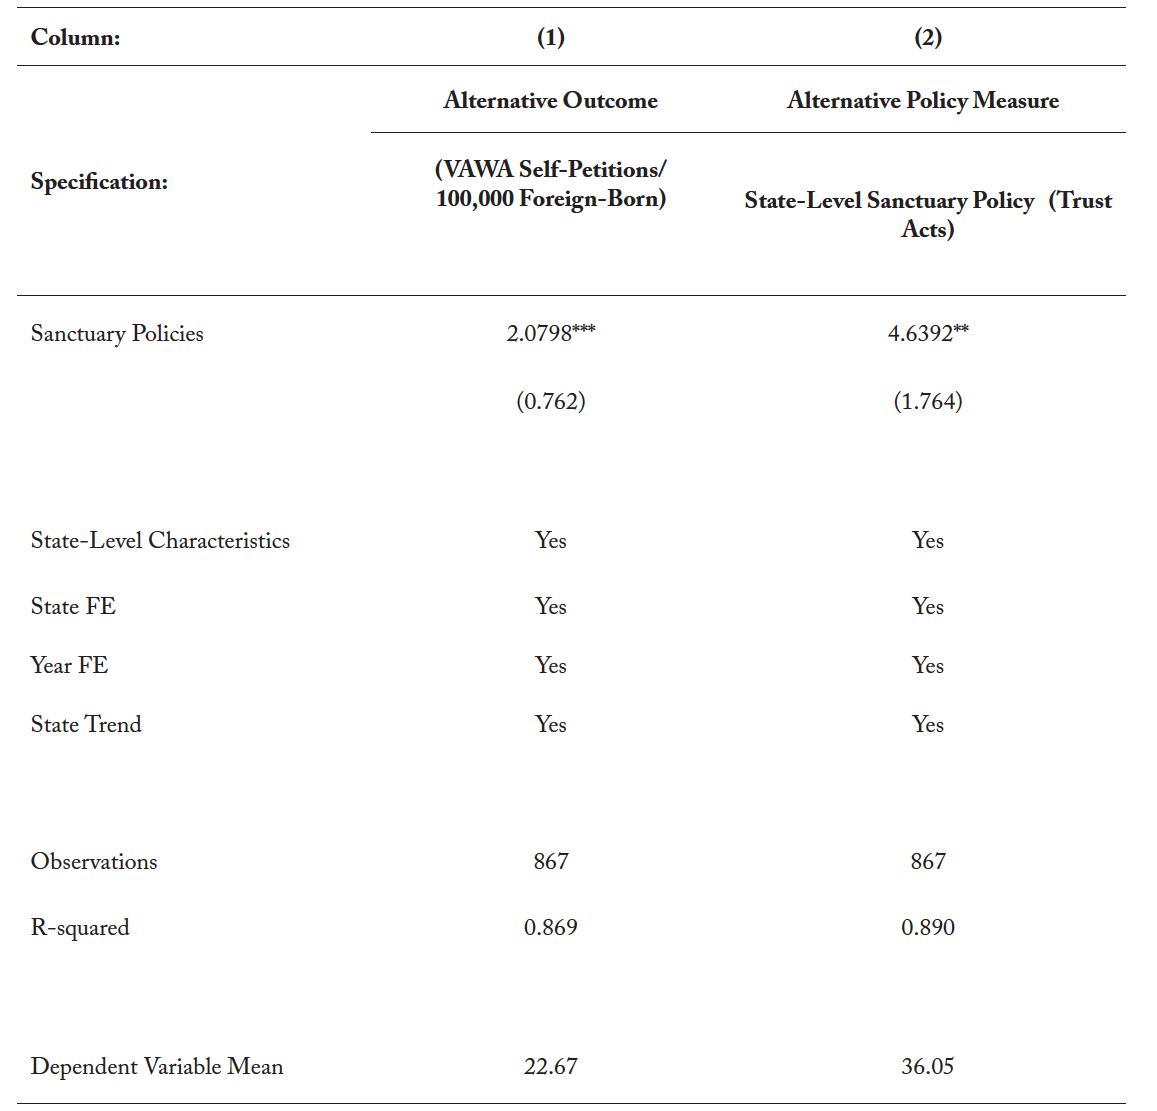
One concern with the results in Table 2 might refer to the measurement of the dependent variable— namely, the share of VAWA self-petitions per 1,000 non-citizens. One might reasonably ask if the results prove robust to redefining the share as a function of the foreign-born population in the state instead. Column (1) in Table 5 displays the results from such an exercise. Sanctuary policies continue to have a similar effect, with a one standard deviation increase in the index raising the new share of VAWA self-petitions by 2.2 percent.
As noted earlier on, not all sanctuary policies have the same geographic scope. In column (2) of Table 5, we experiment with using, instead, a simpler dichotomous variable that equals 1 for the years during the state had a Trust Act in place. We continue to find evidence of sanctuary policies significantly raising the VAWA self-petition rate. Specifically, the adoption of a Trust Act (or statewide sanctuary policy) increases the VAWA self-petition rate by 4.63 percent.
In sum, the results from Table 5 confirm that the impact of sanctuary policies on the VAWA self-petition rate is robust to how the share of VAWA self-petitions is measured, and to the use of a simpler dichotomous indicator of statewide sanctuary policies.
6. Mechanisms
Thus far, our findings are supportive of a robust and positive impact of sanctuary policies on the VAWA self-petition rate. The sign of the estimated coefficient confirms the hypothesized impact of these policies on boosting victims’ willingness to come forward and report domestic violence incidents to the proper authorities. An alternative explanation would be that the incidence, not just the reporting, of domestic violence is rising. Perhaps, abusers increase their violence fearing their victims might try to leave them. In what follows, we try to assess if sanctuary policies might have impacted the incidence of domestic violence experienced by VAWA-eligible individuals.
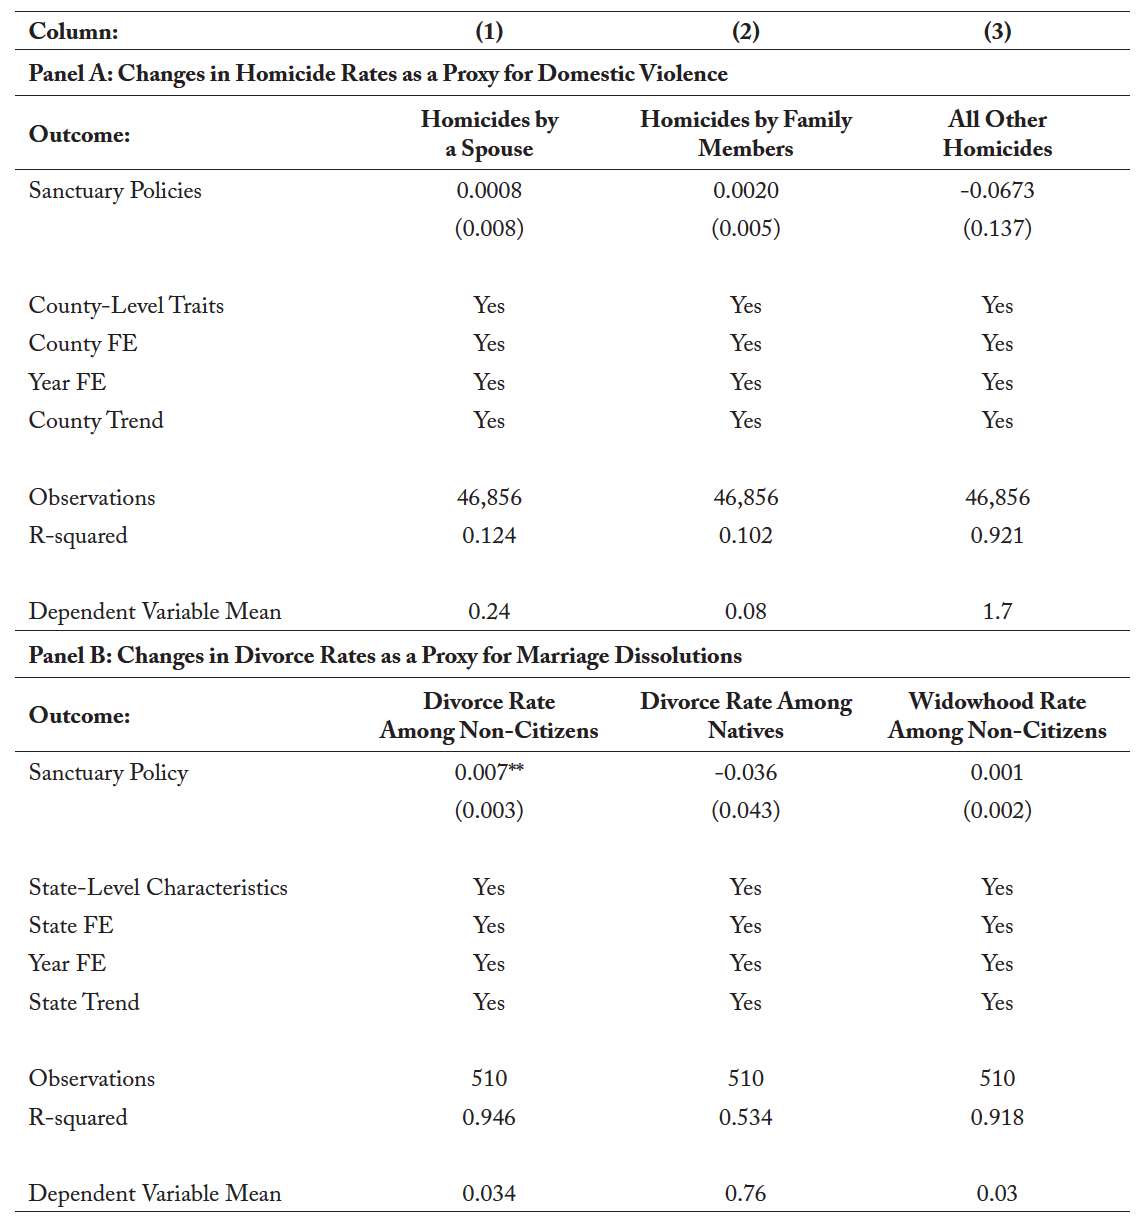
At this point, it is worth noting that, because of the well-known underreporting of domestic violence, even when using emergency room use data (Frieze and Browne 1989; Rhodes et al., 2011),42Only a share of domestic violence victims seek help in emergency room departments (Frieze et al., 1989). Using U.S. data over a four-year period, Rhodes et al. (2011) document that less than 80 percent of female victims of intimate partner violence visit emergency departments, and 72 percent are not identified as victims of abuse. the only way to assess if changes in domestic violence are reflective of changes in reporting, as opposed to changes in victimization, would be to have reliable and representative self-reported data on victimization at the (state, year) level. Unfortunately, such data are not publicly available.43 The National Crime Victimization Survey (NCVS) collects representative data on victimizations. However, the data are not publicly available at the state level. An alternative is to focus on a related type of criminal incident unlikely to suffer from misreporting—namely, domestic homicides. Domestic homicides are typically preceded by prior episodes of domestic violence and, consequently, domestic violence and domestic homicide should be highly correlated.44 Office of Justice Programs National Institute of Justice at https://www.ncjrs.gov/pdffiles1/jr000250.pdf. Therefore, if sanctuary policies were impacting VAWA self-petition rates by increasing the incidence of domestic violence incidents, we would also expect to observe subsequent effect in domestic homicides.45Amuedo-Dorantes and Deza (2020) use a similar approach to examine the impact of sanctuary policies on domestic violence in the United States. Their focus is not on domestic violence endured by immigrants as documented by VAWA self-petitions. Therefore, they do not restrict their attention to VAWA-eligible cases: domestic violence committed by a spouse, parent, or child (as in Table 6, Panel A). Instead, they look at domestic homicides committed by a partner (which includes spouse, common-law spouse, ex-husband, ex-wife, boyfriend and girlfriend), as well as those committed by any family member (including parents, children, step-siblings/parents, in-laws, and other family members). They find evidence of sanctuary policies lowering domestic homicides, although exclusively in the case of Hispanic female homicides, not when other ethnic/gender categories are considered.
To explore if that has been the case, Table 6 displays the results from regressing various measures of domestic, as well as non-domestic, homicide rates on the sanctuary policy index. The analysis relies on county-level data on homicides from the Supplemental Homicide Reports (SHR) within the Uniform Crime Reporting (UCR) Program (U.S. Department of Justice, 2018). Unfortunately, the data does not have information on nativity or citizenship status. Instead, we look at domestic homicide cases that could potentially include VAWA-eligible victims—as a result, one must be cautious when interpreting these findings. In column (1), Panel A, Table 6, we model male and female homicides committed by a spouse. Next, in column (2), we model male and female homicides committed by parents or children, which, like those committed by spouses in column (1), could potentially involve VAWA-eligible victims. Finally, in column (3), we model non-domestic male and female homicides—that is, homicides committed by individuals who are not family members, such as neighbors, friends, acquaintances, or unknown individuals. As such, victims would not be VAWA eligible.
Regardless of the homicide measure used, we fail to find evidence of a statistically significant relationship between sanctuary policies and homicide rates. Specifically, domestic homicide rates related to violence committed by either a spouse, parent, or child—cases that would include the cases qualifying for VAWA self-petition—do not appear to have significantly changed with sanctuary policies. The lack of significant changes in the rate of domestic homicides, which are not likely to suffer from underreporting and are positively correlated with domestic violence incidents, provides further suggestive evidence that the impacts we attribute to sanctuary policies in raising the share of VAWA self-petitions are being driven, not by an increase in domestic violence itself, but rather in its reporting.46Results hold if we conduct the analysis focusing on Hispanic female victims. Note, however, that the data on VAWA self-petitions include those submitted by men and women, as well as all types of immigrants, not only Hispanics or, for that matter, undocumented immigrants. In addition, it is worth noting that not all domestic violence incidents qualify for VAWA self-petitions. Our focus is on those that could potentially qualify for those petitions—namely, those committed by a spouse, parent, or child residing in the household.
Finally, in Panel B in Table 6, we provide further evidence of the reporting mechanism. If sanctuary policies increase the share of VAWA self-petitions by making victims more comfortable coming forward to the police, we would expect an increase in the divorce rate to occur as victims leave abusive relationships. To assess if this has occurred, we use the American Community Survey (ACS) (Ruggles et al., 2019) and compute the divorce rate of non-citizens by state and year from 2008 through 2016.47The variable “divorced in the past year” is available since 2008. As placebo tests, we also construct the divorce rate of U.S. natives, as well as the widowhood rate of non-citizens—none of which should be significantly impacted by sanctuary policies. As we would expect, the estimates indicate that sanctuary policies boost the divorce rate of non-citizens by 5.6 percent.48Computed as (0.27*0.007/0.034)*100 = 5.6 percent, where 0.27 is the standard deviation of our sanctuary policy index between 2007 and 2016, and 0.034 is the dependent variable mean. Yet, we find no such impact on the divorce rate of natives, nor on the widowhood rate of non-citizens. Overall, these results provide further support for the hypothesized channel through which sanctuary policies raise the VAWA self-petition rate—namely, by increasing victims’ willingness to come forward and divorce from their abusers.
7. Summary and Conclusions
In this paper, we identify the impact that sanctuary policies have on domestic violence reporting by immigrants, as captured by the VAWA self-petition rate. Specifically, exploiting the temporal and geographic variation in the adoption of sanctuary policies, we show how the adoption of sanctuary policies raises the rate of VAWA petitions by 2.24 percent. Additionally, we provide suggestive evidence of the channel through which this impact is likely taking place—namely, through victims’ increased willingness to report cases and leave their abusers.
The findings, which prove robust to a number of identification and robustness checks, underscore one of the many unintended consequences of tougher immigration enforcement, as well as the value of safeguards that guarantee immigrants feel safe to come forward when they are victims of crimes. To our knowledge, this is the first study examining how sanctuary policies affect the reporting of domestic violence by migrant victims. Aside from contributing to the literature on the consequences of immigration policy on immigrants and their families (e.g., Amuedo-Dorantes, Arenas-Arroyo, and Sevilla, 2018; Amuedo-Dorantes and Arenas-Arroyo, 2019), the analysis informs scholars and policy-makers about domestic violence survivors’ behavioral responses to public policies. In the same line as Miller and Segal (2019) and Muchow and Amuedo-Dorantes (2020), our results provide further evidence of individuals being more likely to report a crime when they trust the police. Improving the reporting of crimes is key in ensuring safety and criminal justice at a time of growing police mistrust by minorities, and heightened immigrant vulnerability to crime due to migrants’ reluctance to contact law enforcement.
Figures and Tables
Figure 1. Share of Mixed-Citizenship Couples
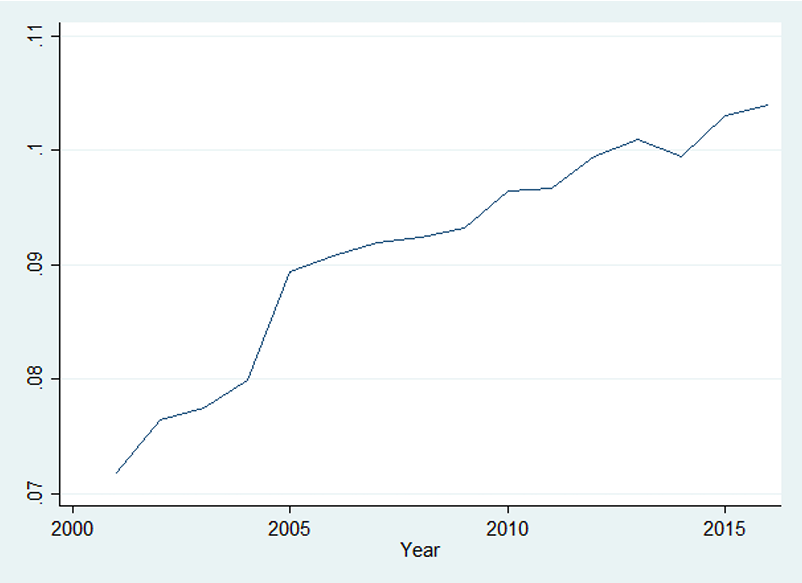
Notes: Share of married couples with at least one non-citizen member per married couple.
Source: Authors’ calculation using ACS data.
Figure 2. Rollout of Sanctuary Policies
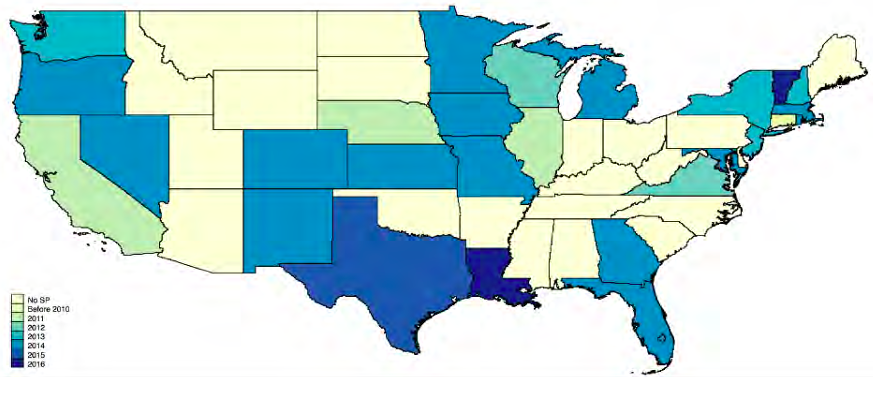
Figure 3A. Event Study Graph for Model Specification (1) in Table 3
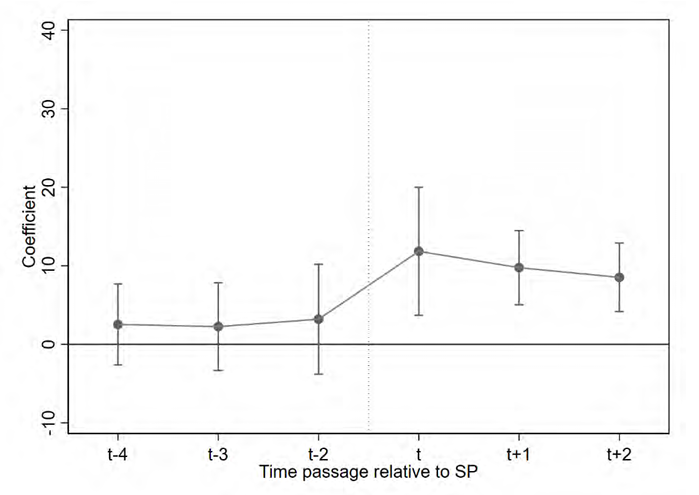
Figure 3B. Event Study Graph for Model Specification (2) in Table 3
Notes: Period represents the year a sanctuary policy was enacted. in the state. Periods prior to  are used as reference, and periods beyond
  are binned into that category since the sample size becomes smaller beyond that point.
Table 1. Descriptive Statistics
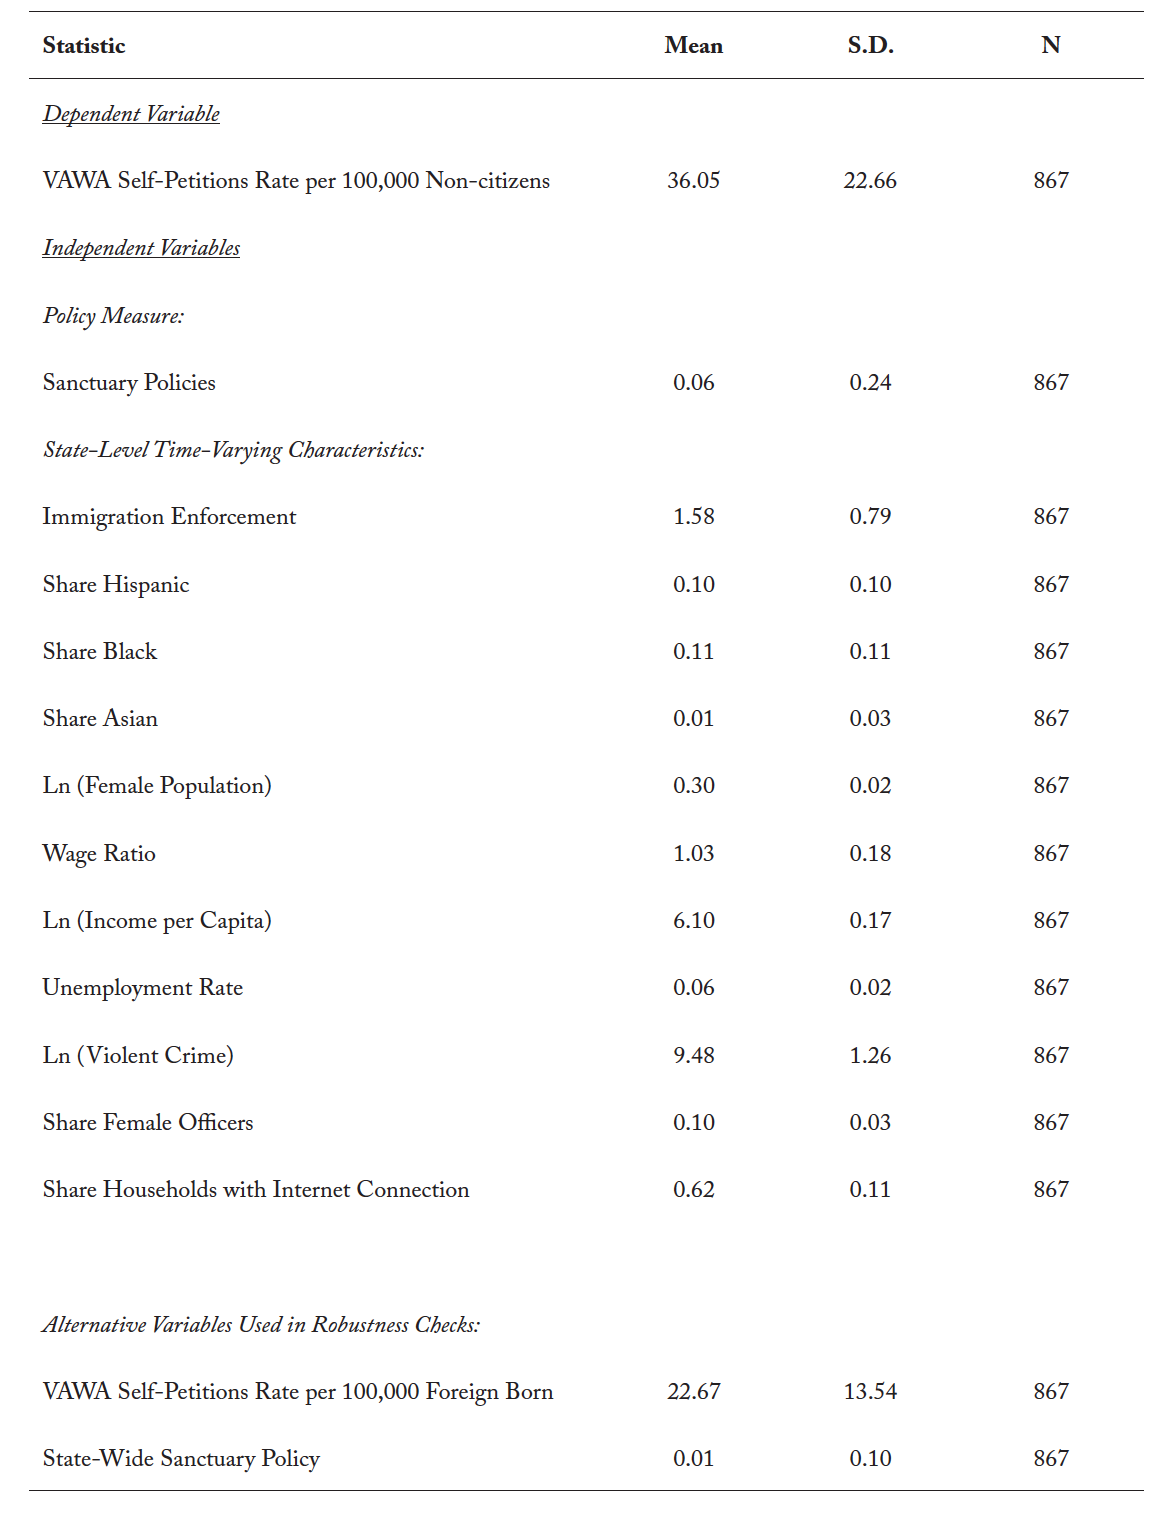
Table 2. The Effect of Sanctuary Policies on VAWA Self-Petitions
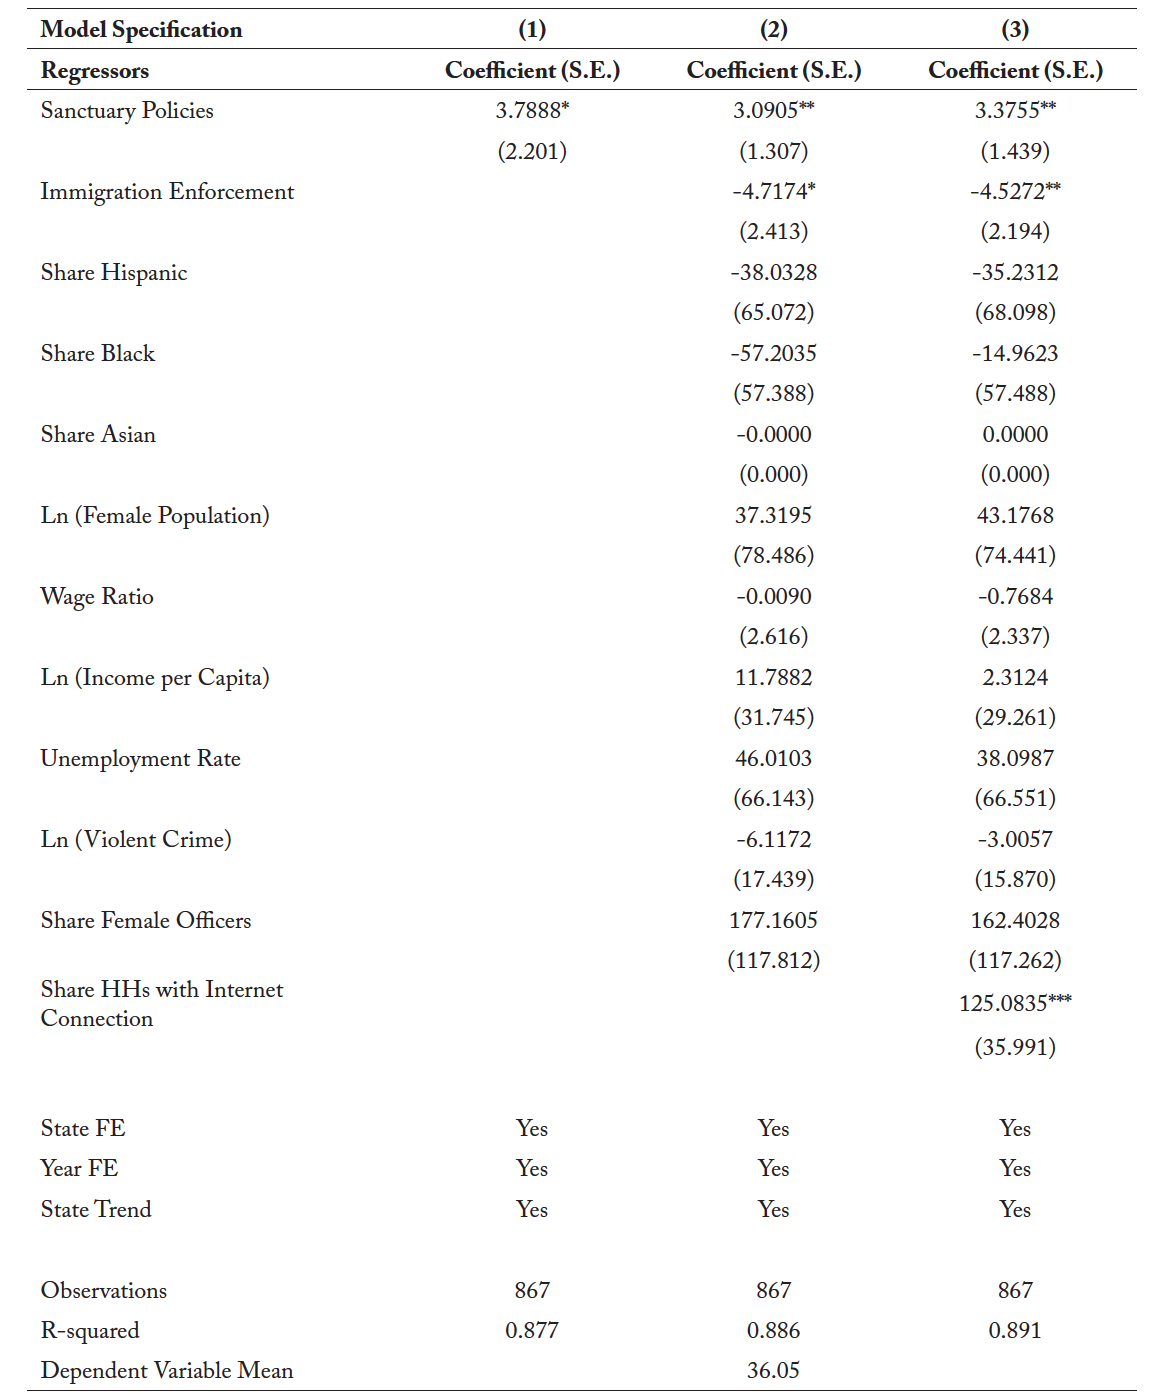
Notes: All regressions include a constant term. Results are weighted by the state’s non-citizen population. Robust standard errors are in parentheses and standard errors are clustered at the state level. ***p<0.01, **p<0.05, *p<0.10.
Table 3. Identification Checks Event Study of the Effect of Sanctuary Policies on VAWA Self-Petitions
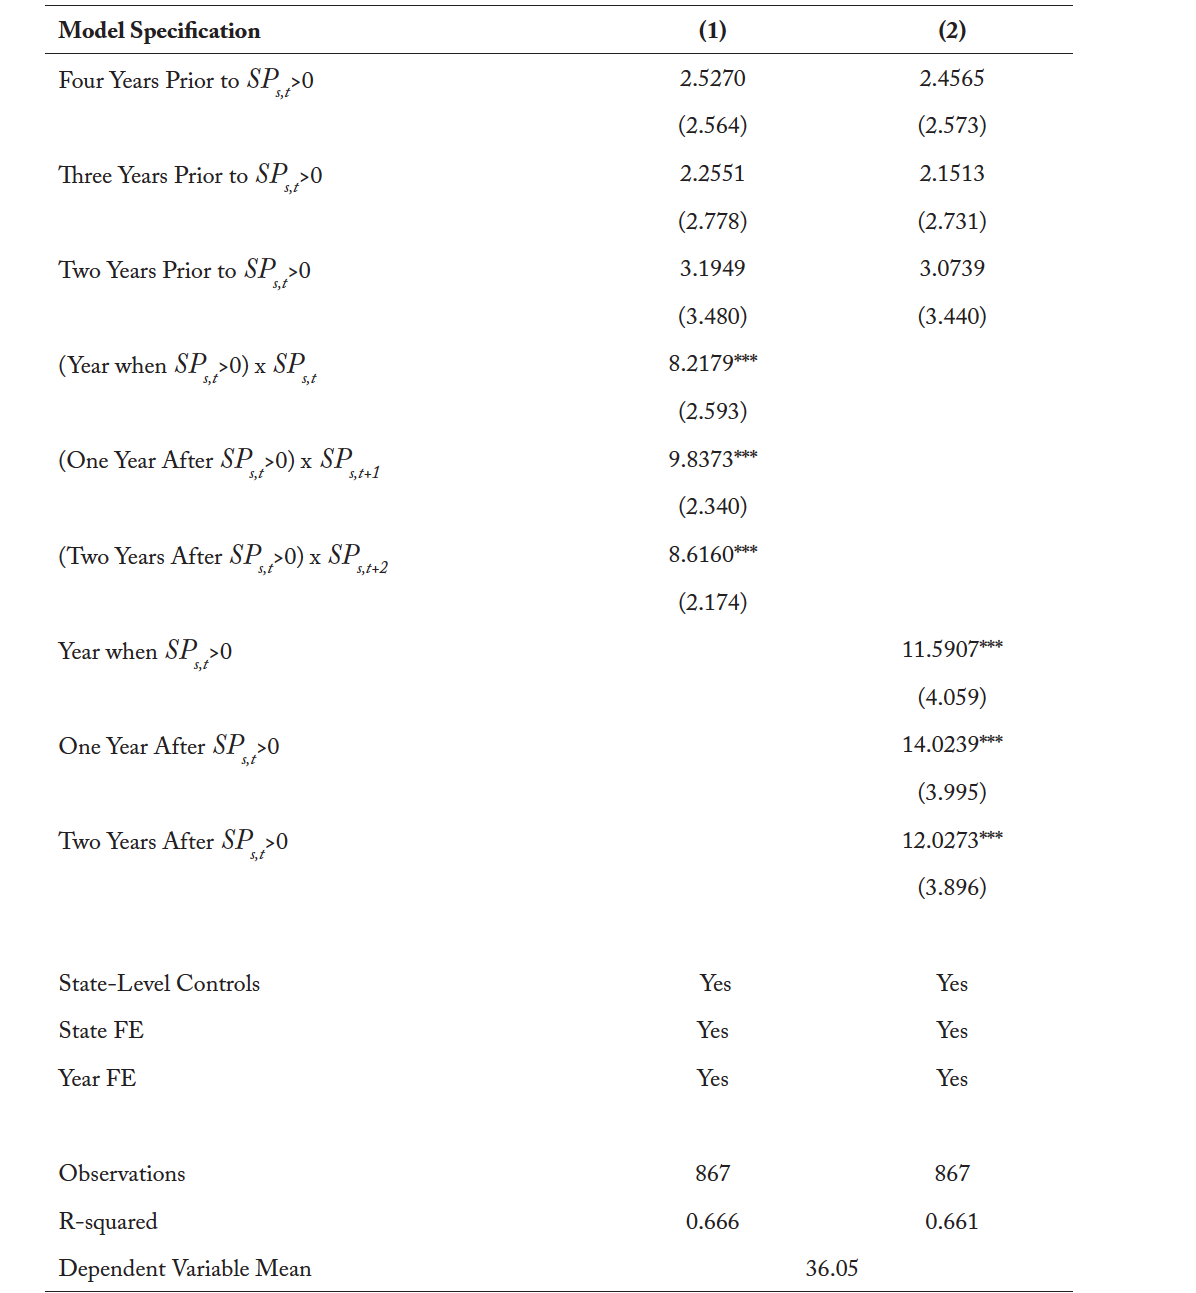
Notes: In Column (1), the years after the enactment of SP are interacted with the SP index (Eq. 4) to capture the intensity effect. Column (2) uses an alternative specification, where the years after the enactment of the sanctuary policies are not interacted with the index. The model includes all controls in the most complete model specification in Table 2. Robust standard errors are in parentheses and clustered at the state level. ***p<0.01, **p<0.05, *p<0.1.
Table 4. Additional Identification Checks
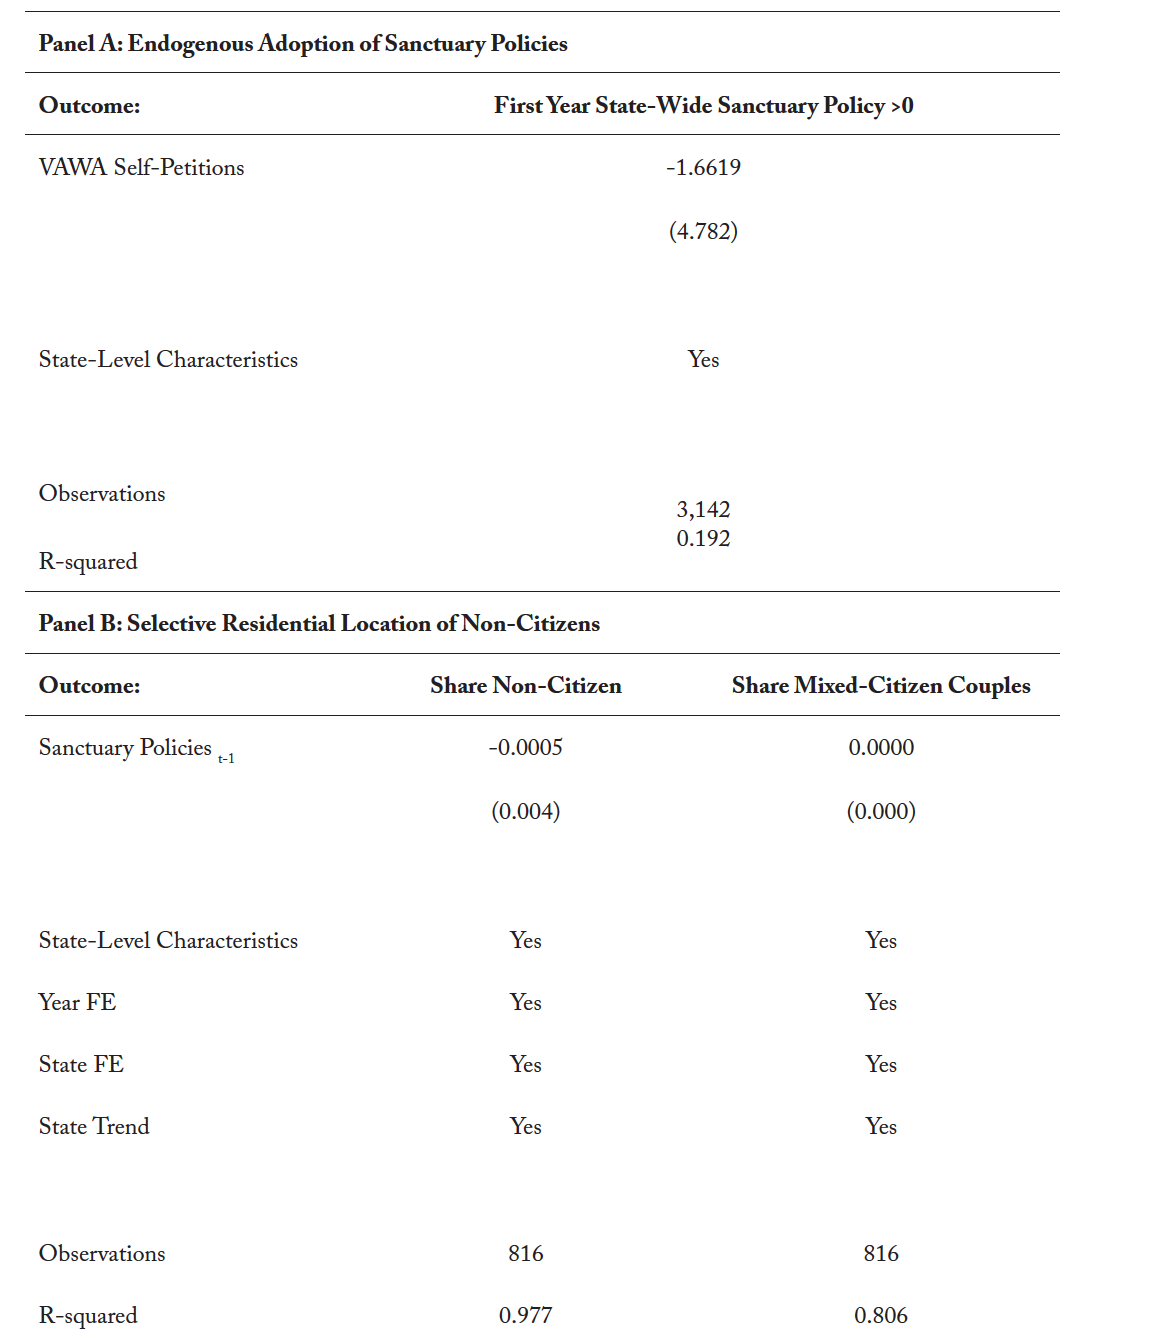
Notes: All regressions include a constant term. Results are weighted by the state’s non-citizen population. Robust standard errors are in parentheses and clustered at the state level. ***p<0.01, **p<0.05, *p<0.1.
Table 5. Robustness Checks
Notes: The models include a constant term, as well as the controls in the most complete model specification in Table 2. Results are weighted by the state’s non-citizen population. Column (1) uses an alternative definition of the dependent variable–namely, the share of VAWA self-petitions per 100,000 foreign born, as opposed to the share of VAWA self-petitions per 100,000 non-citizens. Column (2) uses only the information on statewide sanctuary policies or Trust Acts. Robust standard errors are in parentheses and clustered at the state level. ***p<0.01, **p<0.05, *p<0.1.
Table 6. Mechanisms–Incidence vs. Reporting
Notes: Panel A: All models include a constant term and county-level variables for the share of blacks, share of whites, share of Hispanics, share of female police officers and the unemployment rate. In addition, we control for county and year FE, as well as county-specific time trends. Results are weighted by the county’s population. Homicides by a Spouse refer to all male and female homicides committed by a spouse (wife or husband). Homicides by Family Members include all male and female homicides committed by parents or children. Cases in columns (1) and (2) could potentially include domestic violence cases where the victim would have been eligible to apply for her/his immigration status adjustment under VAWA based on the relationship to the offender. All Other Homicides refer to male and female homicides committed by offenders who are not the spouse, parent, or child, e.g., an employee, employer, neighbor, friend, or unknown person. All homicide variables are measured per 100,000 people. Robust standard errors are in parentheses and clustered at the county level.
Panel B: All models include a constant term, as well as the controls in the most complete model specification in Table 2. Results are weighted by the state’s non-citizen population. Robust standard errors are in parentheses and clustered at the state level.
For both panels: ***p<0.01, **p<0.05, *p<0.1.
Appendix A
What is Domestic Violence?
Domestic violence occurs when an intimate partner or spouse threatens or abuses the other partner. Abuse may include physical harm, forced sexual relations, emotional manipulation (including isolation or intimidation), economic, and/or immigration related threats.
Domestic violence may include sexual assault, child abuse, and other violent crimes. Sexual assault is any type of non-consensual sexual activity, even by a spouse.
Child abuse includes physical abuse, physical neglect, sexual abuse, and emotional abuse.49 Source: U.S. Citizenship and Immigration Services: https://www.uscis.gov/news/fact-sheets/information-legal-rights-available-immigrant-victims-domestic-violence-united-states-and-facts-about-immigrating-marriage-based-visa-fact-sheet
Appendix B
Table B1. Details on the VAWA Self-Petition Process50Source: https://www.uscis.gov/i-360Checklist
References
Abrego, Leisy J. 2011. “Legal Consciousness of Undocumented Latinos: Fear and Stigma as Barriers to Claims-Making for First- and 1.5-Generation Immigrants.” Law and Society Review 45 (2): 337–70. https://doi.org/10.1111/j.1540-5893.2011.00435.x.
Aizer, Anna. 2010. “The Gender Wage Gap and Domestic Violence.” American Economic Review 100 (September): 1847–59.
Amuedo-Dorantes, Catalina, and Esther Arenas-Arroyo. 2019. “Immigration Enforcement and Children’s Living Arrangements.” Journal of Policy Analysis and Management 38 (1): 11–40. https://doi.org/10.1002/pam.22106.
Amuedo-Dorantes, Catalina, Esther Arenas-Arroyo, and Almudena Sevilla. 2018. “Immigration Enforcement and Economic Resources of Children with Likely Unauthorized Parents.” Journal of Public Economics 158: 63–78. https://doi.org/10.1016/j.jpubeco.2017.12.004.
Amuedo-Dorantes, Catalina, and Monica Deza. 2020. “Can Sanctuary Polices Reduce Domestic Violence?” The Center for Growth and Opportunity Working Paper 2020.008 (May 2020).
Bartik, Timothy J. 1991. “Who Benefits from State and Local Economic Development Policies?” Kalama- zoo, Michigan: W.E. Upjohn Institute for Employment Research.
Borusyak, Kirill, and Xavier Jaravel. 2017. “Revisiting Event Study Designs, with an Application to the Estimation of the Marginal Propensity to Consume.” Working Paper, 1–25.
Breidling, Matthew J., Sharon G. Smith, Kathleen C. Basile, Mikel L. Walters, Jieru Chen, and Melissa Merrick. 2014. “Prevalence and Characteristics of Sexual Violence, Stalking, and Intimate Partner Violence Victimization—National Intimate Partner and Sexual Violence Survey.” Centers for Disease Control and Prevention 63 (8).
Bureau of Justice Statistics. 2018. “The Crime Event.”.
Burnett, J. 2017. “New Immigration Crackdowns Creating ‘Chilling Effect’ on Crime Reporting.” National Public Radio, Morning Edition, May 2017.
Center, Violence Policy. 2019. “When Men Murder Women. An Analysis of 2017 Homicide Data.” Report .Washington, DC. Available at https://vpc.org/studies/wmmw2019.pdf.
Chaisemartin, Clement de, and Xavier D’Haultffuille. 2019. “Double Fixed Effects Estimators With Heterogeneous Treatment Effects.” NBER Working Paper Series 25904. https://doi.org/10.2139/ssrn.3148607.
Florence, Curtis, Kathryn E. McCollister, Christina Nicolaidis, Wendy LiKamWa McIntosh, Amy Gor- don, Cora Peterson, Lianne Fuino Estefan, and Megan C. Kearns. 2018. “Lifetime Economic Burden of Intimate Partner Violence Among U.S. Adults.” American Journal of Preventive Medicine 55 (4): 433–44. https://doi.org/10.1016/j.amepre.2018.04.049.
Frieze, I.H., and A Browne. 1989. “Violence in Marriage.” In Family Violence, edited by L.E. Ohlin & M.H. Tonry. Vol.11 (p.163-218) Chicago, IL: University of Chicago Press.
Gorman, S. 2017. “L.A. Police See Drop in Hispanic Reports of Crime amid Deportation Fears.” Reuters, March 2017.
House Hearing, 111 Congress. 2009. “Public Safety and Civil Rights Implications of State and Local Enforcement of Federal Immigration Laws.”
House Hearing, 114 Congress. 2016. “Criminal Aliens Released by the Department of Homeland Security.”
Huecker, Martin R., and Willian Smock. 2020. Domestic Violence. StatPearls [Internet] Publish- ing. Available from: https://www.ncbi.nlm.nih.gov/books/NBK499891/.
Iyengar, Radha. 2009. “Does the Certainty of Arrest Reduce Domestic Violence? Evidence from Mandatory and Recommended Arrest Laws.” Journal of Public Economics 93 (1–2): 85–98. https://doi.org/10.1016/j.jpubeco.2008.09.006.
Jourová, Vĕra. 2016. “Istanbul Convention: Combatting Violence Against Women.” European Commission.
Kasturirangan, Aarati, Sandhya Krishnan, and Stephanie Riger. 2004. “The Impact of Culture and Minority Status on Women’s Experience of Domestic Violence.” Trauma, Violence and Abuse 5 (4): 318–32. https://doi.org/10.1177/1524838004269487.
Khashu, A. 2009. “The Role of Local Police: Striking a Balance Between Immigration Enforcement and Civil Liberties.” Washington, DC: Police Foundation.
Kwak, Hyounggon, Rick Dierenfeldt, and Susan McNeeley. 2019. “The Code of the Street and Cooperation with the Police: Do Codes of Violence, Procedural Injustice, and Police Ineffectiveness Discour- age Reporting Violent Victimization to the Police?” Journal of Criminal Justice 60: 25–34. https://doi.org/10.1016/j.jcrimjus.2018.11.001.
Magnus, C. 2017. “Tucson’s Police Chief: Sessions’s Anti-Immigrant Policies Will Make Cities More Dangerous.” New York Times, December 06, 2017.
Migration Policy Institute. 2019. “Children in U.S. Immigrant Families.” Migration Policy Institute Data Hub. 2019. https://www.migrationpolicy.org/programs/data-hub/charts/children-immigrant-families.
Miller, Amalia R, and Carmit Segal. 2019. “Do Female Officers Improve Law Enforcement Quality? Effects on Crime Reporting and Domestic Violence.” Review of Economic Studies 86 (5): 2220–47. https://doi.org/10.1093/restud/rdy051.
Muchow, Ashley N., and Catalina Amuedo-Dorantes. 2020. “Immigration Enforcement Awareness and Community Engagement with Police: Evidence from Domestic Violence Calls in Los Angeles.” Journal of Urban Economics 117 (103253). https://doi.org/10.1016/j.jue.2020.103253.
Nelson, Heidi D., Christina Bougatsos, and Ian Blazina. 2012. “Screening Women for Intimate Partner Violence: A Systematic Review to Update the U.S. Preventive Services Task Force Recommendation.” Annals of Internal Medicine 156 (11): 796. https://doi.org/10.7326/0003-4819-156-11-201206050-00447.
Nguyen, Mai Thi, and Hannah Gill. 2015. “Interior Immigration Enforcement: The Impacts of Expanding Local Law Enforcement Authority.” Urban Studies 53 (2): 302–23. https://doi.org/10.1177/0042098014563029.
Raj, A, JG Silverman, J McCleariy-Sills, and R Liu. 2005. “Immigration Polices Increase South Asian Immigrant Women’s Vulnerability to Intimate Partner Violence.” Journal of the American Medical Women’s Association 60 (1): 26–32.
Rhodes, Karin V., Catherine L. Kothari, Melissa Dichter, Catherine Cerulli, James Wiley, and Steve Mar- cus. 2011. “Intimate Partner Violence Identification and Response: Time for a Change in Strategy.” Journal of General Internal Medicine. 26(8), 894–899.
Rosenblum, Marc R, and Kristen Mccabe. 2014. “Deportation and Discretion: Reviewing the Record and Options for Change.” Migration Policy Institute. Washington DC.
Ruggles, Steven, Sarah Flood, Ronald Goeken, Josiah Grover, Erin Meyer, Jose Pacas, and Matthew Sobek. 2019. “IPUMS USA: Version 9.0 [Dataset].” Minneapolis, MN: IPUMS. 2019. https://doi.org/https://doi.org/10.18128/D010.V9.0.
Stevenson, Betsey, and Justin Wolfers. 2006. “Bargaining in the Shadow of the Law: Divorce Laws and Family Distress.” Quarterly Journal of Economics 121: 267–88.
Theodore, Nik, Robby Habbas, Celinda Lake, Josh Ulibarri, Cornelia Treptow, Dom Bartkus, Ange- la Glover Blackwell, and Milly Hawk Daniel. 2013. “Insecure Communities: Latino Perceptions of Police Involvement in Immigration Enforcement.” Department of Urban Planning and Policy Report, University of Chicago.
Tjaden, Patricia, and Nancy Thoennes. 2000. “Extent, Nature, and Consequences of Intimate Partner Violence.” National Institute of Justice Report. Control, National Institute of Justice and Centers for Disease: 55. http://www.ncjrs.gov/App/abstractdb/AbstractDBDetails.aspx?id=181867.
U.S. Department of Justice, Bureau Statistics. 2018. “Supplemental Homicide Reports (SHR) within the Uniform Crime Reporting (UCR) Program.”
Vaughan, Jessica M. 2013. “Deportation Numbers Unwrapped: Raw Statistics Reveal the Real Story of ICE Enforcement in Decline.” Center for Immigration Studies Report. October: 1–16.
Vidales, Guadalupe, Kristen M. Day, and Michael Powe. 2009. “Police and Immigration Enforcement.” Policing: An International Journal of Police Strategies & Management 32 (4): 631–53. https://doi.org/10.1108/13639510911000740.
Vishnuvajjala, Radha. 2012. “Insecure Communities: How an Immigration Enforcement Program Encourages Battered Women to Stay Silent.” Boston College Journal of Law & Social Justice 32 (1): 185– 213.