


1 Introduction
Over the last two decades, the digital economy as a whole and the mobile application (app) economy in particular, have experienced dramatic growth. According to the International Telecommunication Union (2022), the number of individuals using the internet worldwide grew from 1 billion in 2005 to 4.9 billion in 2021. These figures correspond to 16% and 63% of global population, respectively. Our dataset alone has captured more than 700 billion app downloads between 2014 and 2021 (see Figure 1.1).1The total number of downloads during this period is even higher than we state, due to our dataset not being universal. With the growth of the digital economy, public discussion about its regulation has been gaining momentum. The increased push towards a regulatory framework for digital markets the development of regulatory proposals in the form of the American Innovation and Choice Online Act in the United States and the already passed Digital Markets Act in the European Union. Similar initiatives are being promoted by competition authorities in other developed countries, for example the Competition and Markets Authority (CMA) in the United Kingdom, or the Australian Competition and Consumer Commission (ACCC).2In Australia, there is an ongoing “digital platform services inquiry,” Australian Competition and Consumer Commission, “Digital Platform Services Inquiry 2020-25,” July 25, 2023, accessed on June 29, 2023, https://www.accc.gov.au/inquiries-and-consultations/digital-platform-services-inquiry-2020-25. In the UK, the CMA has established a dedicated Digital Markets Unit, to “operationalize the future pro-competition regime for digital markets,” “Digital Markets Unit,” GOV.UK, July 20, 2021, accessed on June 29, 2023, https://www.gov.uk/government/collections/digital-markets-unit.
Figure 1.1. Cumulative Number of App Downloads Since 2014
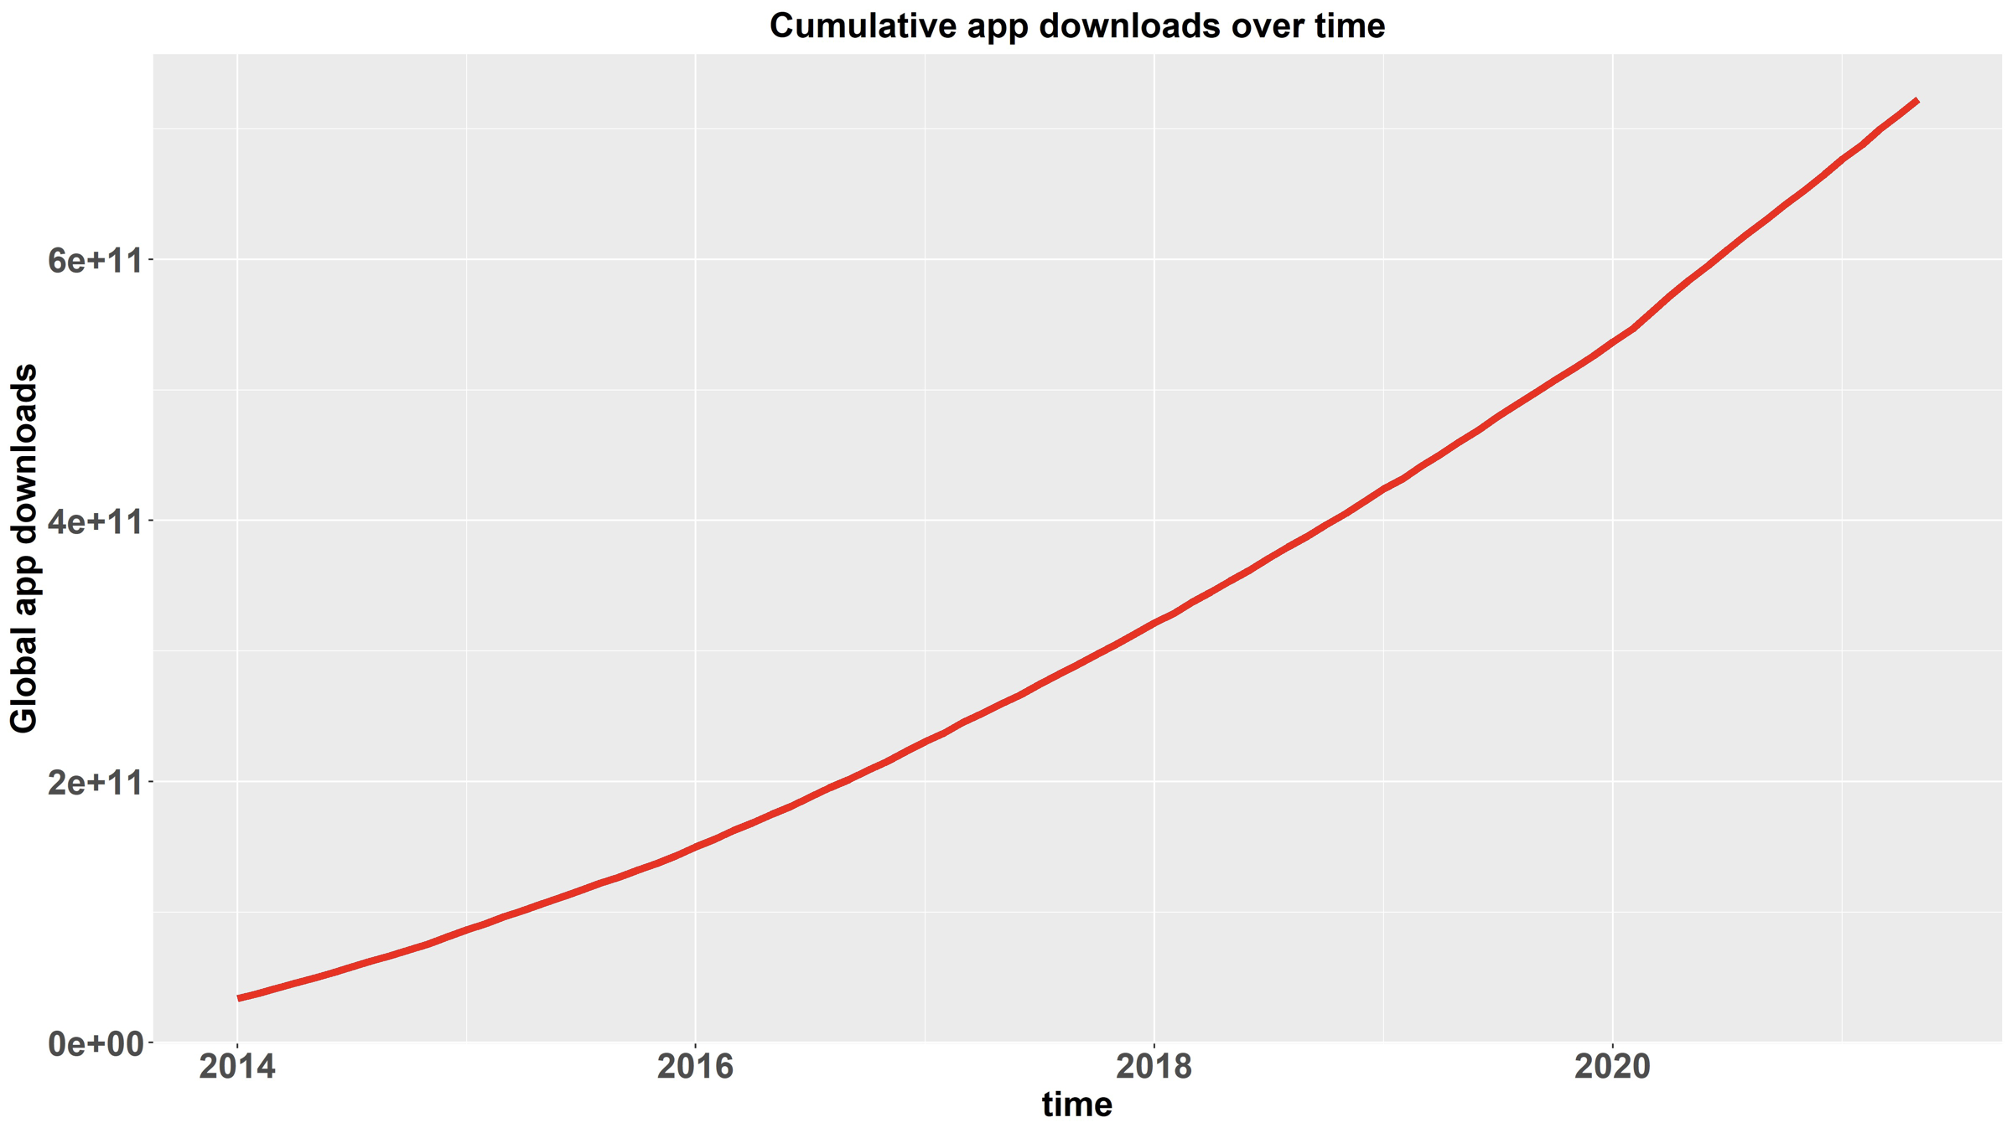
Data Source: Sensor Tower. Note that the cumulative number of downloads is assumed to be zero prior to 2014, as our data becomes available in 2014. Note also, that the cumulative number of downloads shown above is a floor estimate. It shows downloads only for those apps included in our dataset.
Much of the recent debate on digital markets regulation has revolved around the question of whether a platform owner should be allowed to directly participate in its own marketplace and compete with third-party developers. Some critics raise the concern that platforms may have an incentive to engage in what might be considered anticompetitive behavior, such as sabotaging rivals, charging excessive fees, and so-called “self-preferencing,” which in very general terms can be defined as giving preferential treatment to the platform’s own products over those of third-party sellers (Farronato et al., 2023). This question is foremost discussed in the context of Amazon, which allegedly engaged in “unfair competition” against third-party sellers on its own platform (see, e.g., Ford & Stern, 2022) and in the context of Google for its search engine (Deutscher, 2021).
Similar concerns in the public debate are raised in reference to app markets. The often-made argument is that by participating as a seller in the app store, a platform has the tools to give its own apps preferential treatment, for example by altering app rankings or search results in favor of its own apps. Whether platforms engage in self-preferencing is one issue. A separate concern is whether the alleged self-preferencing is causing a reduction in economic welfare. The latter question is often overlooked in the self-preferencing discussion. However, if the answer is ‘no’ to at least one of the two questions, then—on traditional antitrust grounds—there should be no reason for barring platforms from participation in their own markets.
In this work, we focus on the app market and investigate how the introduction of an app by the platform owner (Apple on the App Store and Google3Although the parent company name is Alphabet, we will refer to the company as Google, as this is the name most associated with Android and the Play Store. on the Google Play Store) affects third-party apps on the same platform. Since our dataset does not allow us to test for presence of self-preferencing and consequences of self-preferencing separately, we address a more general question: What are the observed effects of mobile platforms’ presence in their own app stores?
We use a detailed panel dataset from Sensor Tower, a major mobile app consultancy, which contains data on apps available on the two most prominent app stores—the App Store and the Google Play Store—at the monthly level. We assess the effects of a first-party app launch on a set of market outcomes for other apps, some of which could be considered competitors to the first-party app. A first-party app is one offered by the platform provider. We examine whether a platform engages in activities that decrease use of third-party apps of the same category, which we call suppression,4Our analysis is unable to separate substitution effects and the effects of acts that suppress third-party apps, but we are able to make inferences. or instead stimulates the app market. We focus on the following outcome metrics:
- Quantity demanded for third-party apps, measured by the monthly number of similar third-party app downloads and the monthly number of active users of these third-party apps;
- Innovation and quality-improving activity of third-party app providers, measured by monthly number of application updates; and
- Entry by new apps, measured by the monthly number of new third-party apps similar in category to the platform’s app.
We measure whether an app is similar to the platform’s app by examining whether it is in the same app category, as defined by the platform. This measure not only includes rival apps, but also apps that are not substitutes for the platform’s app. Because our data does not tell us which apps consumers consider to be substitutes, we do not examine self-preferencing or app-specific sabotage.5To assess sabotage targeted at direct rivals, we would need well-defined app categories that were restricted to apps that consumers consider to be substitutable for the platforms’ apps. For example, if we were to test for targeted sabotage arising with the entry of the Google News & Weather app, the comparison group would consist of apps offering sufficiently similar news content, news aggregation, weather forecasting, or other related functionality that consumers would consider them to be substitutes. App categories in our data are not defined with substitutability in mind, so we are unable to specifically test for targeted sabotage. This is a well-known problem in the empirical literature on mobile app ecosystems. For example, Ershov (2022) states: “Defining a relevant market for competition is important. Apps in the same category could be broadly considered to be competitors, but categories include thousands (or tens of thousands) of apps and are too broad.” The most popular remedy relies on suggestions of similar apps on Google Play to construct a network and perform cluster analysis. This was the approach undertaken by Kesler et al. (2017), Wen & Zhu (2019), and Ershov (2022) among others. We intend to use this approach in future research.
Our results find that third-party developers often benefit from a platform providing its own apps. On the App Store, we find that launches of Apple apps are associated with increased downloads of third-party apps, more app development, and more updates of third-party apps. We do not find the same for Google Play. The launch of Google apps appears to be inconsequential for rival app downloads and may have a small negative effect on the number of third-party app users. These findings are consistent with the hypothesis that introduction of apps is either welfare-enhancing (in the case of Apple), or at least welfare-neutral (in the case of Google). While advancing policy recommendations is not the purpose of this paper, we hope our findings will inform the debate on platforms and will be of particular interest to those who view competition through the consumer welfare standard.
We add to the empirical literature on the effects of mobile platforms launching their own apps in at least three important ways. First, to the best of our knowledge, this study is the first to look at the effects of first-party app launches on demand and competition metrics. Previous studies have focused on the effects of platforms’ app entry on innovation. Second, we contribute new information on the debate over innovation impacts. Existing results on the effects of first-party apps on third-party app innovation are mixed. Lastly, in contrast to prior literature, which is limited to studies of a few selected app releases on Google Play, our dataset allows us to consider first-party app launches in both Google Play and the App Store in a more comprehensive manner, thereby making our results more generalizable.
The remainder of the paper proceeds as follows. The next section summarizes the relevant literature. Section 3 describes the hypotheses we are testing. Section 4 discusses data and presents some descriptive statistics on the mobile app market. Section 5 presents our empirical approach and results. Section 6 concludes.
2 Literature
There are a number of recent studies addressing digital platforms’ entry into their own marketplaces. Zhu (2019) provides an overview of related empirical work. A subset of that research deals specifically with the mobile application market. Two studies are in particular closely related to our work and looked at innovation activity (number of app updates) in response to first-party app entry.6We are unaware of any work that would assess the effects of app entry directly on the number of downloads, perhaps due to limited availability of relevant data. Interestingly, the two reports arrive at opposite conclusions. Foerderer et al. (2018) examine implications following the launch of the Google Photos app on the Android platform. The authors find that following the entry, innovation activity of similar apps increased and hold that this increase is attributable to what they call ‘attention spillovers’—an increased user interest in the relevant category of apps as a whole, perhaps making updates profitable.
Wen & Zhu (2019) address not only actual entry, but also the threat of entry by Google into the Android app market. Here the authors find that both entry threat and actual entry lead to a reduction in innovation activity of similar apps. One possible explanation for these contrasting results from the two studies could be their app choices. While Foerderer et al. (2018) focus on a single app, Google Photos, Wen & Zhu (2019) focus on three other apps, namely, Android Restricted User Activity, Podcasts, and Flashlight. It might be that this divergence of results is due to the differences in the apps studied. While some developers of third-party apps might innovate in response to first-party entry, perhaps because of attention spillovers or a desire to match or exceed the features of the first-party app, other developers believe innovation responses would be unprofitable. This slow-down in third-party innovation could be because the platform engaged in sabotage of its rivals or because the first party is better suited for providing apps that consumers prefer.
Several other studies deal with market entry for mobile apps, although in different contexts than that of first-party entry. For instance, Liu (2017) and Bresnahan et al. (2014) analyze app developers’ decisions on which platform to enter (App Store vs. Google Play Store). Ershov (2022) studies game apps that become very successful upon entry. His research question is whether the entry of such “superstar” apps promotes or reduces entry of new apps in the same category. The main finding is that in popular categories the first effect dominates, while in less popular categories it is the latter.
There is a growing body of literature on self-preferencing on platforms. Most of this literature is theoretical. Padilla et al. (2022) examine under what circumstances platforms may have an economic incentive to foreclose third-party providers from their markets. Hagiu et al. (2022) consider a counterfactual scenario in which platforms are prohibited from participating in their own marketplace. They find that such a ban would have negative consequences in terms of economic welfare, even if the platform is otherwise engaging in self-preferencing. They conclude that a ban on self-preferencing alone would be a better policy measure than an outright ban on a platform’s participation in its own marketplace. In practice, however, such regulatory restriction on self-preferencing would likely be difficult and costly to enforce. Zennyo (2022) goes even one step further by concluding that self-preferencing is beneficial for consumers because it leads to lower equilibrium seller commissions, which are then passed on to the consumers. Moreover, the author finds that self-preferencing increases aggregate economic welfare and is therefore pro-competitive compared to the benchmark scenario of no preferencing.
As for empirical treatment of self-preferencing, most studies investigate Amazon’s activity as a seller on its own marketplace. Zhu & Liu (2018) find that Amazon is more likely to enter into competition with third-party sellers in product spaces that are more successful in terms of sales and ratings. Lee & Musolff (2021) find that Amazon tweaks its algorithms so that products sold by Amazon are displayed more prominently than third-party products, which they also find aligns with consumers’ preferences as consumers would often prefer Amazon’s products anyway. Using data from actual consumer search, Farronato et al. (2023) arrive at a similar conclusion: given a consumer search, Amazon products rank higher on average than third-party counterparts, and this difference cannot be explained away by any other observed factors. Finally, Dube (2022) points out the similarities between Amazon’s own brand strategy and traditional retailers’ private label brands.
3 Hypotheses
Debates in the political arena about app stores include assertions that Apple with its App Store and Google with its Play Store exercise market power in ways that harm rivals and consumers. One prominent speaker on the subject, Senator Richard Blumenthal (Blumenthal, 2021), who is one of the sponsors of the Open App Markets Act,7Open App Markets Act (2022). argues that the companies repress competition from startup app companies, which discourages innovation and raises prices. Targeting Apple, he asserts that the company has stifled competition by preventing third-party app stores on iPhones, requiring app developers to use Apple’s payment system, and “penaliz[ing] app developers for telling users about discounted offers.”8Blumenthal (2021). See also The Netherlands Authority for Consumers & Markets (2019, 40) and U.S. House. Committee of the Judiciary (2022, 99). This targeted statement highlights a difference between Apple’s and Google’s policies, namely that Google allows non-Google app stores on its Android platform and allows third-party app providers to tell users on the platform about discount offers. Apple does not allow these.
According to the Congressional Research Service (2022), proponents of regulating the app stores also hold that Apple and Google hinder competition by:
- Requiring developers to use the platforms’ payment systems;
- Giving themselves preferential access to platform technologies;
- Biasing app store search algorithms; and
- Using data from rivals to develop their own apps.
The above arguments appear to envision a situation where an app store provider offering app downloads  decides whether to engage in suppression activity
  against rival apps
  , where
 ![i=[1, I]](https://www.thecgo.org/wp-content/ql-cache/quicklatex.com-676d042c972a100869669f1eddf10445_l3.svg "Rendered by QuickLaTeX.com") represents a particular app and
represents a particular app and ![t=[1,T]](https://www.thecgo.org/wp-content/ql-cache/quicklatex.com-86a940511f86475852ac6a8d4651972b_l3.svg "Rendered by QuickLaTeX.com") is the production period. Choosing
is the production period. Choosing  decreases
  , which is the quantity demanded of other apps. This suppression is profitable for the app store provider if additional revenue from providing more
  is greater than the costs of suppression9Suppression costs may be negative, as when providing higher quality resources or connectivity to rivals creates higher costs. plus the decline in app store revenue collected from rivals’ sales. The revenue from increasing
  includes the value of user data that would be received from , and the revenue loss from the lower includes the lower value of user data that the app store might have received.
This calculus affects Apple and Google differently. Because Google allows third-party app stores and so-called “sideloading” (i.e., the practice of installing an app on a device not through the official app store, but through third-party channels) on its platform, acts of suppression through its Play Store might incentivize consumers to use alternative app stores or sideloading. Consumer migration to these alternative sources of apps could increase revenue losses and data losses for Google, which would decrease its incentive to suppress. However, if the suppression incentivizes consumers to change platforms rather than app stores within the platform, Apple’s and Google’s incentives should be nearly the same.
Suppression can take many forms. Some forms would lower  , the value of the app store, in particular for rival apps. These forms of suppression might include the app store provider decreasing the quality of users’ experiences, of availability of rival app stores or sideloading, of application programming interfaces (APIs) that app developers use to provide their apps, or of the payment system. Other forms of suppression might be specific to particular rival apps, such as self-preferencing or imposing arbitrary requirements for the rival app to be in the app store.
But an app store provider offering app  might also have an incentive to increase . For example, if a platform feature affects all apps, or all apps of a particular type, an improvement in the feature would positively impact both the demand for and for . Other features might be specific to rival apps, but increasing their quality might have attention spillovers, providing the app store with an incentive to increase . Also, if the profit margins to the platform for are greater than those for , the introduction of increases the profitability of increasing the number of consumers that use the platform, which would increase demand for both and .
As in the case of suppression, the differences between Apple and Google policies affect incentives to increase quality. More specifically, Google’s incentive to improve quality could be higher than Apple’s by the extent to which an improvement in quality decreases consumers’ use of sideloading and alternative app stores. But as before, both platform providers face competition from each other as consumers choose mobile phones in part on their experiences with app stores and apps. This would tend to make Apple’s and Google’s incentives for quality to be nearly the same.
Unrelated to suppression or platform quality, the app store provider’s provision of its own apps might create attention spillovers for rival apps, resulting in an increase in demand for these apps exceeding any substitution effect from . This spillover effect should be similar for both platforms.
This discussion leads to three hypotheses. The first hypothesis is that attention spillovers, created by an app store increasing its own-app offerings, increase the demand for rival apps. We fail to reject this spillover hypothesis if we find that the introduction of first-party apps increases the downloads or number of users of rival apps. Given our belief that spillovers should affect both app stores in similar ways, we fail to reject the spillover hypothesis only if the introduction of first-party apps is positive for both Apple and Google.10Statistical hypothesis testing relies on a null hypothesis (“H0”) specified by the researcher and an alternative hypothesis (“H1” or “HA”), which in most applications (but not always) is the complement of the null hypothesis. Given a certain statistic calculated from the data, the researcher either rejects the null hypothesis or fails to reject the null hypothesis. In the first case, the alternative hypothesis is considered to be true with high probability, while in the latter case either the null or the alternative is true (in other words, the statistical evidence is not sufficient to draw inference). For more details and examples on hypothesis testing, the reader should refer to introductory statistics or econometrics textbooks.
Our second hypothesis is that when an app store increases its own-app offerings, the incentives to suppress outweigh the incentives to improve platform quality, leading to a lower demand for rival apps. We fail to reject this suppression hypothesis if we find that the introduction of first-party apps decreases demand for rival apps. We assess changes in demand by examining numbers of downloads and numbers of users. We note that there should be a substitution effect between and some apps in , which might also explain why the introduction of leads to a decrease in .
Our third hypothesis is nearly the reverse of the second one, namely that when an app store increases its own-app offerings, the incentives to improve platform quality and the effects of attention spillovers outweigh the incentives to suppression, leading to greater demand for third-party apps. We fail to reject this quality hypothesis if we find that the introduction of first-party apps increases demand for third-party apps.
There are six possible combinations of outcomes for our tests of how the introduction of first-party apps affects demand for third-party apps:
- Positive impacts on both platforms – We reject the suppression hypothesis and fail to reject both the spillover and quality hypotheses, but we would be unable to disentangle these two effects with our data.
- Positive impact on one platform and no impact on the other platform – We reject the spillover hypothesis, reject the suppression hypothesis, and fail to reject the quality hypothesis for the demand-increasing platform.
- Positive impact on one platform and a negative impact on the other platform – We reject the spillover hypothesis and the suppression hypothesis. We fail to reject the quality hypothesis for the demand-increasing platform, and we reject the quality hypothesis and fail to reject the suppression hypothesis for the remaining platform.
- Negative impact on one platform and no impact on the other platform – We reject the spillover hypothesis, reject the quality hypothesis, and fail to reject the suppression hypothesis for the demand-decreasing platform.
- Negative impact on both platforms – We reject the spillover and quality hypotheses and fail to reject the suppression hypothesis.
- No impact on both platforms – We reject the spillover, quality, and suppression hypotheses.
The arguments in support of regulation also appear to envision a situation where an app store provider offering app affects rivals’ incentives to innovate. The innovation envisioned appears to take two forms. The first is that the platform’s suppression reduces the number of rivals, which in turn decreases diversity of supplier opinions expressed in the marketplace. This decrease in opinions may or may not affect innovation, which we define as Schumpeterian creative destruction in the product space. This creative destruction is influenced by many features of the business environment, including regulations, information, expected profits, and the abilities of those creating or adopting the new product to turn it into a successful business.
Previous studies provide conflicting or inconclusive findings regarding whether the number of firms in an industry affects innovation (Symeonidis, 1996). But since many debating in the policy arena believe that the number of rivals is relevant to innovation, we test how first-party app introduction affects the number of rivals. This leads to our fourth hypothesis, namely that when an app store increases its own app offerings, third parties increase (conversely, decrease) their introduction of apps. We fail to reject this entry-inducing hypothesis if we find that third parties significantly increase (conversely, decrease) their introduction of apps when the app store increases its number of apps.
The second form of innovation apparently envisioned in the pro-regulation arguments is about firms’ incentives and abilities to improve their apps. Third-party app developers using a platform that chooses and might find their abilities to improve their app hindered by the suppression. On the other hand, if and  , third parties might find an enhanced ability to improve their apps. Third-party app developers might also upgrade their apps in response to the introduction of a first-party app if the latter is higher quality than the third parties’ existing apps. This leads to our fifth hypothesis, namely that when an app store increases its own-app offerings, third parties upgrade their apps, perhaps because of some combination of the platform improving the profitability of third-party app upgrades or because the first-party app is of higher quality than the third parties’ existing apps. We fail to reject this innovation-enabling hypothesis if we find that third parties increase their app upgrades when the platform increases its own apps. We are unable with our data to distinguish between the two potential causes. We are also unable with our data to test whether the platform discourages innovation, but such a hypothesis would be rejected if we fail to reject the innovation-enabling hypothesis.
Results from these analyses also inform our suppression and quality hypotheses. In general, firms enter markets when they perceive profit opportunities. If we find that the introduction of a platform app positively impacts entry in an app category, this would be evidence in support of the quality hypothesis and against the suppression hypothesis.
4 Data and Descriptive Statistics
4.1 Data
Our primary data source is Sensor Tower, a leading mobile analytics company. We have a monthly panel of apps over time, ranging from January 2012 to May 2021 for Apple and January 2014 to May 2021 for Android. The dataset is not universal, but it is fairly rich: It encompasses all apps that fulfill at least one of the two following criteria: 1) Apps that have at least 100,000 worldwide all-time downloads; or 2) Apps that have at least $100,000 worldwide all-time net revenue. According to Sensor Tower, apps that meet these qualifications account for roughly 96% of all-time downloads and 99% of all-time revenue globally. This gives us a total of 406,900 unique apps over our timespan. Table 4.1. lists the variables we observe for each app in each month.
Tables 4.2 and 4.3 show summary statistics on some of the variables listed in Table 4.1, for Apple and Google respectively. These statistics were calculated from observations at the app-month level (with the exception of the number of entrants, which was calculated at the category-month level). Unsurprisingly, most of the variables in those tables (notably the variables that we will use as outcome variables in Section 5), show a skewed distribution with a longer right tail. The data is consistent with the anecdotal evidence and our own perceptions of the app market: there is a large mass of relatively small apps and a handful of very successful apps. The last row in each of the tables (“impact”) is an indicator equal to 1 if the respective platform launched an app in category  and month
  . Accordingly, the probability of Apple launching an app in a given category and month is 0.03. The corresponding probability for Google is more than double Apple’s, at 0.07.
4.2 Descriptive Statistics
In this section, we demonstrate some patterns of application downloads over time. More specifically, we decompose the number of downloads over time into three components: 1) A trend component; 2) A seasonal component; and 3) An irregular component, i.e.,
![\[Y_t \equiv T_t+S_t+\varepsilon_t\]](https://www.thecgo.org/wp-content/ql-cache/quicklatex.com-59679ec9d8b4182617e618df7ce2357b_l3.svg "Rendered by QuickLaTeX.com")
where  is the number of downloads,
  is a long-term trend component,
  is a seasonal pattern (in this case, monthly), and
  is a random, irregular component. Figures 4.1, 4.2, and 4.3 show time trends for App Store, Play Store, and both platforms combined respectively. The first panel in each figure shows the original time series of , the second panel shows , the third panel displays expressed in months, and the fourth panel shows . We adopt the ‘X11’ decomposition method, widely used by many government agencies and statistical offices for forecasting (notably, the US Census Bureau and Statistics Canada). This time-series decomposition method is considered superior to the traditional symmetric-moving-average standard for several reasons. It allows the seasonal component to vary over time; it preserves the boundary observations, and in general, it retains less serial correlation in the irregular component.11We refer the interested reader to (Bee Dagum & Bianconcini 2016) for more details.
Figure 4.1. Download Patterns of App Store Applications
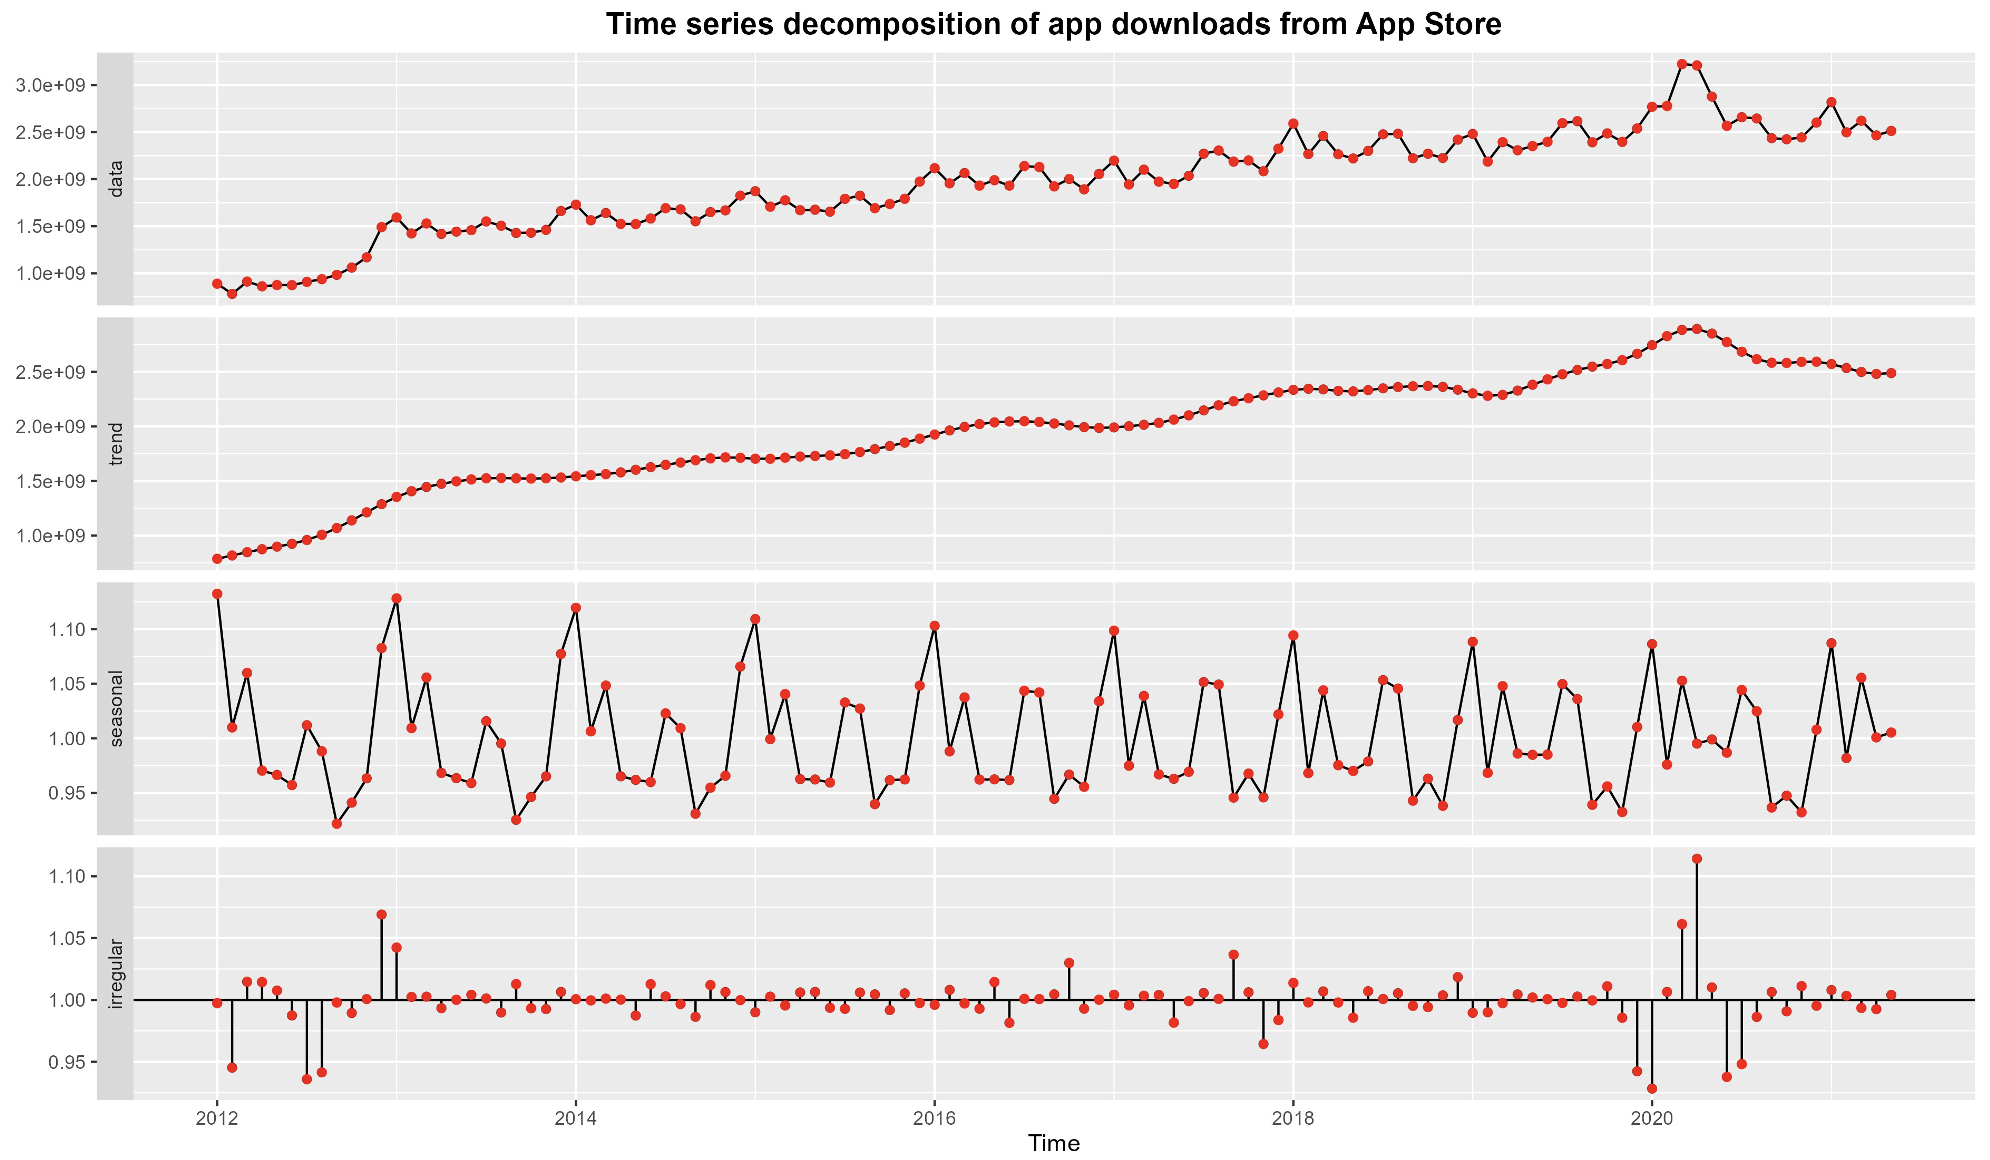
Patterns are similar across platforms, even if orders of magnitude are different: Apple has about 2.5 billion monthly downloads in the beginning of 2020, while Google has about 9 billion monthly downloads at the same time, suggesting that Android’s global user demand for apps is nearly four times that of Apple’s. Expectedly, the general trend is that the number of users and their interest in apps are growing over time. In the trend line for Play Store in Figure 4.2, two discrete jumps are noticeable: one at the beginning of 2016 and another at the beginning of 2020. The reason for the 2016 jump is unclear, but the 2020 jump is likely due to the pandemic increasing the demand for online applications (Jamison & Wang, 2021).
Figure 4.2. Download patterns of Google Play applications
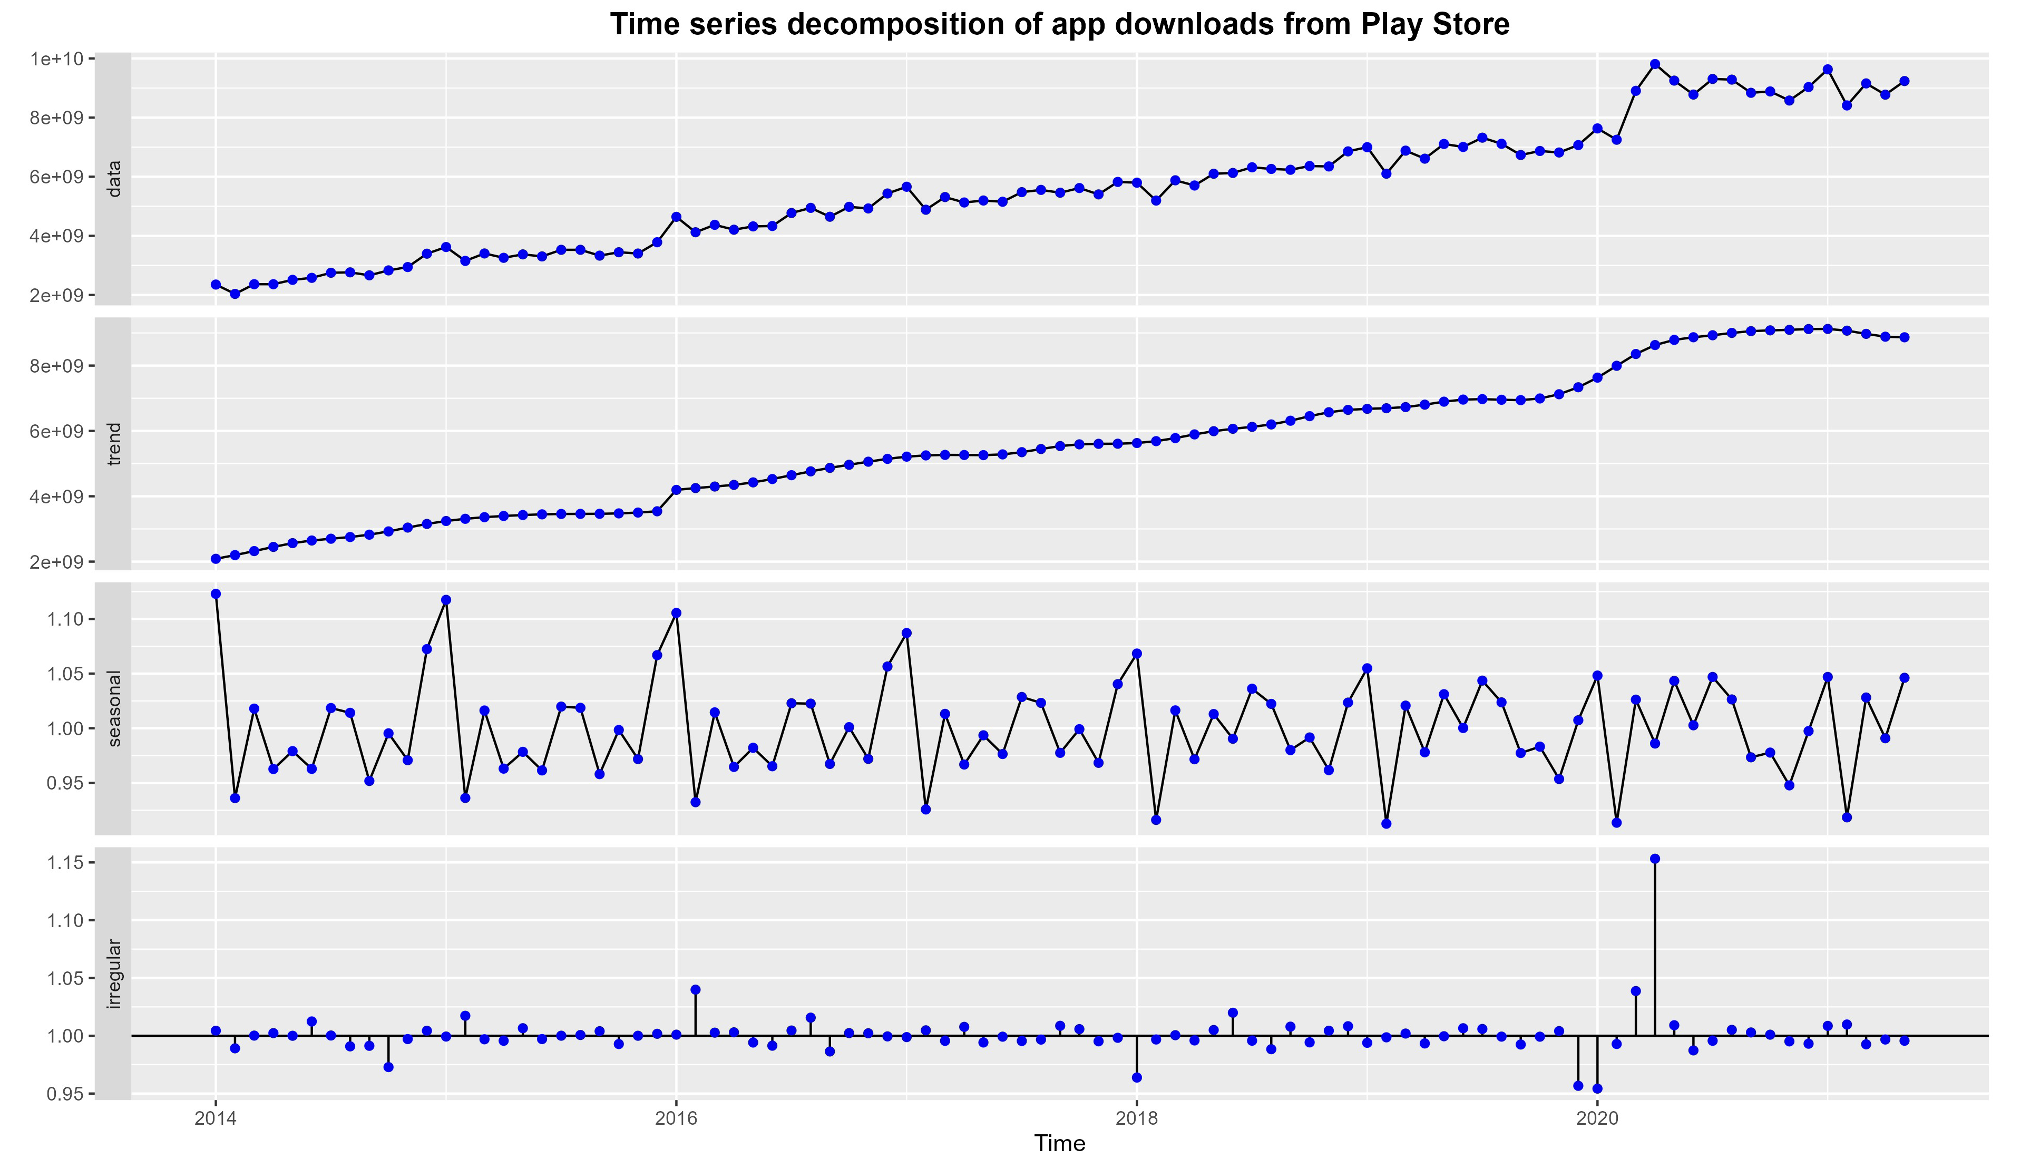
Figure 4.3. Download patterns of all applications
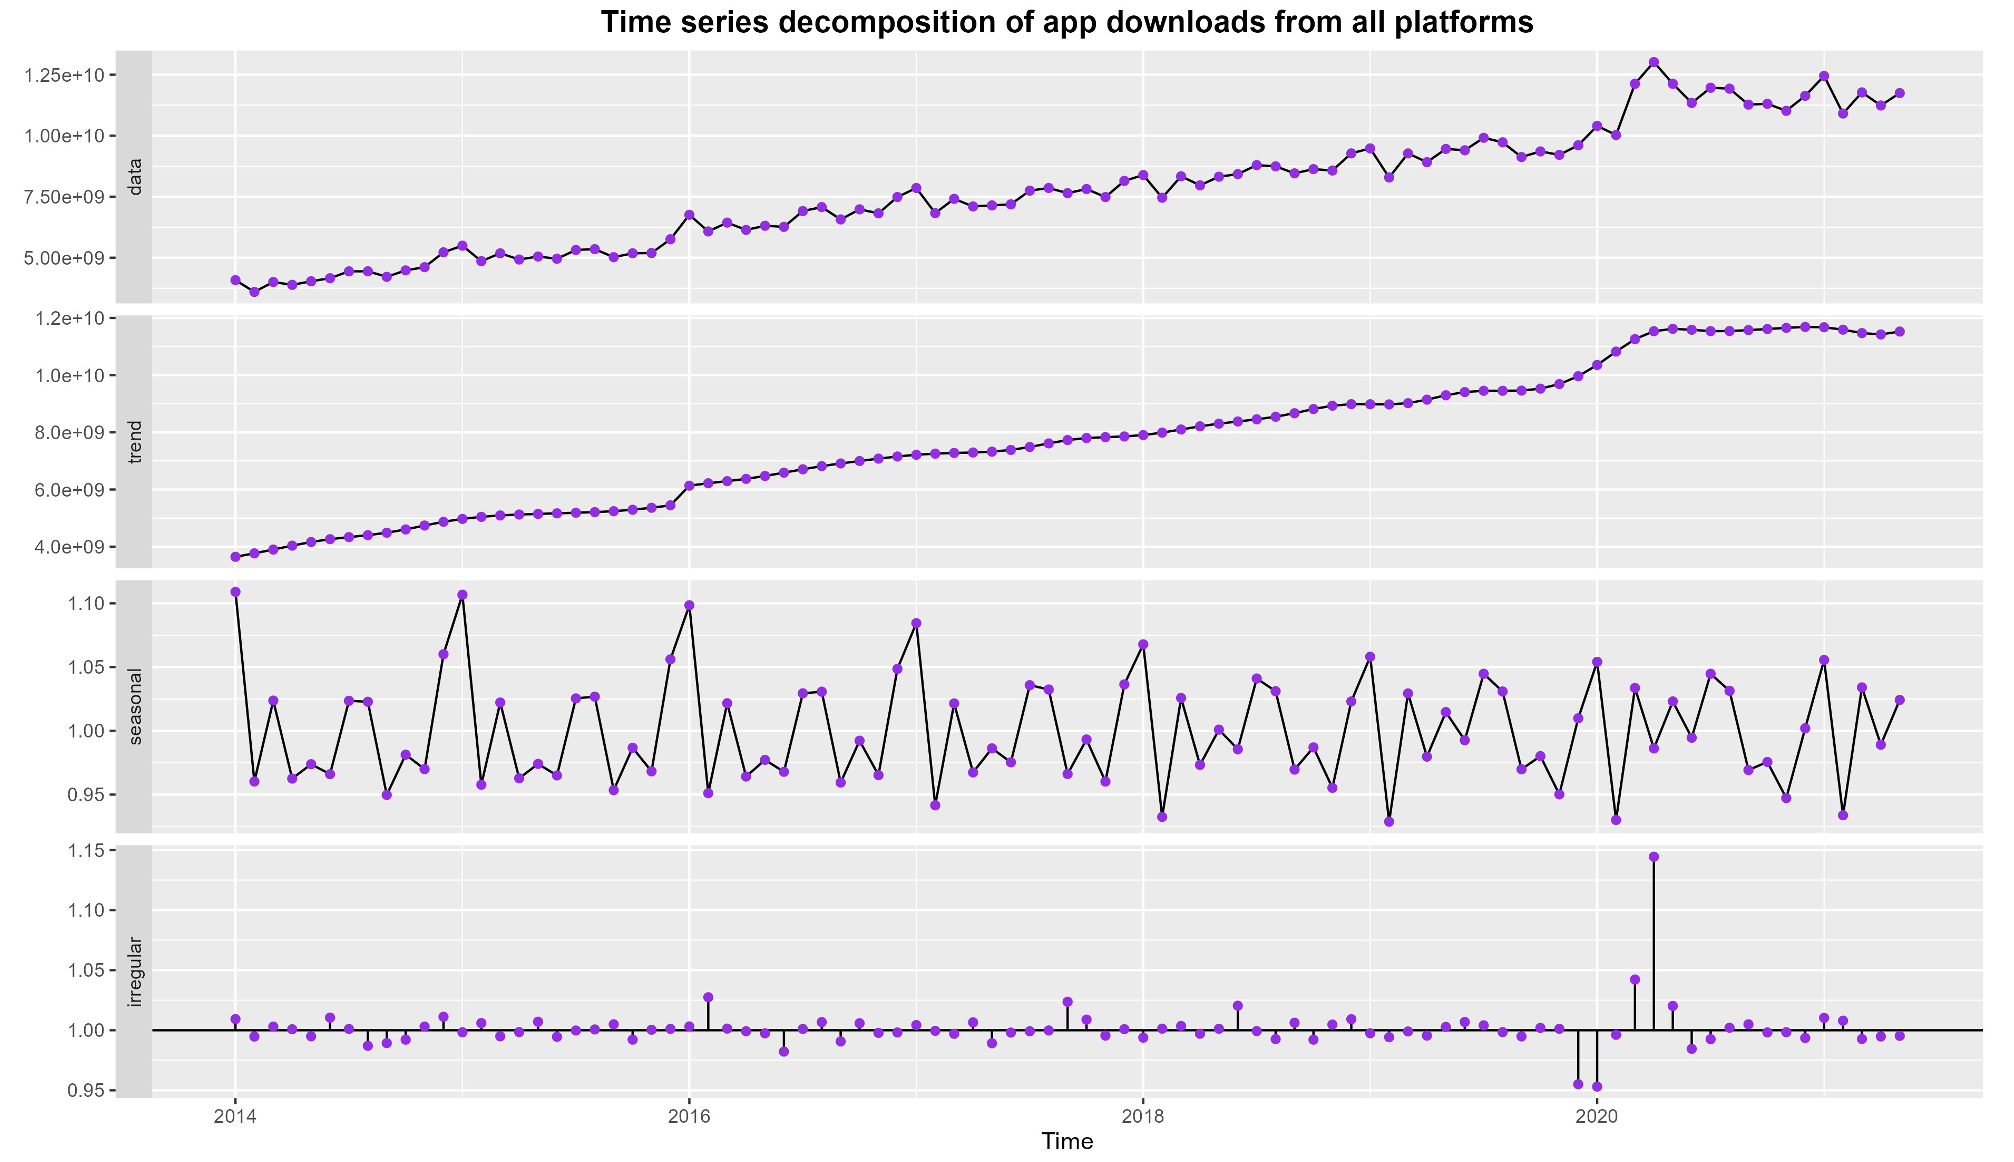
Seasonal patterns reveal that the number of downloads tends to be higher in January and December for both platforms, probably reflecting a holiday effect. The month(s) with a lower-than-usual number of downloads depends on the platform: for Google that month is February, and for Apple, the months are September–November. September–November months are also low for Google, but not as low as February. The positive effect of the pandemic on downloads is clearly visible in the irregular series, which is the fourth panel in each graph. On aggregate, the number of downloads in April 2020 was 15% higher than would have been expected.
5 Empirical Analysis
Our empirical strategy relies on an approach where we compare the outcomes for apps exposed to the launch of a platform app (e.g., Google Photos, Apple Podcasts), to outcomes for all other applications. Our dataset contains 30 apps published by Apple and 114 apps published by Google during the sample period.
We define the group of third-party apps exposed to platform app entry as those that belong to the same primary category as the entering app. We use the categories defined by each platform. For example, for Apple Podcasts, the primary category is Entertainment. Each platform defines categories differently. The empirical approach can be formalized as:
![\[Y_{i c t}^P=\alpha^P \cdot \text { impact }_{i c t}^P+\beta^P \cdot \text { ratings }_{i c, t-1}^P+f_i^P+f_t^P+\varepsilon_{i t}^P\]](https://www.thecgo.org/wp-content/ql-cache/quicklatex.com-3c5482fa1178d27006ad4120759b8417_l3.svg "Rendered by QuickLaTeX.com")
Here,  denotes an outcome of interest. The term
  is an indicator variable equal to 1, if app
  belongs to category , and a platform app has entered category either in month , or month
  . The control variable
  captures the average rating of app at the end of month
  . The terms
  and
and  denote app and time-fixed effects respectively. They control for time and app-specific idiosyncrasies. Finally,
  is the error term. Because we have cross-sectional fixed effects in the specification (i.e., app fixed effects), we do not include a nominal constant. The superscript
  throughout the regression equation denotes platform:
  . It is there to emphasize that we estimate Equation (5.1) separately for each platform.
The outcome variables we consider are:
- global number of downloads,
- US number of downloads,
- monthly active users,
- number of monthly updates, and
- number of new apps in a given category.
The first three variables proxy for demand, the fourth measures innovation activity, and the fifth represents levels of market entry following a platform app launch, which some observers view as affecting innovation.12Some other readers may disagree that the number of app updates is a good representation of innovation activity. This is however the measure typically used in the literature (Wen & Zhu, 2019). We could amend our statement and claim instead that the number of updates measures ‘improvement’ (which hopefully follows with most updates). In any case, as long as we are interested in the in developers’ general activity response to first-party app entry, the exact labeling of the outcome is of secondary importance. For the first three variables, we use the transformation  , where
  is the original variable, since the respective distributions of those variables in levels are heavily skewed.13We scale the logarithm by +1 to circumvent the issue of 0 downloads. This approach is commonplace in the empirical literature. As mentioned earlier, we estimate the regression equations separately for Apple and Google.
The main coefficient of interest is  , in particular its sign. It is intended to capture the effect of platform app entry on outcome variables. Section 3 describes how we interpret ; otherwise, we have no a priori expectation about its sign.
Tables 5.1 – 5.4 show the results of estimating Equation 5.1. In each of these tables, the even-numbered columns contain results for the full regression equation, while odd columns show results without the rating control variable, for reference. The coefficients shown are for and  for regressions on global number of downloads, US number of downloads, monthly active users, and number of monthly updates. For regression on number of new apps in a category, we use average ratings rather than app-specific ratings as the control variable because the dependent variable is measured at the category level, not the app level.
In Tables 5.1 and 5.2, we summarize the effects on demand metrics for the Apple and Google platforms, respectively. The first two columns in each table show results with the global number of downloads as the dependent variable. We find that the launch of Apple apps was followed by a statistically significant 7% increase in downloads of apps in the same category. On the other hand, we fail to find a statistically significant change in demand for Google. When looking at the effects on US downloads in columns 3 and 4, we find no statistically significant effects on either platform. Finally, columns 5 and 6 show the results for monthly active users globally. Because the global active users variable is only available for apps that meet a certain threshold in number of downloads (i.e., apps that are “sufficiently big”), these results may suffer from selection bias, and should be interpreted as reflecting more popular apps.14The sample selection is also visible in the reduction in number of observations. There is a fairly large positive effect for Apple, but the estimate is too noisy to be statistically significant. Google shows a statistically significant –5% effect, which implies a reduction in users of more popular apps in the relevant category on the Play Store.
Table 5.1. Demand Effects of Apple Apps
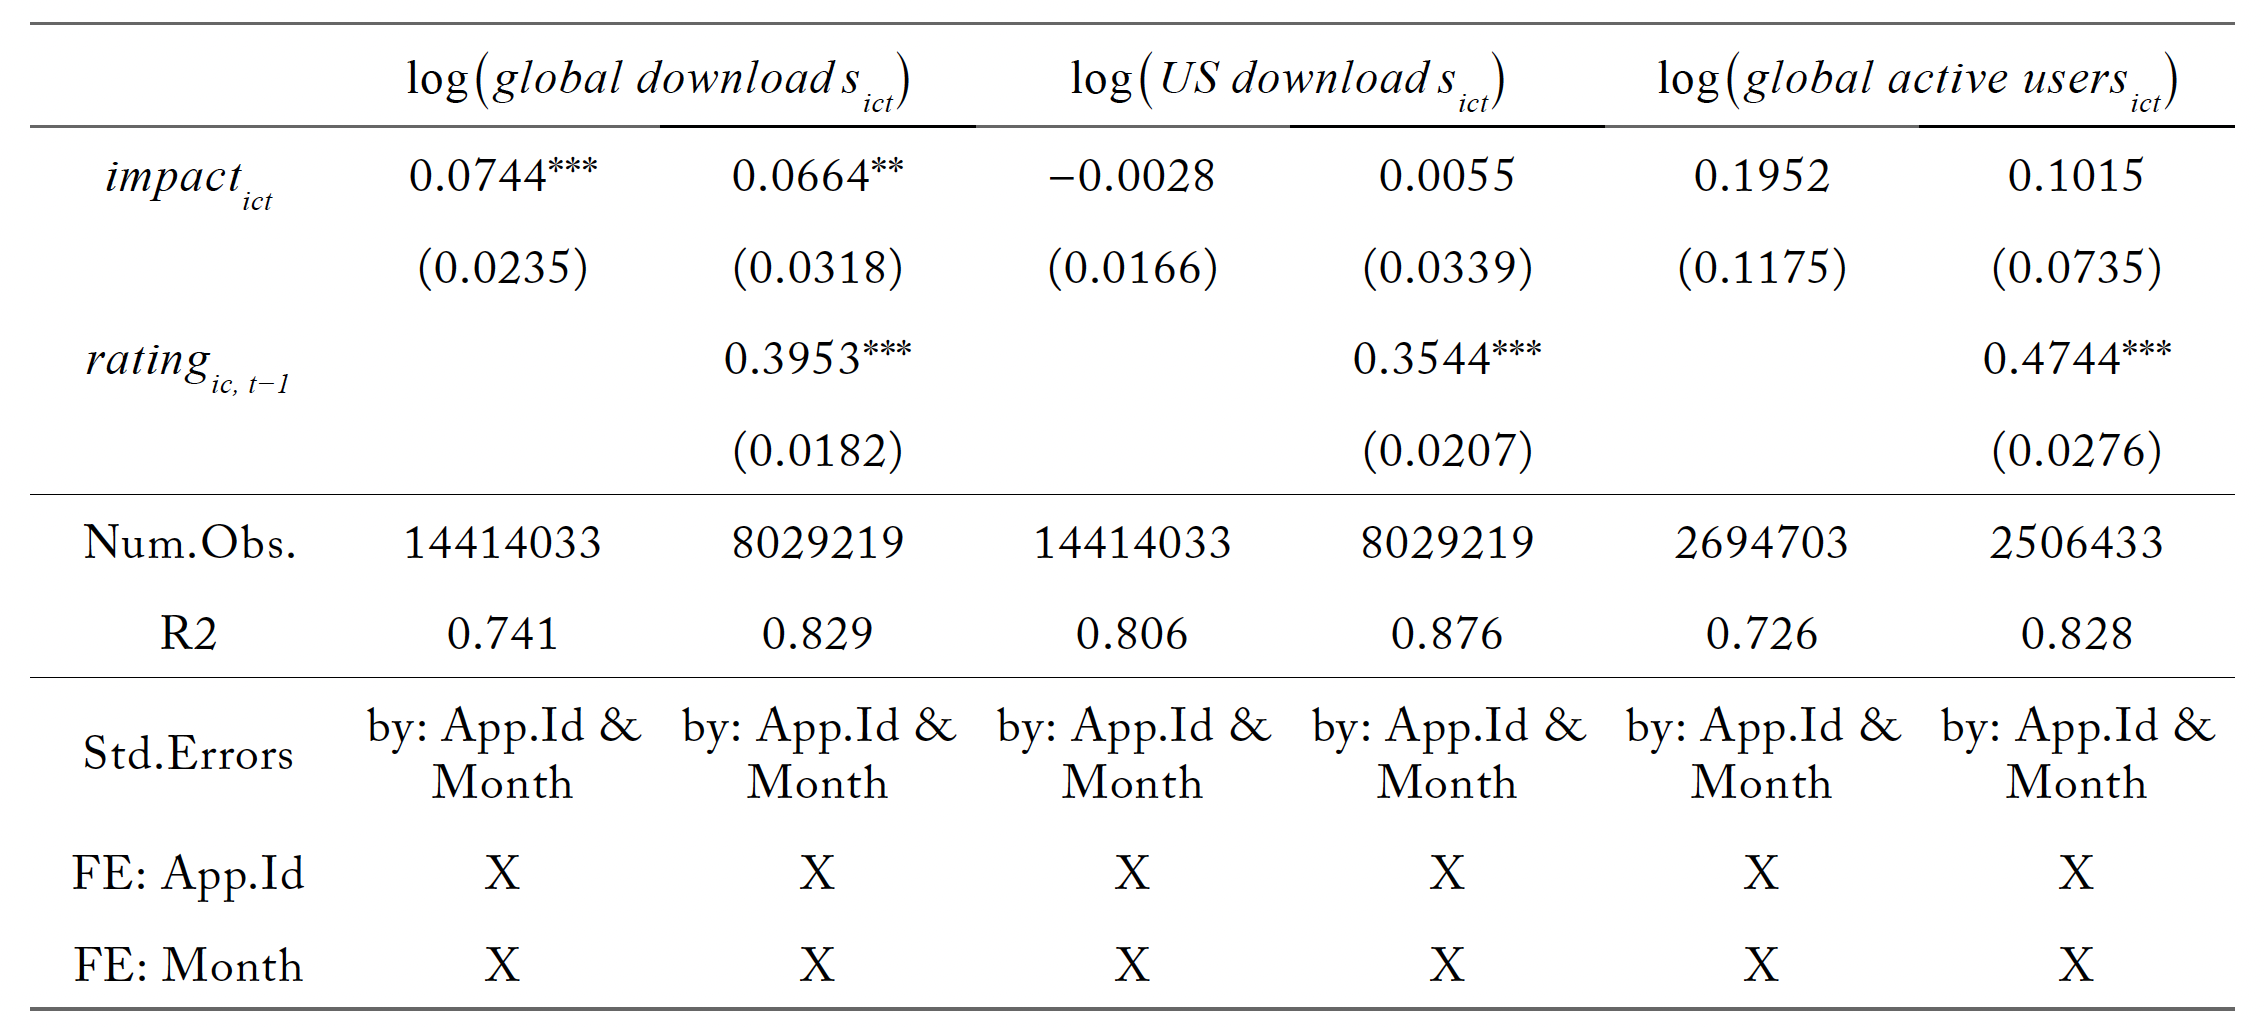
* p < 0.1, ** p < 0.05, *** p < 0.01
Table 5.2. Demand Effects of Google Apps

* p < 0.1, ** p < 0.05, *** p < 0.01
Given these results, we reject the spillover hypothesis. While we cannot specifically reject it applying only to Apple, we know of no evidence that iPhone users are different from Android users in this way.
Regarding Apple, we reject the suppression hypothesis and fail to reject the quality hypothesis on a global basis. Because these results apply only to all users globally, but not to US users specifically, we cannot say that this is definitive evidence that Apple improves its App Store, iOS, or iPhone quality in response to providing its own apps, but our findings support that conclusion. Also, because our findings are for apps within the same categories as the Apple apps and not limited to actual rivals, we cannot say that Apple does not seek to hinder specific rivals, but we find no evidence to support a conclusion of suppression by Apple. In other words, our results are average effects. It may well be that there is heterogeneity of responses, across countries, across affected categories, and within affected categories. Since the accusations against Apple cited in Section 3 were general conclusions, not specific to particular apps, they cannot be supported by the outcomes of our analysis.
It is curious that we find that the addition of Apple apps appears to stimulate downloads, but not numbers of users. We address this in our discussion of the regression on app updates.
Regarding Google, we reject the quality hypothesis and fail to reject the suppression hypothesis. That the negative effect is on numbers of users and not on downloads, it appears that the effect of the addition of Google apps leads users to quit using apps they already have, but newcomers to the Play Store and those moving up to a new Android phone continue to download these third-party apps. As a result, even though we cannot reject the hypothesis that Google engages in suppression, the pattern in Table 5.2 appears more consistent with a substitution effect than a suppression effect because app developers do not respond to Google by leaving the market, implying that they believe that they can compete (Table 5.4).
Tables 5.3 and 5.4 summarize our findings regarding innovation and entry effects for Apple and Google respectively. Columns (1) and (2) show results for number of updates by apps in the same categories as the platform app entry, while columns (3) and (4) show results for new entry in the relevant categories.15The noticeable difference in number of observations between the first two columns and the last two columns is due to the first two regressions being at app-month level, while the latter two are at category-month level. Since the dependent variables in tables 5.3 and 5.4 are count variables, we performed robustness checks using nonlinear specifications (Poisson regression and negative binomial regression). Results were qualitatively similar. They are available from the authors upon request. On the Apple platform, there is a slight, but statistically significant, increase in the number of updates per app. There is also an increase in new apps entering: about 20 more apps would enter a category in which an Apple app has been recently launched. The uptick in app updates is consistent with our findings in Table 5.1 that the launch of an Apple app stimulates rivals’ downloads, but not their numbers of users, as an update means that existing users would need to download the update. The stimulus of updates is also consistent with the notion that Apple apps lead others to increase their quality and innovation.
Table 5.3. Effects of Apple Apps on Innovation and Entry
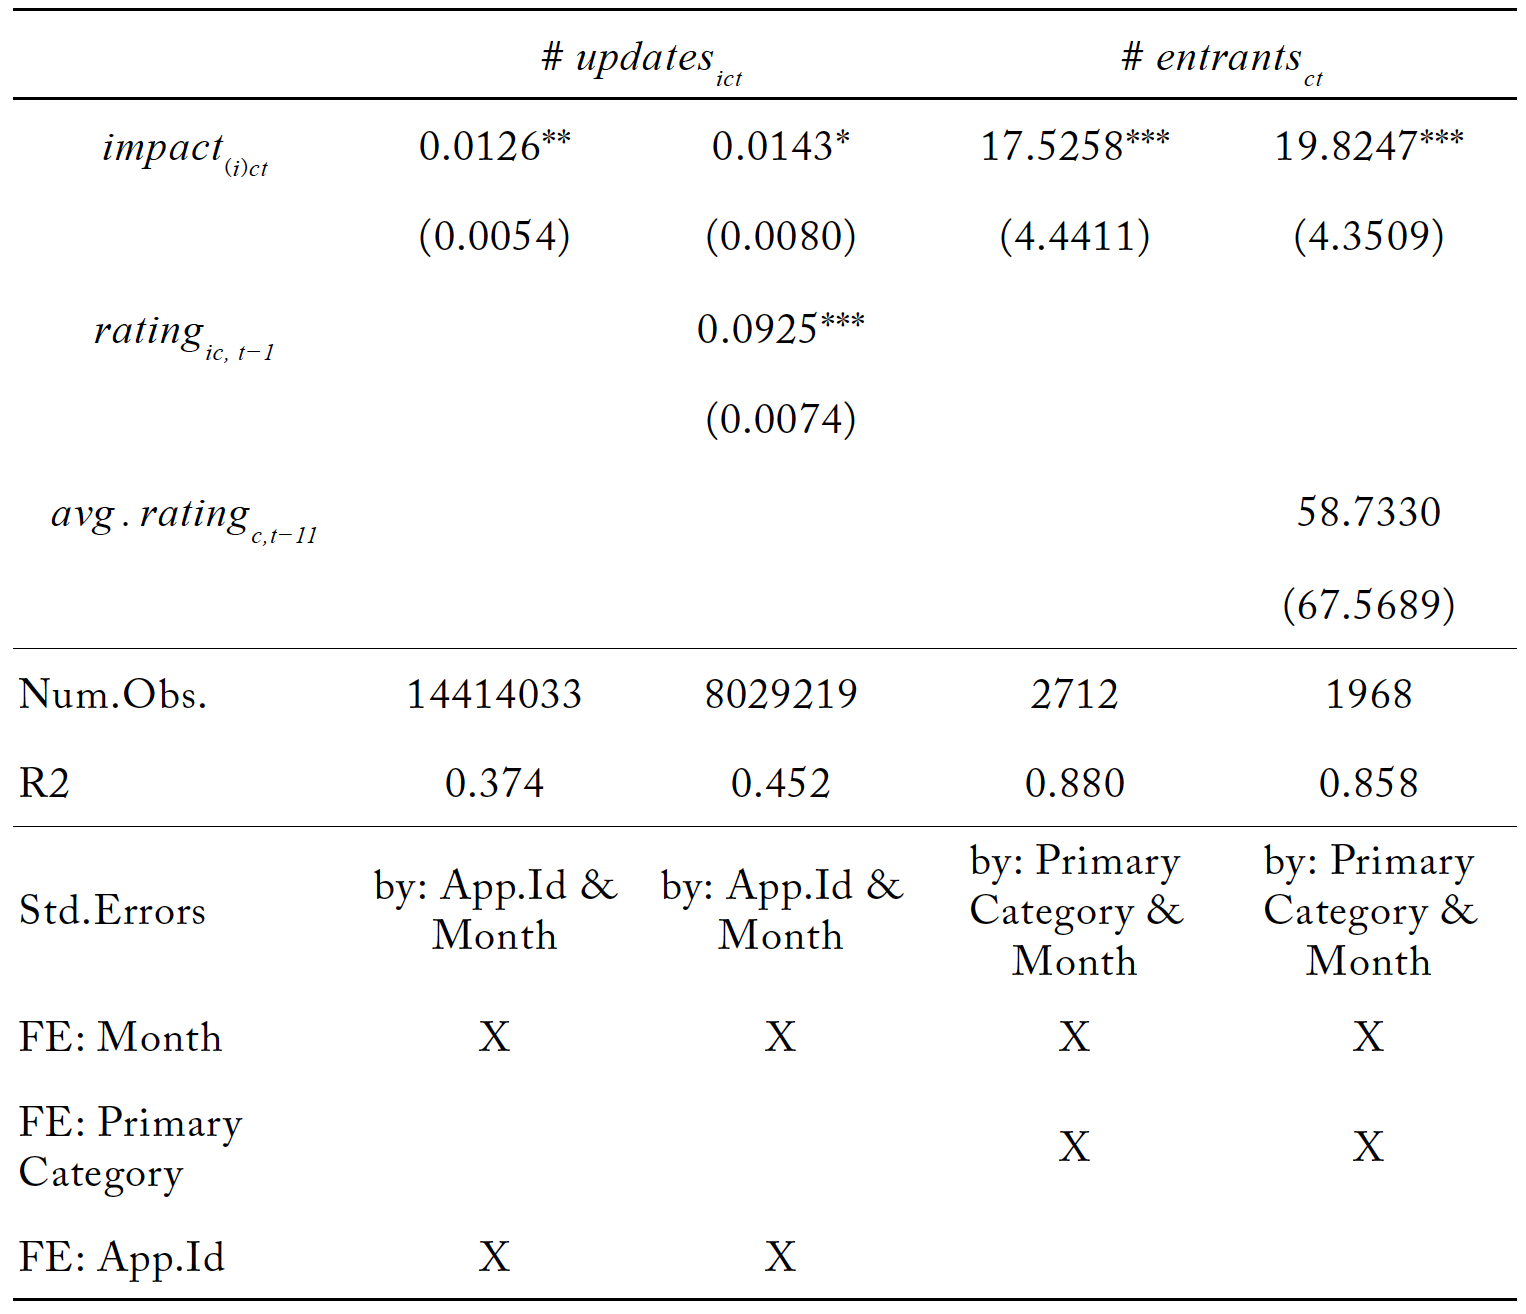
* p < 0.1, ** p < 0.05, *** p < 0.01
The increase in the number of entrants when Apple introduces an app implies that app developers view the App Store, iOS platform, and iPhone as providing them with increased profit potential. This is consistent with our earlier rejection of the suppression hypothesis and failure to reject the quality hypothesis. It appears that Apple’s increased activity in its App Store is correlated with increased profit potential for other app developers.
Table 5.4. Effects of Google Apps on Innovation and Entry
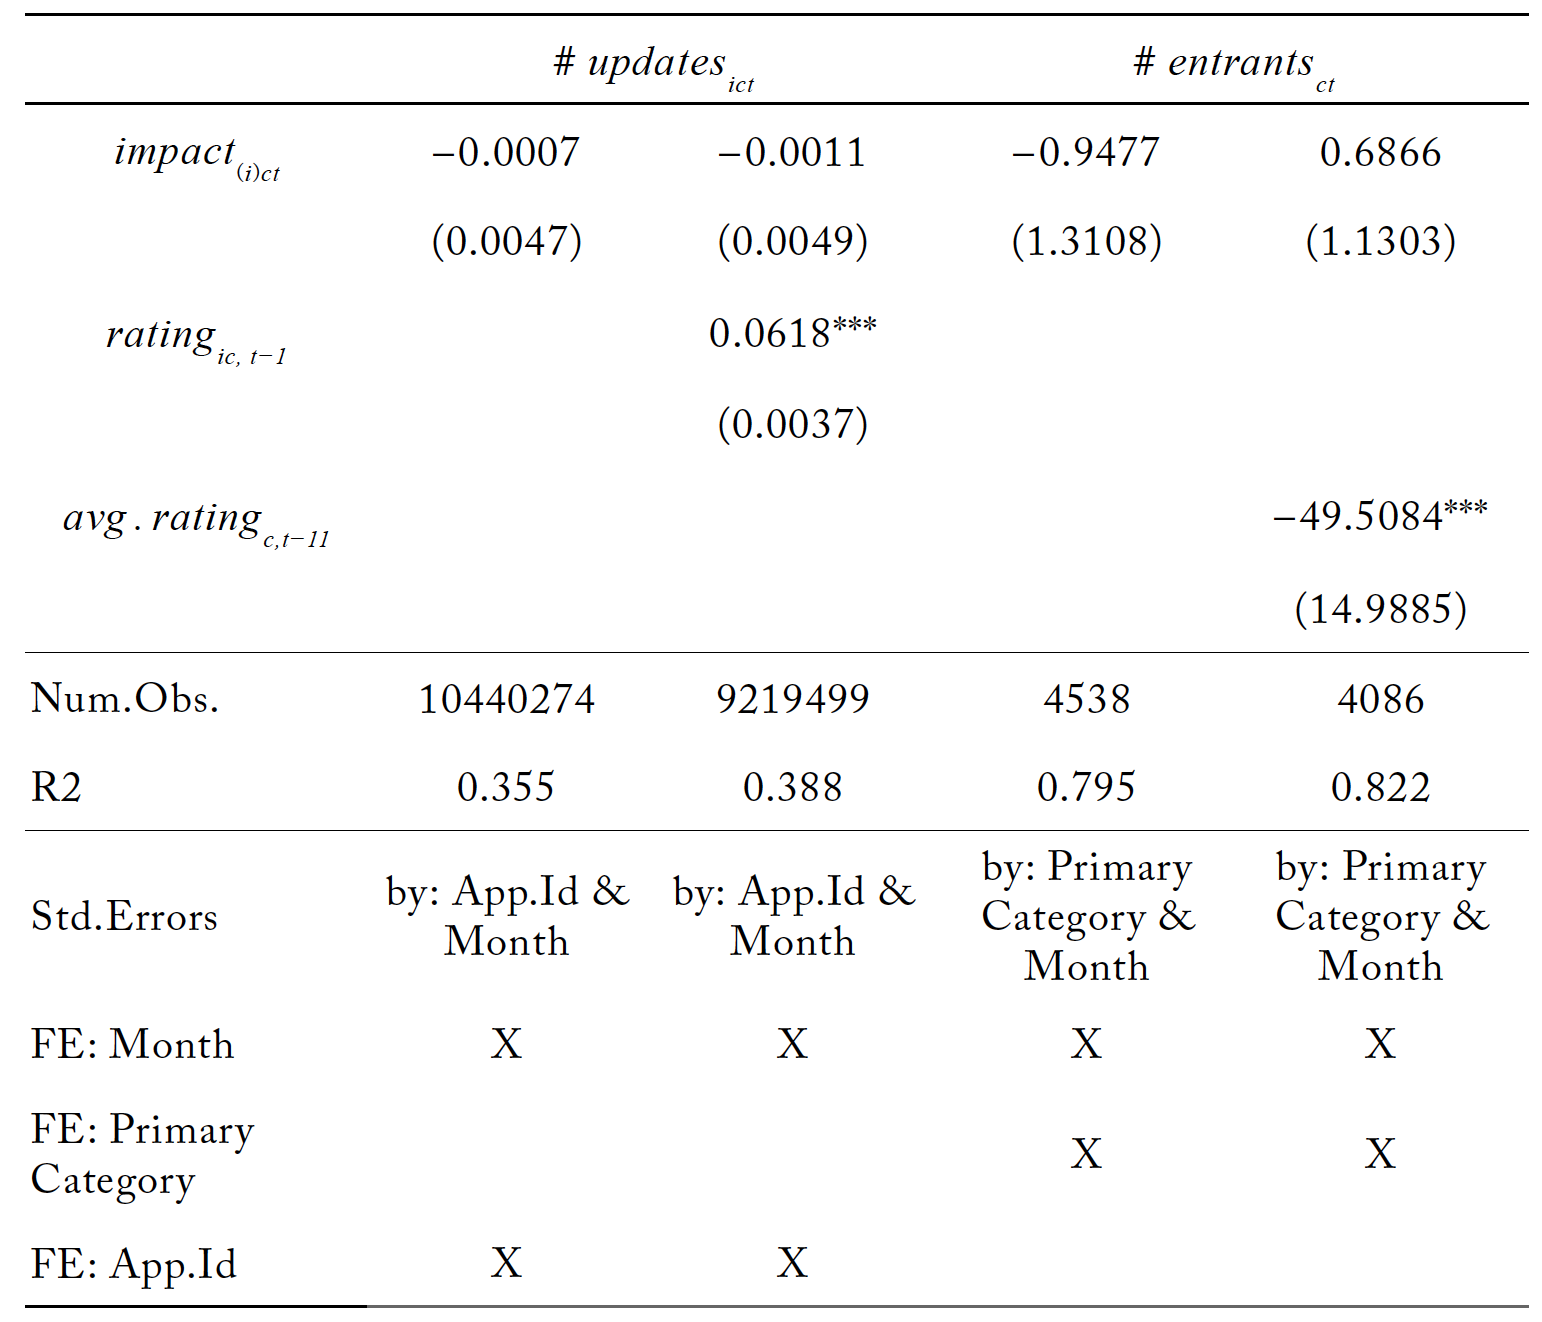
* p < 0.1, ** p < 0.05, *** p < 0.01
The corresponding results for Google are all statistically indistinguishable from zero. This is consistent with our earlier rejection of the quality hypothesis, as it does not appear that Google app entry stimulates rivals to improve quality or innovate. These findings inform our conclusions regarding the suppression and quality hypotheses: if rivals thought that Google rivalry would lead to the platform suppressing their businesses, we would expect negative impacts on entry. The same would be true if the rivals viewed Google’s apps as meaningful substitutes for their apps. This leads us to conclude that the evidence for suppression from Google is weak.
Our findings provide lessons for those advocating that Apple be required to allow rival app stores and sideloading. We find no empirical support for the theory that Apple’s tighter controls on apps harms rivals and consumers. Indeed, we find evidence that the opposite is true.
Although our analysis reveals different developer responses on the two platform ecosystems, our model is insufficient to provide a justification for these differences. One of several possible explanations consistent with our results is that the contrasting business models of Apple and Google create different dynamics in each ecosystem. Given its device-centric and security-oriented focus, Apple relies less on advertising for its revenues than Google, whose revenue is mostly ad-driven.16About 80% of Google’s revenue comes from advertising, “Google: Distribution of Revenue by Segment 2022,” Statista, accessed July 10, 2023, https://www.statista.com/statistics/1093781/distribution-of-googles-revenues-by-segment/; while about 80% of Apple’s revenue originates from device sales, “Apple Sales Revenue Share by Product 2012-2023,” Statista, accessed July 10, 2023, https://www.statista.com/statistics/382260/segments-share-revenue-of-apple/. Consequently, Apple should have a higher incentive to invest in the quality of its app platform than Google, and is possibly doing so by introducing its own apps that enhance the platform experience for both, third-party developers and consumers. We leave it to future research to test whether this theory is correct.
6 Summary
Our research attempts to shed light on the consequences of platforms’ direct participation as a supplier in their own marketplaces. Specifically, we do so in the context of mobile applications. We conclude that the platform’s apps do not provide spillover effects. And we find only weak evidence for platforms sabotaging rivals, but the evidence is limited to Google and to Google’s apparent impact on the number of users of rival apps. Google’s introduction of its apps appears to have no impact on user downloads of rival apps nor on entry by other app developers, implying that Google has little effect on its rivals.
In contrast, we find evidence that Apple has positive impacts on app developers. More specifically, the introduction of Apple apps appears to lead others to update their apps, leading to higher quality and innovation. Also, the provision of Apple apps appears to have a positive impact on the entry into its App Store, implying that Apple improves the quality of its platform to the benefit of consumers and app providers. Our evidence is not conclusive in that we do not find statistical significance for regressions limited to US users nor for the number of people using popular rival apps.
It is not immediately clear why there would be a different effect for global downloads and US downloads for Apple. This finding points towards a heterogeneity of responses across countries. The heterogeneity might result from different regulatory environments, from different relative market shares of platforms across countries, different levels of market saturation, or some other factors. Unfortunately, we do not observe data on the number of downloads by country (other than the United States), so this question necessarily falls beyond the scope of our paper.
Of interest is also the divergence of results between Apple and Google. These differences might be because of category definitions (Apple identifies 25 categories, while Google has 52) or differences in the number of apps launched (Apple has 30 apps, while Google has 114), perhaps implying that Google’s apps have smaller effects at the margin. The differences might also be due to variances in the characteristics of the platforms’ user bases or, as discussed towards the end of the previous section, due to different incentives of each platform. These questions should be examined in future research.
Recently there has been an intensive public debate about whether digital platforms should be allowed to sell apps in their own marketplace. An often-mentioned argument against platform participation, is that platforms are able to abuse their position by means of self-preferencing, that is, promoting their own products over third-party providers. One aspect of this matter is whether players do in fact engage in such practices. Another is whether and to what extent self-preferencing can be harmful to consumers or competition. Self-preferencing has been most commonly associated with the case of Amazon, but other platforms may not be immune from this phenomenon.
While we are unable to directly test for self-preferencing in this study, we find little to no evidence of negative effects of platform participation. Therefore, we conclude that a policy that bars platforms from direct participation in the mobile application market seems unsupported by the evidence. Future research should examine targeted self-preferencing.
References
Bee Dagum, E., & Bianconcini, S. (2016). Seasonal Adjustment Methods and Real Time Trend-Cycle Estimation. Springer International Publishing. https://doi.org/10.1007/978-3-319-31822-6.
Blumenthal, R. (2021, August 11). Blumenthal, Blackburn & Klobuchar Introduce Bipartisan Antitrust Legislation to Promote App Store Competition [Press Release]. U.S. Senator Richard Blumenthal of Connecticut. https://www.blumenthal.senate.gov/newsroom/press/release/blumenthal-blackburn-and-klobuchar-introduce-bipartisan-antitrust-legislation-to-promote-app-store-competition.
Bresnahan, T., Orsini, J., & Yin, P.-L. (2014). Platform Choice by Mobile App Developers. NBER Working Paper. https://wwws.law.northwestern.edu/research-faculty/clbe/events/internet/documents/yin_multihoming%20v12py.pdf.
Congressional Research Service. (2022). The Open App Markets Act. CRS Legal Sidebar. https://crsreports.congress.gov/product/pdf/LSB/LSB10752/2.
Deutscher, E. (2021). Google Shopping and the Quest for a Legal Test for Self-preferencing Under Article 102 TFEU [Text/html,PDF]. European Papers – A Journal on Law and Integration, 2021 6, 13451361. https://doi.org/10.15166/2499-8249/528.
Dube, J. H. (2022). Amazon Private Brands: Self-Preferencing vs Traditional Retailing. SSRN Electronic Journal. https://doi.org/10.2139/ssrn.4205988.
Ershov, D. (2022). Competing with Superstars in the Mobile App Market. Unpublished manuscript, last modified March 22, 2022. PDF file. https://drive.google.com/file/d/1xst6SPBR9taDLbiPa__XtaG5eF5ojTVZ/view.
Farronato, C., Fradkin, A., & MacKay, A. (2023). Self-Preferencing at Amazon: Evidence from Search Rankings. AEA Papers and Proceedings, 113, 239–243. https://doi.org/10.1257/pandp.20231068.
Foerderer, J., Kude, T., Mithas, S., & Heinzl, A. (2018). Does Platform Owner’s Entry Crowd Out Innovation? Evidence from Google Photos. Information Systems Research, 29(2), 444–460. https://doi.org/10.1287/isre.2018.0787.
Ford, G. S., & Stern, M. (2022). Retail Platform Bias? SSRN Electronic Journal. https://doi.org/10.2139/ssrn.4159849.
Hagiu, A., Teh, T., & Wright, J. (2022). Should platforms be allowed to sell on their own marketplaces? The RAND Journal of Economics, 53(2), 297–327. https://doi.org/10.1111/1756-2171.12408.
Jamison, M. A., & Wang, P. (2021). Valuation of digital goods during the coronavirus outbreak in the United States. Telecommunications Policy, 45(5), 102126. https://doi.org/10.1016/j.telpol.2021.102126.
Kesler, R., Kummer, M., & Schulte, P. (2017). User Data, Market Power and Innovation in Online Markets: Evidence from the Mobile App Industry.
Lee, K. H., & Musolff, L. (2021). Entry Into Two-Sided Markets Shaped by Platform-Guided Search. Working Paper. https://lmusolff.github.io/papers/Entry_and_Platform_Guided_Search.pdf.
Liu, Y. (2017). Mobile App Platform Choice. SSRN Electronic Journal. https://doi.org/10.2139/ssrn.2910986.
Open App Markets Act, S. 2710, Senate, 117, 15 U.S.C. 1114 (2022). https://www.govinfo.gov/app/details/BILLS-117s2710rs.
The Netherlands Authority for Consumers & Markets. (2019). Market study into mobile app stores (ACM/18/032693). https://www.acm.nl/sites/default/files/documents/2019-04/marktstudies-appstores.pdf.
U.S. House. Committee of the Judiciary. (2022). Investigation of competition in digital markets: Majority staff report and recommendations. https://www.govinfo.gov/content/pkg/CPRT-117HPRT47832/pdf/CPRT-117HPRT47832.pdf.
Wen, W., & Zhu, F. (2019). Threat of platform‐owner entry and complementor responses: Evidence from the mobile app market. Strategic Management Journal, 40(9), 1336–1367. https://doi.org/10.1002/smj.3031.
Zennyo, Y. (2022). Platform Encroachment and Own‐Content Bias. The Journal of Industrial Economics, 70(3), 684–710. https://doi.org/10.1111/joie.12301.
Zhu, F. (2019). Friends or foes? Examining platform owners’ entry into complementors’ spaces: ZHU. Journal of Economics & Management Strategy, 28(1), 23–28. https://doi.org/10.1111/jems.12303.
Zhu, F., & Liu, Q. (2018). Competing with complementors: An empirical look at Amazon.com. Strategic Management Journal, 39(10), 2618–2642. https://doi.org/10.1002/smj.2932.