
 Truth on the Market
Inflation is a top policy concern for Americans, and for good reason.1Carroll Doherty and Vianney Gómez, “By a Wide Margin, Americans View Inflation as the Top Problem Facing the Country Today,” Pew Research Center, May 12, 2022, https://www.pewresearch.org/fact-tank/2022/05/12/by-a-wide-margin-americans-view-inflation-as-the-top-problem-facing-the-country-today). When President Biden took office in January 2021, inflation was holding steady at 1.4%. But by June 2022, the inflation rate skyrocketed to 9%—a level not seen since 1981. As of this writing, inflation remains near 7%.2US Bureau of Labor Statistics, “Consumer Price Index for All Urban Consumers: All Items in US City Average,” FRED, Federal Reserve Bank of St. Louis, https://fred.stlouisfed.org/series/CPIAUCSL. Covid-related supply chain problems were (and continue to be) a contributor to high prices across the globe. However, another significant contributor to excess inflation in the United States is the “fiscally-induced inflation” caused by the trillions in government spending injected into the US economy over the past two years, which has produced sizable increases in both disposable income and the money supply.3John H. Cochrane, “Fiscal Histories,” Journal of Economic Perspectives 36, no. 4 (November 2022): 125–46, https://doi.org/10.1257/jep.36.4.125; disposable income data available at US Bureau of Economic Analysis, “Real Disposable Personal Income,” FRED, Federal Reserve Bank of St. Louis, https://fred.stlouisfed.org/series/DSPIC96; money supply data available at Board of Governors of the Federal Reserve System (US), “M1,” FRED, Federal Reserve Bank of St. Louis, https://fred.stlouisfed.org/series/WM1NS. See also Melissa De Witte, “What Causes Inflation?,” Stanford News, September 6, 2022, https://news.stanford.edu/2022/09/06/what-causes-inflation/; According to Patrick Harker, CEO of the Federal Reserve Bank of Philadelphia, “A global pandemic, a war in Europe, and, yes, fiscal and monetary policy decisions have combined to limit supply and boost demand. The result has been inflation running at 40-year highs.” Patrick T. Harker, “Inflation: What Caused It and What to Do about It,” Federal Reserve Bank of Philadelphia, October 20, 2022, https://www.philadelphiafed.org/the-economy/monetary-policy/221020-greater-vineland-chamber-of-commerce; According to Scott Wolla, economic education specialist at the Federal Reserve Bank of St. Louis, “Inflation is caused when the money supply in an economy grows at faster rate than the economy’s ability to produce goods and services.” Scott Wolla, “Money and Inflation—The Feducation Video Series,” Federal Reserve Bank of St. Louis, https://www.stlouisfed.org/education/feducation-video-series/episode-1-money-and-inflation)). Inflation data in other nations is available at “Prices – Inflation (CPI) – OECD Data,” accessed February 21, 2023, https://data.oecd.org/price/inflation-cpi.htm.
Prices rise when too much money chases too few goods. Empirical analysis by economists at the Federal Reserve estimate that the high inflation in the US relative to peer nations is explained by the United States’ higher government spending on social programs during the Covid pandemic. Specifically, the American Rescue Plan Act of 2021 (ARP) “resulted in an unprecedented injection of direct assistance with a relatively short duration.”4Òscar Jordà, Celeste Liu, Fernanda Nechio, and Fabián Rivera-Reyes, “Why is US Inflation Higher than in Other Countries?” Federal Reserve Bank of San Francisco, FRBSF Economic Letters, March 28, 2022, https://www.frbsf.org/economic-research/publications/economic-letter/2022/march/why-is-us-inflation-higher-than-in-other-countries); Obama-era economists Lawrence Summers and Jason Furman warned that high inflation would result from massive government spending packages in times of low unemployment and supply constraints. These warnings proved prescient. See also Jorge Jraissati, “Why America’s Inflation Is Worse Than Europe’s, and What To Do about It,” Public Discourse, July 31, 2022, https://www.thepublicdiscourse.com/2022/07/83410; A. Alvin Powell, “Larry Summers on Inflation, the Fed, the Year Ahead,” Harvard Gazette, February 4, 2022, https://news.harvard.edu/gazette/story/2022/02/pandemic-only-partly-to-blame-for-record-inflation-says-lawrence-summers; Eric Uhlfelder, “Economist Jason Furman Explains How Inflation Snuck Up on Us and What’s Ahead in 2022,” RIA Intel, February 24, 2022, https://www.riaintel.com/article/2aucrzsa72lr93ypli4g0/the-big-question/economist-jason-furman-explains-how-inflation-snuck-up-on-us-and-whats-ahead-in-2022.
Several scapegoats have been offered for rising prices, with one being price hikes by firms operating in concentrated markets (e.g., the oil industry, drug makers, meatpackers, and internet service providers).5Jim. Geraghty, “The Long-Term Problem with Responding to a Crisis with Scapegoating,” National Review, July 3, 2022, https://www.nationalreview.com/corner/the-long-term-problem-with-responding-to-a-crisis-with-scapegoating); Bruce Yandle, “Biden’s Inflation Scapegoat is ‘Profiteering,’” Reason, September 29, 2021, https://reason.com/2021/09/29/bidens-inflation-scapegoat-is-profiteering). Economist Hal Singer argues that market power (industry concentration) is a key contributor to the nation’s inflation woes, claiming that high inflation provides cover for concentrated industries to raise prices through tacit collusion.6Lynn Parramore and Hal Singer, “How Corporations ‘Get Away With Murder’ to Inflate Prices on Rent, Food, and Electricity,” Institute for New Economic Thinking, October 19, 2022, https://www.ineteconomics.org/perspectives/blog/how-corporations-get-away-with-murder-to-inflate-prices-on-rent-food-and-electricity); Hal Singer, “Antitrust Should Be Used to Fight Inflation,” The American Prospect, February 2, 2022, https://prospect.org/economy/antitrust-should-be-used-to-fight-inflation). Historically, the relationship between concentration and prices is referred to as the Administered Price Thesis. See George J. Stigler and James K. Kindahl, The Behavior of Industrial Prices, New York 1970; Gardiner C. Means, “The Administered-Price Thesis Reconfirmed,” American Economic Review 62 (1972): 292–306.
Attributing price increases on high industry concentration has become a pretext for the Biden administration to call for both aggressive antitrust enforcement and expansive new economic regulation by the Federal Trade Commission (FTC).7“Executive Order on Promoting Competition in the American Economy,” The White House: President Joseph Biden, July 09, 2021, https://www.whitehouse.gov/briefing-room/presidential-actions/2021/07/09/executive-order-on-promoting-competition-in-the-american-economy). Lina Khan, FTC Chair, is taking up this charge.8See Lawrence J. Spiwak, “A Change in Direction for the Federal Trade Commission?” Federalist Society Review 22 (2021), https://fedsoc.org/commentary/publications/a-change-in-direction-for-the-federal-trade-commission); Lawrence J. Spiwak, Biting Off More Than It Can Chew? Some Thoughts on the FTC’s Advance Notice of Proposed Rulemaking on “Commercial Surveillance and Data Security,” Phoenix Center Policy Bulletin No. 59 (September 2022), https://www.phoenix-center.org/PolicyBulletin/PCPB59Final.pdf); Lawrence J. Spiwak, Pushing the Bounds of Judicial Deference: Some Thoughts on The FTC’s New Unfair Methods of Competition Policy Statement, Phoenix Center Policy Bulletin No. 63 (January 2023), https://phoenix-center.org/PolicyBulletin/PCPB63Final.pdf). There are some obvious problems with this economic argument, however. Coordinating pricing, explicitly or tacitly, would seem more difficult during times of economic chaos.9There is some evidence of coordinated activity during economic downturns. See, e.g., Jeffrey D. Martino and Darley Maw, Cartels as Crisis Management: Why Collusion May Be Inevitable During Economic Downturns, CPI Antitrust Chronicle (November 2020): https://www.competitionpolicyinternational.com/wp-content/uploads/2020/11/4-Cartels-as-Crisis-Management-Why-Collusion-May-Be-Inevitable-During-Economic-Downturns-By-Jeffrey-Martino.pdf. Likewise, supply constraints make even competitive industries behave in ways that look monopolistic, because output expansions and entry are precluded by the lack of necessary inputs, including labor.10Some analysis of concentration and monetary policy is provided in David M. Arseneau, “The Inflation Tax in an Open Economy with Imperfect Competition,” Review of Economic Dynamics 10 (January 2007): 126-147, https://doi.org/10.1016/j.red.2006.08.004; Richard W. Evans, “Is Openness Inflationary? Policy Commitment and Imperfect Competition,” Journal of Macroeconomics 34 (2012), pp. 1095-1110, https://doi.org/10.1016/j.jmacro.2012.05.002.
In this paper, I consider the question of market power and inflation by analyzing trends in the Producer Price Index (PPI) for several hundred industries defined by a six-digit North American Industry Classification System (NAICS) code.11There are several studies looking at the relationship between concentration and the PPI, including Ryo Kato, Tatsushi Okuda, and Takayuki Tsuruga, “Sectoral Inflation Persistence, Market Concentration, and Imperfect Common Knowledge,” Journal of Economic Behavior & Organization 192 (December 1, 2021): 500–517, https://doi.org/10.1016/j.jebo.2021.10.026; Falk Bräuning, José L. Fillat, and Gustavo Joaquim “Cost-Price Relationships in a Concentrated Economy,” Current Policy Perspectives 2022 Series, Federal Reserve Bank of Boston, May 23, 2022, https://www.bostonfed.org/publications/current-policy-perspectives/2022/cost-price-relationships-in-a-concentrated-economy.aspx). The data span from 2015 through February 2022 (the latter marking the Russian invasion of Ukraine and the decoupling of the Russian economy). The PPI data are linked to the four-firm concentration ratio (CR4) for each industry from the 2017 Economic Census, the latest data available. The analysis compares the change in prices during the Covid shutdowns and after President Biden’s inauguration when inflation rose rapidly.12There are several limitations to this analysis, including a fixed concentration figure dated in 2017. Inflation is measured by the PPI, based on wholesale prices, rather than the CPI, which is based on retail prices. The statistical analysis does not include data on several perhaps important factors, including the elasticity of supply by industry. More research needs to be and is being done, but this analysis is a somewhat straightforward approach to the issue and produces plausible results. I find no evidence that prices rose more in highly concentrated industries during either the heat of the pandemic or Biden’s tenure as president.13Similar results, using different methods and time periods, are reported in Fred Ashton, “No Evidence of Link Between Market Concentration and Producer Price Inflation,” American Action Foru, June 29, 2022, https://www.americanactionforum.org/research/no-evidence-of-link-between-market-concentration-and-producer-price-inflation). As such, more concrete evidence of actual collusion is required to justify FTC intervention in markets.14“Executive Order on Promoting Competition in the American Economy,” The White House; see also Policy Statement Regarding the Scope of Unfair Methods of Competition Under Section 5 of the Federal Trade Commission Act, Federal Trade Commission, November 10, 2022, https://www.ftc.gov/system/files/ftc_gov/pdf/P221202Section5PolicyStatement.pdf).
Data
PPI data are collected from the US Bureau of Labor Statistics at the six-digit NAICS code over the 2014–2022 period.15Data available at: www.bls.gov. The data used here are obtained from https://db.nomics.world using the “Industry Data” code (PC). Data for the petroleum industries is excluded from the sample as prices for oil and gas were extremely volatile during this period.16The NAICS codes excluded are: 211120, 211130, 325110, 221210, and 324110. Inflation determined from these data is computed using a one-year percentage change in the PPI. Thus, the final sample spans 2015 through February 2022, the latter date marking the Russian invasion of Ukraine and the subsequent decoupling of the Russian economy.
Note that the PPI is different from the Consumer Price Index (CPI), the latter typically used in the reporting of inflation numbers. The CPI measures the prices paid by consumers, while the PPI measures the price received by producers, usually in wholesale transactions. To link the concentration of producers in industries to prices, the PPI is the better representation of price changes (and concentration data cannot be linked directly to CPI data). Inflation measured by the two indexes are highly correlated. Over this period, the correlation coefficient is 0.95.17See “From PPI to CPI,” FRED, Federal Reserve Bank of St. Louis, April 12, 2021, https://fredblog.stlouisfed.org/2021/04/from-ppi-to-cpi). PPI inflation is, however, larger than CPI inflation in recent years, and some research suggests that the PPI and CPI are only weakly related over short time periods.18Jessie Romero, “Producers Under Pressure? What Role Do Producer’s Costs Play in Determining Inflation,” Econ Focus, Second Quarter (2018), https://www.richmondfed.org/publications/research/econ_focus/2018/q2/feature1).
Concentration statistics for six-digit NAICS codes in 2017 are obtained from the latest-available Economic Census (a rolling five-year survey).19“From PPI to CPI,” FRED. The concentration statistic used here is the four-firm concentration ratio (CR4), which equals the market share of the four largest firms in the industry. Merging the two datasets provides a balanced sample of 465 six-digit industries with nearly eight years of monthly data (86 months).
It is feasible to use the five categories for analysis, though only 23 industries are in the “very high” group. As an alternative, industries are divided into three groups based on the CR4 using Bain’s criteria summarized in table 1. Most of the analysis is based on these three groups:
- Low-concentration group (< 35%)
- Moderate-concentration group (35%–65%)
- High-concentration group (≥ 65%).20Joe S. Bain, Industrial Organization, New York: Wiley, 1959. I have grouped Bain’s five groups into three to maintain adequate sample sizes. While the CR4 is a continuous variable, there is only one value per industry. Thus, the unique values operate somewhat like an industry fixed effect (there are 348 unique values for the 467 industries). Some grouping by the CR4 is thus required.
Results are also provided for the less aggregated concentration groups.
Examining Inflation and Concentration
My analysis divides the sample into three periods demarcated by the beginning of the Covid-19 epidemic (March 2020) and the first full month of the Biden administration (February 2021). The first, or pre-period, begins in January 2015 and ends in February 2020. I refer to the three periods as follows:
- Pre-period (period 0 from January 2015 to February 2020)
- Covid-19 interval (period 1 from March 2020 through February 2021)
- Biden period (period 2 from February 2021 through the end of the sample).
Much of the analysis focuses on the changes in the mean PPI-based inflation rates for a large group of industries (defined at the six-digit NAICS) between the pre-period (when inflation was unremarkable) and the latter two periods of material price volatility. Let inflation be  , where
  is one of three periods and
  the concentration group indicator with values low, moderate, and high
  . My primary difference measure is
  , which quantifies the change in inflation, in this particular case between the high-concentration group
  and the low-concentration group
  between the Biden period
  and the pre-period
  .21This statistic is akin to the difference-in-differences estimator, though I avoid the term since the estimator is not a causal estimator as the “treatment” is universally applied. Linear regression is used for hypothesis testing with standard errors that are robust to both arbitrary heteroskedasticity and arbitrary autocorrelation.
PPI Inflation Trends
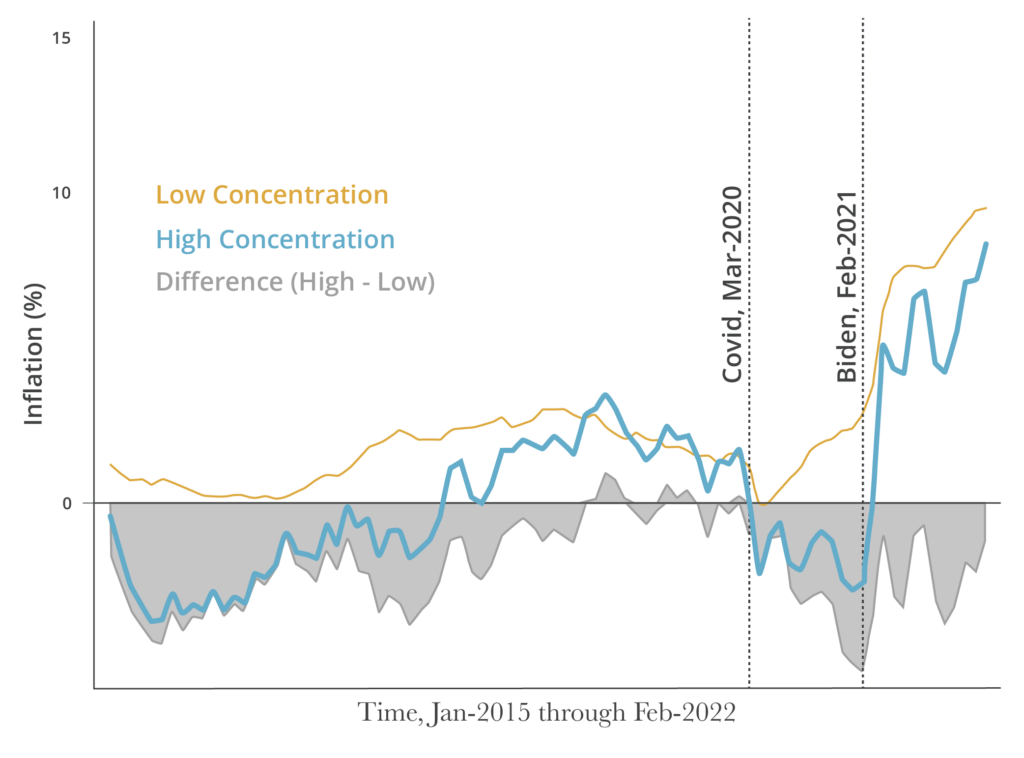
To begin, trends in inflation for the low and highly concentrated industries from the three-category grouping are illustrated in figure 1. The shaded area in the figure is the spread between the two series (higher minus lower concentration). Inflation rates for the high-concentration group are lower than the low-concentration group during the Covid interval and, to a lesser extent, during the Biden period (as shown by the shaded area). The figure does not suggest a meaningful difference in price increases between the two groups, with inflation in the high-concentration group remaining mostly below that of the low-concentration group. Statistical testing is conducted later in the paper.
Figure 1. Inflation Trends; Low & High Concentration
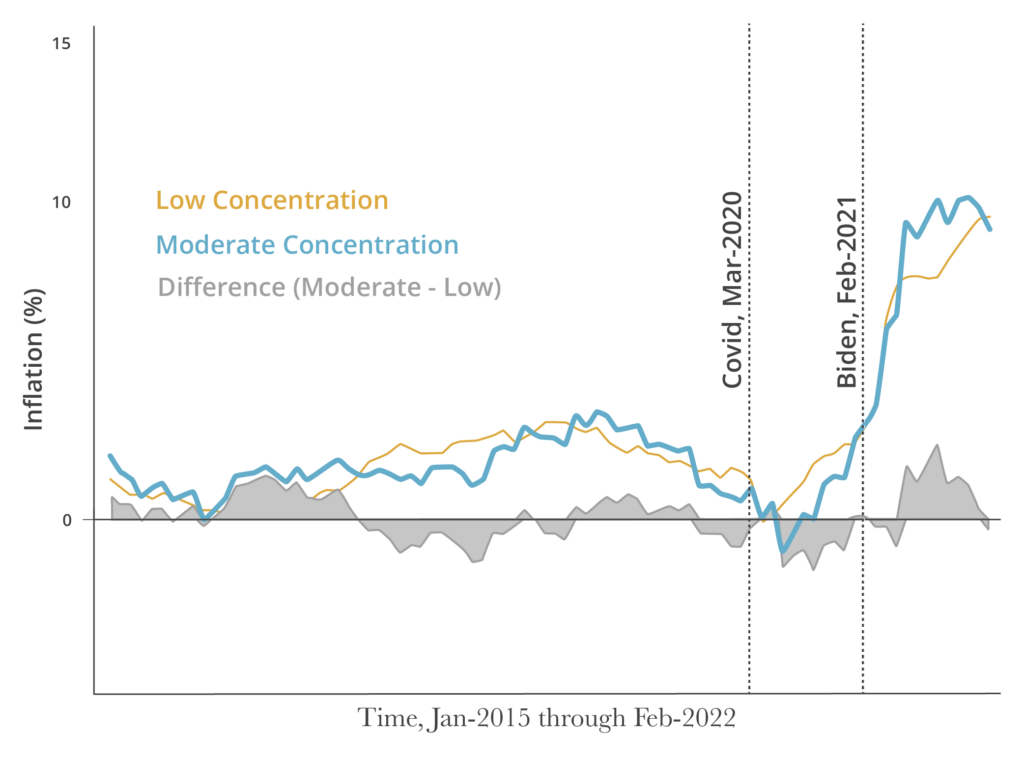
 In figure 2, the trends between the low and moderately concentrated group are illustrated. These trends are more closely related than are the low and high-concentration groups (as illustrated by the shaded areas). Inflation in the moderately concentrated group is slightly higher during the Biden period, but the spread is comparable to the pre-Covid interval (as detailed later with hypothesis testing).
Figure 2: Inflation Trends; Low & Moderate Concentration
From a graphical perspective, there appears to be no evidence of higher inflation in highly concentrated industries. In the next section, a statistical analysis is conducted to test for differences in mean inflation among the concentration groups.
Means Difference Analysis
In table 2, the mean inflation rates for the three periods and three concentration groups are summarized  . Prior to March 2020, inflation rates are low and near 1.6% for the low and moderate-concentration groups, but near zero for the high-concentration group. Inflation is statistically equal between the low and moderate-concentration groups
  . Inflation for the high-concentration group is much lower than the low-concentration group (-1.80 percentage points,
  ). The difference is statistically significant.
During the Covid-19 interval, mean inflation rates remain relatively table for the low-concentration group (falling 0.29 percentage points,  ), but larger declines are observed in moderate and high-concentration groups (-1.07 and -1.26 percentage points,
  and ). For the latter two groups, the inflation rates (0.60 and -1.49) are statistically different from zero. Their changes from the pre-period are also statistically different from zero. The Covid-19 pandemic had more meaningful effects on industries in the moderate and high-concentration groups than it did for the low-concentration group.
During the Biden administration as the nation emerged from Covid-19 lockdowns, inflation rose sharply across the board. In the low-concentration group, inflation during the Biden period rises to 7.33%, an increase of 5.75 percentage points ( ). Similarly, mean inflation rates for the moderate and high-concentration groups are 8.06% and 4.71%, respectively. The increase in mean inflation for the moderate concentration group (
 ) is comparable to the low-concentration group (6.39 versus 5.75 percentage points). The difference in these changes for the two groups from the pre-period is relatively small (0.73 percentage points, \left(p_{2 M}-p_{0 M}\right)-\left(p_{2 L}-p_{0 L}\right)).
The difference in the mean inflation rate during the Biden period between the high and low-concentration groups  is more substantial (-2.62 percentage points) and statistically different from zero. The difference in the differences in inflation rates between the Biden period and the pre-period
 ![\left[\left(p_{2 H}-p_{0 H}\right)-\left(p_{2 L}-p_{0 L}\right)\right]](https://www.thecgo.org/wp-content/ql-cache/quicklatex.com-172b351051e5ebea6149da9a1c60b40b_l3.svg "Rendered by QuickLaTeX.com") are 0.64 [= 0.73 – 0.09] for the moderate-concentration group and -0.82 [= (-2.62) – (‑1.80)] for the high-concentration group, though neither is statistically different from zero.
are 0.64 [= 0.73 – 0.09] for the moderate-concentration group and -0.82 [= (-2.62) – (‑1.80)] for the high-concentration group, though neither is statistically different from zero.
These results suggest inflation and industry concentration are largely unrelated. With the inflation rate in the highest concentration group being well below that of the low-concentration group, it appears that high concentration is not a contributor to the higher inflation in recent months.
Alternative Samples
When looking at the CPI, it is common to exclude food and energy prices in what are called “core inflation.” I mimic that practice here by excluding the remaining energy (petroleum industries were already excluded from the sample) and food industries (i.e., core inflation) from the PPI data. Results are summarized in table 3. For the low and moderate-concentration groups, the results are mostly comparable to those in table 2.
The most significant change from table 1 is that inflation spread between the high and low-concentration groups is larger (increasing to -3.74 percentage points, a statistically significant difference). Consequently, the difference in the differences in inflation between the high and low-concentration groups between the pre-period and the Biden period has increased (-1.65 versus -0.82).
The comparison of mean inflation may also be influenced by outliers.22Looking at the largest 10% of inflation values during the Biden period, the NAICS are evenly distributed across concentration groups (low 10.4%, moderate 9.8%, and high 10%). Two approaches are used to address such extreme values. First, the data is winsorized at the upper 5% tail.23Winsorizing is used in statistics to deal with outliers in a dataset and may involve replacing extreme values with more typical values so that the statistics are more representative of the bulk of the data. Alternately, trimming or truncation eliminates the extreme observations. Here, winsorizing replaces extreme values with the next value counting inwards from the extremes (that is, values above the 95% tail are replaced with the mean value at the 95% tail). See Vic Barnett and Toby Lewis, Outliers in Statistical Data, Boston: Wiley, 1994. These results are summarized in table 4. As expected, the mean inflation rates during the Biden period are smaller when the data is winsorized. Aside from that difference, the results are mostly comparable to the full sample: The low and moderate-concentration groups have comparable inflation over time, but the high-concentration group has lower inflation during the Biden period. Again, inflation increased by less in the high-concentration group than the low-concentration group.
The second approach to address extreme value is median regression, where the regression is centered on the median rather than the mean. Results are presented in table 5. Relative to table 4, the largest differences are for the high-concentration group, where the mean inflation rates are larger than in table 4 for all three periods. Still, during the Biden period the mean inflation in the high-concentration group is lower than that of the low-concentration group.
Overall, these data do not support the claim of relatively higher inflation in more concentrated industries. Increases in the prices are generally comparable across the concentration groups. There is strong evidence to reject the claim that high prices broadly provide some type of cover for firms in more highly concentrated industries to raise prices. Concentration, it appears, is not driving inflation, at least as measured by the PPI.
Five Concentration Groups
In table 6, I conduct the same analysis using the five-category grouping of concentration. The low-concentration group is unchanged from table 1, while the moderate-low and moderate-high groups are portions of the moderate group from table 1, and the high and very high groups are portions of the high-concentration group from table 1.
Breaking apart the high-concentration group does offer some additional insights. For instance, the moderately high-concentration group has much higher inflation during the Biden period (10.54%) than the other groups, though the mean inflation rate is not statistically different from the low-concentration group (suggesting high variability in one or both groups). The spread between the pre-period and Biden period also has grown substantially (4.41 percentage points). This difference is statistically different from zero at the 10% level.
Inflation rates in the high and very high groups are much lower than the other groups during the Biden period and the two inflation rates are comparable (about 4.7%). This high-concentration group had much lower inflation during the Covid-19 Interval, while inflation was a bit higher for the very high group. The spread between the pre-period and the Biden period have widened for these two groups (-1.47 and -0.09), though neither difference is statistically different from zero. In all, the analysis of the PPI data indicate that, if anything, inflation is lower in the high-concentration groups, but this difference persists over time. It appears, at least from this data, that concentration is not to blame for high prices.
Synthetic Counterfactual
As shown in figures 1 and 2, the mean inflation rates across the concentration groups often do not follow similar trends. This disparity makes it difficult to visually interpret the differences in trends across time periods. As an alternative to using all the data from the groups, the synthetic difference-in-differences procedure (SDID) permits the construction of a counterfactual for the high-concentration group using data from the low-concentration group.24Dmitry Arkhangelsky, Susan Athey, David A. Hirshberg, Guido W. Imbens, and Stefan Wager, 2021, "Synthetic Difference-in-Differences." American Economic Review, 111 (12): 4088–4118, https://doi.org/10.1257/aer.20190159.
Normally, the SDID approach is intended to have a causal interpretation. Here it does not as the treatment period (the Biden period) applies to all industries. The SDID procedure is used to construct a weighted-average mean from the low-concentration group series where those weights are selected to provide the “best” fit to the high-concentration series during the pre-period and the Covid-19 interval. This weighted series is then extrapolated into the Biden period as a counterfactual. A hypothesis test of whether the actual high-concentration mean deviates materially from this counterfactual is determined by placebo effects.
Figure 3. Inflation Trends, Synthetic Counterfactual; Low & High Concentration
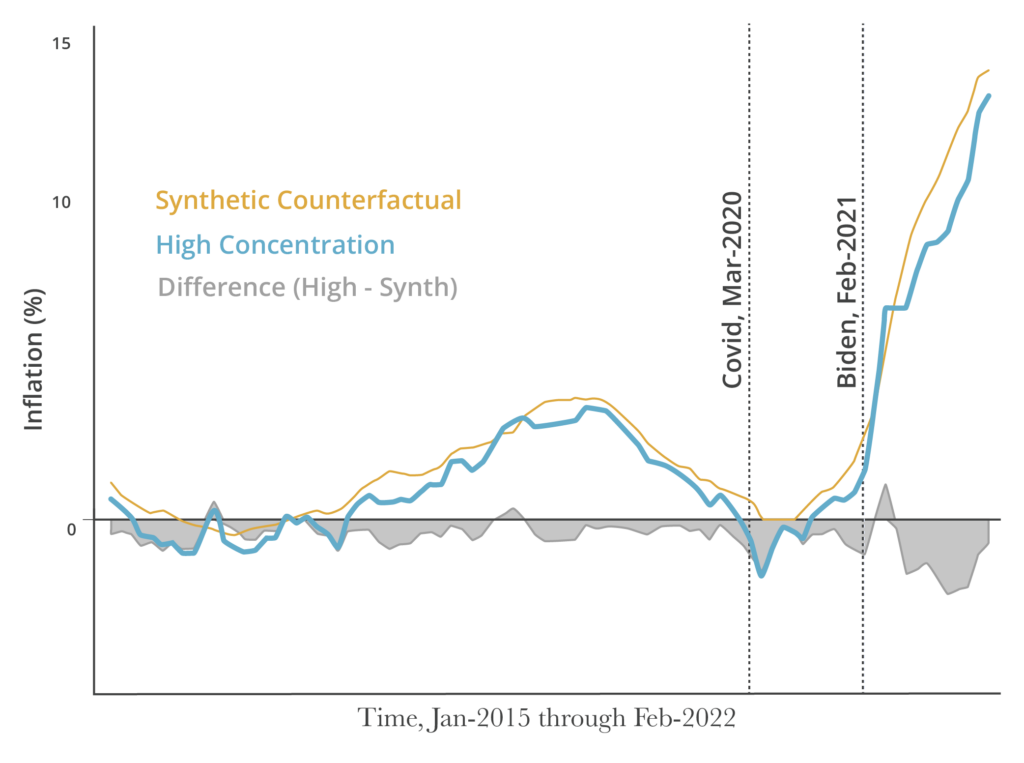
As seen in figure 3, the synthetic counterfactual provides an excellent fit for the high-concentration inflation series prior to the Biden period (i.e., compare the shaded areas in this figure to those of figure 1). This good fit extends into the Biden period (though the spread is more negative during the Biden period). There is no indication from this figure that inflation for the high-concentration group relative to the low-concentration group has changed. The null hypothesis of equality between the two series during the Biden period is not rejected (prob = 0.70) and the estimated means difference is -0.336.
The same procedure may be applied to the other concentration groups. The estimated means difference and their significance levels are provided in table 7. Effects are restricted to the Biden period in all cases. For all groupings, the effect sizes are small, and none are statistically different from zero. Consistent with the prior analysis, there is no evidence to suggest inflation is higher in high-concentration industries during the recent spell of very high inflation.
Conclusion
Inflation is one of many problems plaguing Americans these days. There are several first-order contributors to current inflation, mainly the massive deficit-spending by the US government occurring at precisely the wrong time (i.e., supply-side constraints, low unemployment, and the policies of the Federal Reserve Bank). Several second-order influences are being tossed around—some more valid than others. The analyses in this paper provide evidence that market concentration is not a determinant of current inflation. Using several modeling approaches to compare inflationary trends in hundreds of industries with varying degrees of market concentration, I find no evidence to support the claim that price increases are larger in highly-concentrated markets and thus providing an outsized contribution to inflation. If anything, inflation in the higher concentration industries during the Biden administration was slightly below that in the unconcentrated industries. Attempts to address inflation through antitrust and economic regulation are likely to impose more costs than benefits.