

Introduction
On January 13th, 2001, a category 7 earthquake struck El Salvador, killing thousands and destroying property worth half of El Salvador’s annual GDP (Lomnitz & Elizarrarás 2001). In response, the United States government provided undocumented Salvadoran nationals who were already in the United States before the earthquake with “Temporary Protected Status” (TPS)—a legal designation that protects recipients from deportation and provides them with authorization to work. While this status was initially provided for only 18 months, it has been renewed continuously since 2001. As a result, undocumented Salvadorans who entered the United States before the earthquakes have maintained a limited legal status for more than 20 years, while undocumented nationals of Guatemala, Mexico, and other neighboring countries have not received such amnesty. In this paper, we take advantage of the natural experiment provided by the sudden and unexpected extension of legal status to Salvadoran migrants to examine the long-term effect of legal status on the incomes, work, and asset ownership of recipients.
Understanding how temporary legalization affects the economic well-being of undocumented immigrants is of key importance to immigration policy. The United States has 40 million migrants, or one-fifth of the world’s migrant population, almost a quarter of whom are undocumented (Pew Research Center 2022). Since the late 1990s, controversy over whether to allow a pathway to legalization or citizenship for undocumented immigrants has been a major stumbling block for comprehensive immigration reform (Rosenblum 2011). In the absence of such reform,1The 1997 Nicaraguan Adjustment and Central American Relief Act (NACARA) and its counterpart, the 1998 Haitian Refugee Immigration Fairness Act, mark the last time that Congress either expanded or contracted legalization for a broad class of immigrants (Migration Policy Institute 2013). recent legalization policies have been administered through executive-branch programs like Deferred Action for Childhood Arrivals (DACA) and TPS. Because executive-branch programs are discretionary and reversible, it is increasingly important to understand whether temporary legalizations confer any economic benefits to recipients and how they compare with more permanent legalization programs.
We provide empirical evidence on the effects of temporary legalization by comparing Salvadoran nationals who benefitted from TPS to Guatemalans who would have benefitted from TPS had they been Salvadoran using an event study design. We employ individual-level data from the 2000 Decennial Census and the 2001–2019 American Community Survey (ACS) to estimate the effect of TPS on recipient income, employment, and assets.
This strategy rests on the assumption that, had TPS not been extended to Salvadoran nationals, Salvadorans would have experienced similar changes in outcomes over 20 years as did migrants from Guatemala. This assumption is uniquely plausible in this context because El Salvador and Guatemala are small Northern Triangle countries that share a border and are very similar in their history, economic development, and relationship to the United States. As documented in Section 2, migration from Guatemala and El Salvador has been driven by similar economic and political circumstances including violent civil war between US-backed rightwing dictatorships and Soviet-backed rebel groups, gang violence, and extreme poverty. As a consequence, Guatemalan and Salvadoran migrants were very similar prior to 2000 in their observed economic and demographic characteristics. Furthermore, prior to TPS, Salvadorans and Guatemalans had been treated identically by all previous immigration policies. Because TPS was extended to Salvadorans as a consequence of an unpredictable natural disaster, migrants could not have anticipated the policy change when deciding to migrate to the United States. Indeed, our work is unique in the immigrant legalization literature in using a comparison group that entered the US at the same time, and under the same rules, as the policy beneficiaries.
We validate our central assumption in several ways. We show that our results are robust to alternative comparison groups including Mexican migrants and a synthetic control group constructed from migrants of several Latin American countries. We address the possibility that a factor other than TPS affected the economic outcomes of Salvadorans by comparing TPS-eligible Salvadoran immigrants to late-arriving Salvadoran immigrants who were not eligible for TPS. Finally, we examine the possibility that our results are driven by changes in census response or return migration by showing that the age, education, and gender composition of TPS-eligible Salvadoran migrants does not change relative to the Guatemalan comparison group in the two decades following TPS.
We find that temporary legalization under TPS created significant economic benefits for eligible recipients and that those benefits grew over time. Five years after receiving TPS, we estimate that incomes of likely-eligible individuals had increased by $2,900 (a 14% increase). Twenty years after receiving TPS, this effect grew to $7,500 (a 35% increase).2We estimate that 70% of individuals identified as “likely eligible” in our sample were undocumented prior to receiving TPS. As a result, if the policy had no spillover effects on ineligible Salvadorans, the effects on TPS-eligible individuals are likely 40% larger than our estimates. Likewise, homeownership rates and rates of using a car increased after five years by 25% and 5%, respectively, with effects remaining stable over 15 years but declining somewhat by 20 years. Increases in income were driven both by an increase in employment of 7% and an increase in wages of 10%, on average. In addition, we find evidence that TPS allowed recipients to access higher quality jobs: Salvadoran immigrants experienced entry into higher-wage occupations, entry into occupations in which workers are more likely to hold government licenses, and reductions in self-employment. Our paper is the first to document these dynamic effects of legalization on fully undocumented immigrants by leveraging all available years of the ACS.
We contribute to a large, international literature on the economic effects of legalization on undocumented immigrants in two key ways:3See Kossoudji and Cobb-Clark (2002), Lozano and Sorensen (2011), or Amuedo-Dorantes and Bansak (2011) for analysis of the Immigration Reform and Control Act (IRCA); and see Kaushal (2006) for analysis of the Nicaraguan Adjustment and Central American Relief Act (NACARA). These studies are summarized in Appendix Table A.10. First, we extend the literature on legalization by examining a broader set of outcomes including measures of job quality and asset ownership. Importantly, we examine these outcomes over a longer time horizon than any previous work. Second, by providing robust, long-term estimates of the effects of temporary legalization, we show that temporary legalization has similar effects on earnings as do more permanent programs.
Our work builds on two previous studies of the effect of TPS on recipients. Orrenius and Zavodny (2015) use the 2005 and 2006 ACS to estimate the effect of TPS on the earnings and employment of Salvadoran immigrants. They use a difference-in-differences strategy that examines Salvadoran and Mexican immigrants who arrived immediately before or immediately after the granting of TPS and find that TPS increased earnings and employment for Salvadoran recipients four years after receipt of TPS. We contribute to this work by showing that these earnings benefits grew substantially in the following 15 years and that TPS increased home and car ownership as well as earnings. Menjívar (2017) conducted a survey of 302 predominantly Salvadoran TPS recipients, finding that 78% of respondents reported getting better job opportunities, 17% reported receiving a driver’s license, and 67% reported an increase in personal security within the first year of receiving TPS. Our findings validate her conclusions by showing that TPS recipients improved their earnings, job quality, and likelihood of driving relative to a comparison group.
Because TPS provides fewer rights and less security than did prior legalizations of undocumented immigrants like the Immigration Reform and Control Act (IRCA) or the Nicaraguan Adjustment and Central American Relief Act (NACARA), our work demonstrates that even provision of minimal legal rights has substantial benefits for undocumented immigrants. TPS is only granted for one year at a time, provides no pathway to permanent citizenship, does not provide eligibility for public assistance, and can be revoked unilaterally by the executive branch. Such “liminal legality” (Menjívar 2006) might be expected to affect labor supply and investment decisions differently than do permanent, non-discretionary legalizations. Specifically, TPS recipients may be less inclined to seek out higher-paying jobs compared to IRCA and NACARA recipients if their right to work can be rescinded at any point.
Despite the de jure limitations of TPS, we estimate income and wage effects of TPS that are close in magnitude to prior estimated effects of permanent legalization policies.4Appendix Table A.12. provides a comparison of the estimated effects from legalization policies across prior work employing difference-in-differences designs. For instance, Lozano and Sorensen (2011) find that the IRCA increased wages by nearly 20% among undocumented Mexicans after 10 years. Amuedo-Dorantes and Bansak (2011) find a similar effect of a 10–20% wage increase after five years, while Ibañez et. al. (2022) find 10–31% increase in income among Colombian migrants to Venezuela.
Our findings on the employment effects of TPS, however, differ from that of permanent legalization policies. Amuedo-Dorantes and Bansak (2011) and Kaushal (2006) both find that the IRCA and NACARA, respectively, decreased employment for lower-educated migrants. Prior work on temporary legalizations, including the DACA (Amuedo-Dorantes & Antman 2017; Orrenius & Zavodny 2015) more closely match our findings, showing a positive effect on employment rates. We attribute these differences to two factors. First, IRCA and NACARA, unlike TPS or DACA, conferred eligibility for welfare benefits. Thus, those programs may have had larger effects than temporary legalization on reservation wages. Second, the policy and labor market context of TPS in the early 2000’s differed from the context of IRCA and NACARA in the 1980s and 1990s. Specifically, the growth of E-Verify from 2005–2010 increased the difficulty of securing low wage jobs for undocumented immigrants. In this environment, work legalization policies like TPS may have had significantly more positive effects on employment compared to policies in the 1990s (Amuedo-Dorantes and Pozo 2019, Borjas 2017).
This paper proceeds as follows: Section 2 provides more detailed background on the origins of TPS and how it can impact recipient decisions on labor force participation or asset accumulation. This section also provides more details on the relevant migration history of Salvadorans and our justification for selecting Guatemalans as our primary control group. Section 3 discusses our data and empirical strategy. We discuss our results in Section 4 and provide several robustness checks and placebo tests in Section 5. Section 6 concludes.
Institutional Details
In March 2001, in response to a series of devastating earthquakes, the Bush Administration granted TPS to all undocumented Salvadoran immigrants who were living in the United States as of January of 2001, prior to the earthquakes. The policy impacted over 250,000 people, constituting 60% of all TPS-eligible immigrants (Congressional Research Service 2021). Due to rising violence and social instability in El Salvador, TPS has remained in effect for Salvadorans for the past 21 years.
Today, TPS remains an active policy instrument for the Department of Homeland Security.5Similar policies exist outside of the US. Australia’s Temporary Protection Visa provides the right to work and several federal welfare benefits to refugees fleeing persecution. The European Union’s Temporary Protection Directive confers access to employment, residence permits, and other social welfare assistance in cases of a mass influx of displaced persons from non-EU countries who are unable to return to their country of origin. Similar policies have also been implemented by the Spanish government in 2004 (Ibañez et al. 2002) as well as the Colombian government in 2018 (Monràs et al. 2018). In 2022 alone, the federal government granted TPS status to existing migrants from Afghanistan, Ukraine, and Cameroon as a result of violent conflict in these countries. Despite its intended use for short-term protection, eligible immigrants have maintained protected status for over nine years in almost one-third of the 26 cases where TPS was granted since 1990 (see figure 1).
Figure 1: Countries with Nationals Under Temporary Protected Status and their Policy Duration
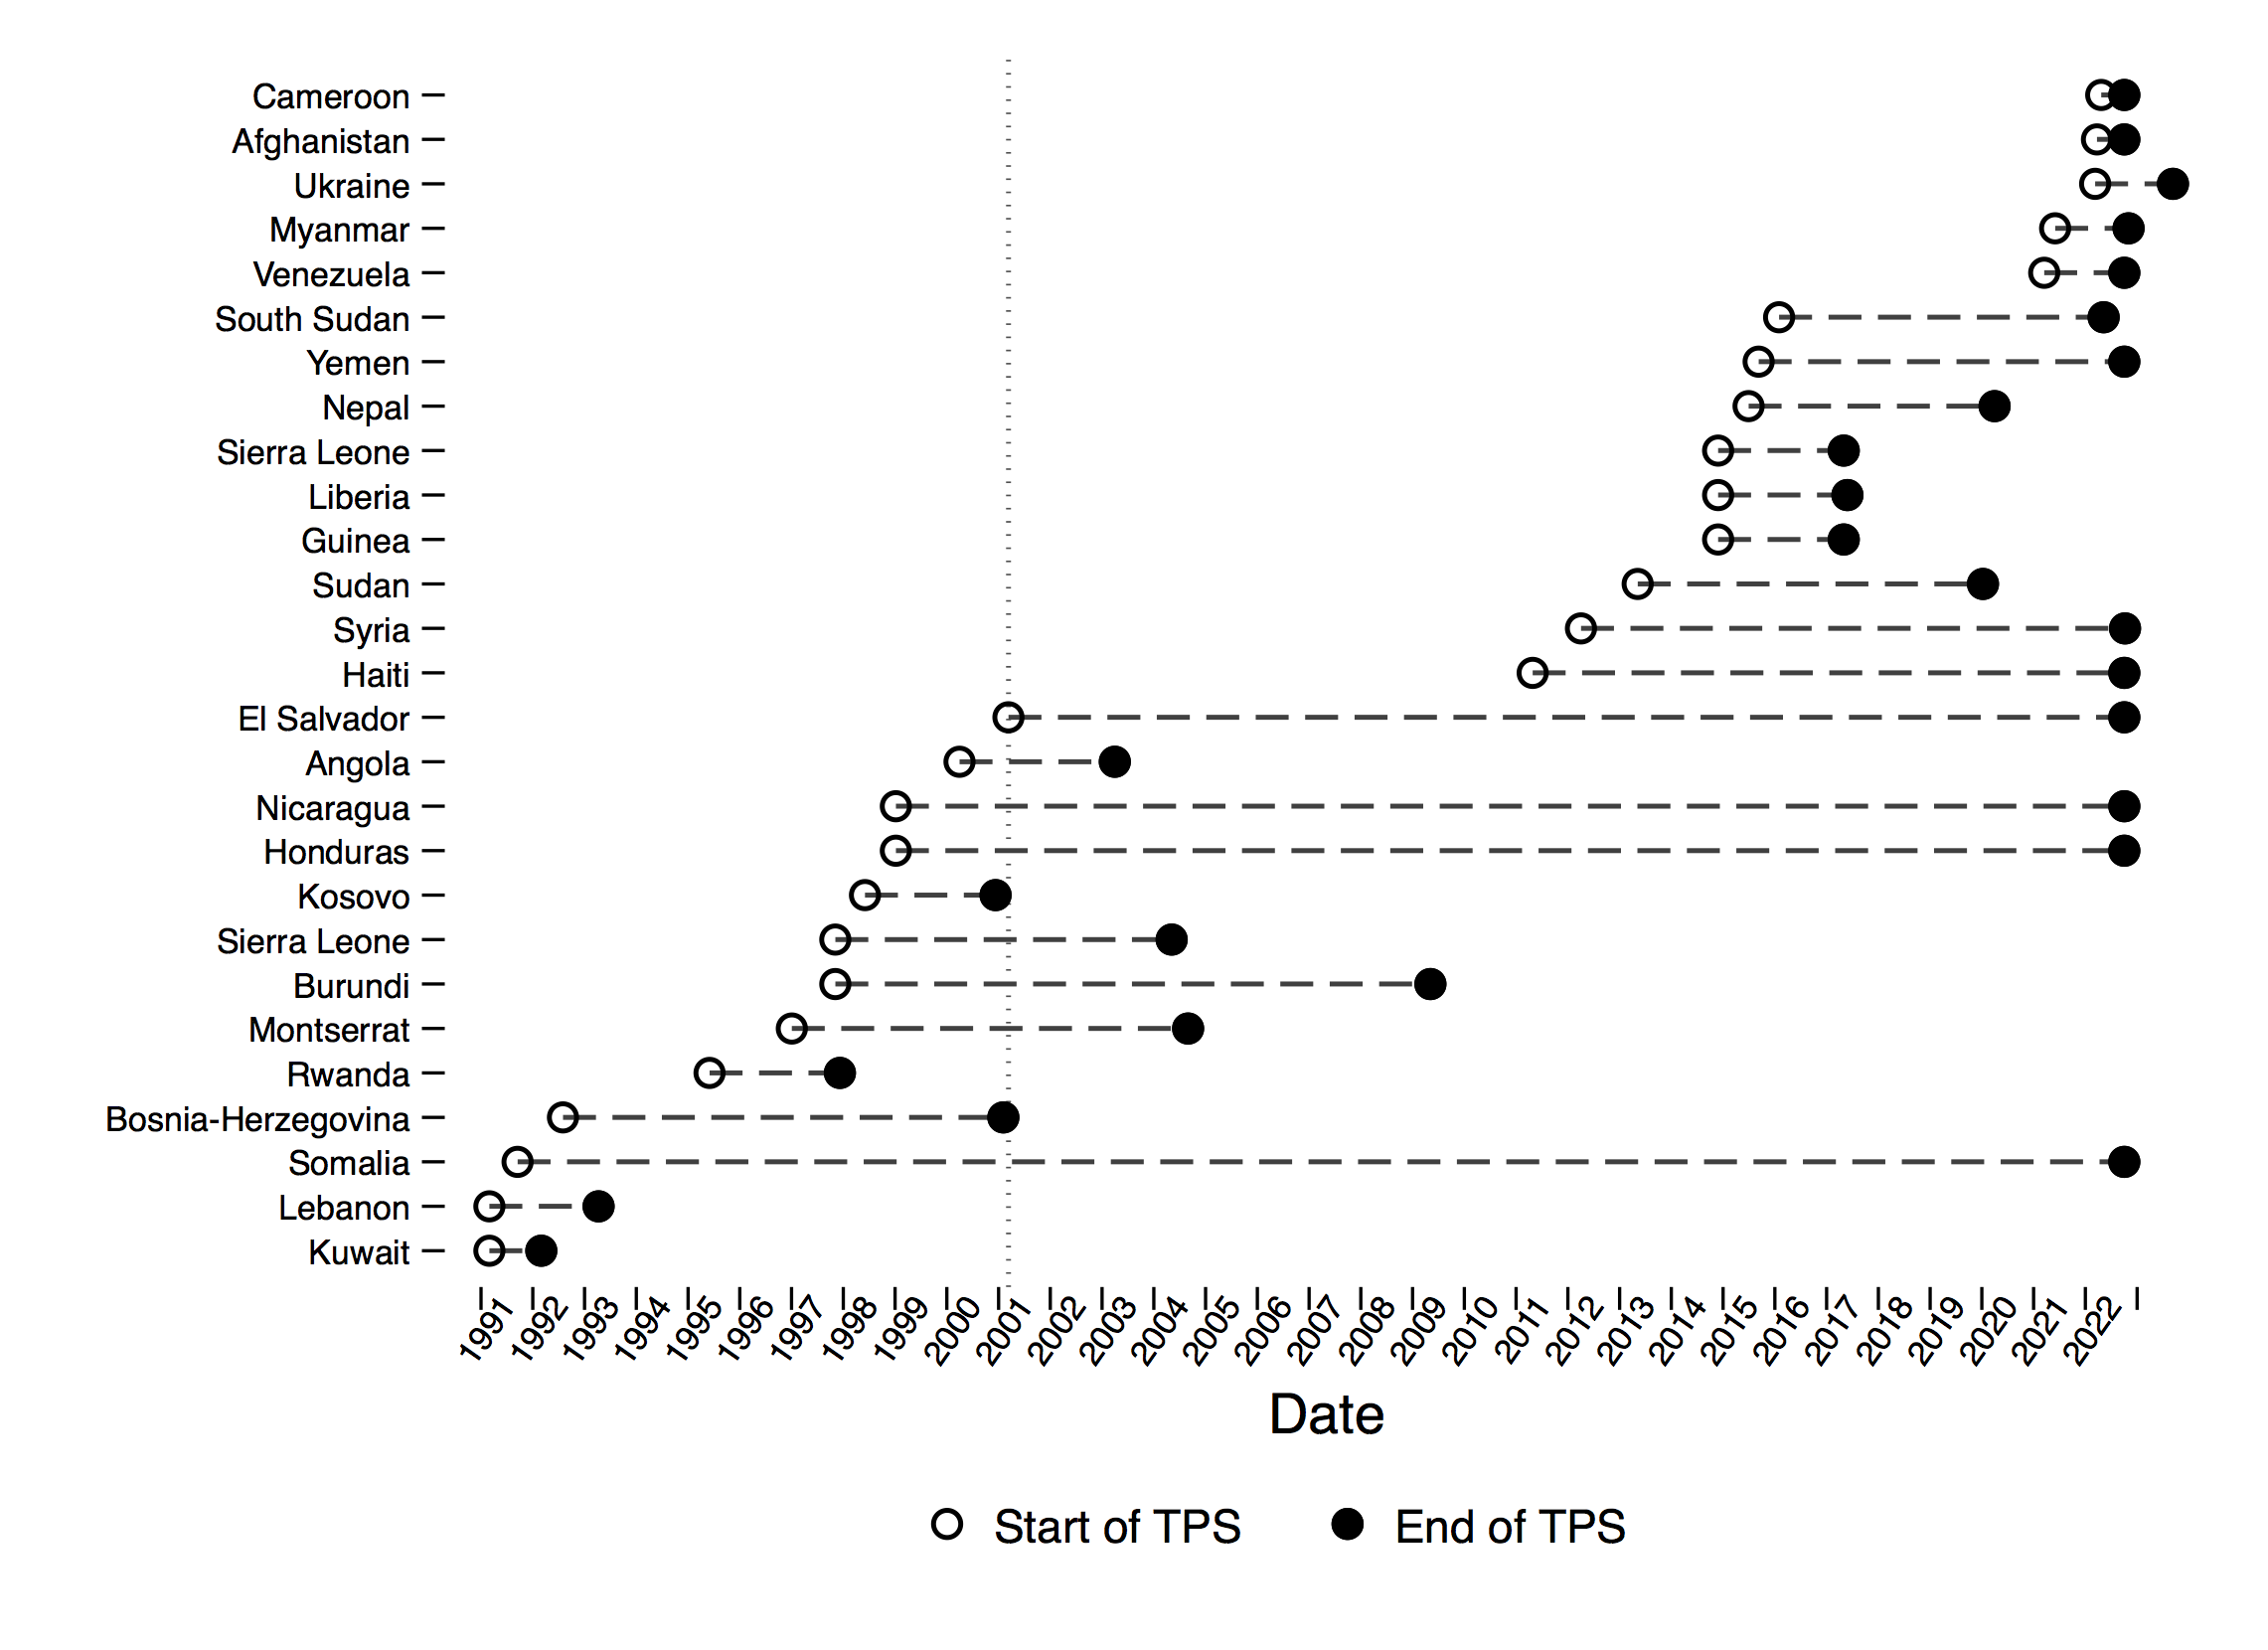
Notes: Figure 1 plots start and end dates of TPS across all countries with nationals that were, or currently are, eligible for TPS. Nationals from Somalia, Honduras, Nicaragua, El Salvador, Haiti, Yemen, Venezuela, Afghanistan, and Cameroon are all actively protected under TPS as of the date of this article. Dashed vertical line denotes the start of TPS for El Salvador in March of 2001. Source: Boundless.com “Temporary Protected Status, Explained” available from https://www.boundless.com/immigration-resources/temporary-protected-status/; Wikipedia.com “Temporary Protected Status” available from https://en.wikipedia.org/wiki/Temporary_protected_status.
This section provides further details on TPS and channels through which TPS might impact recipient behavior. These channels provide the motivation for our outcomes of interest, including income, employment, and access to driving, and homeownership. We then compare the migration history and settlement patterns of Salvadoran, Guatemalan, and Mexican migrants in order to highlight potential challenges to our empirical strategy.
Benefits and Limitations of TPS
Individuals granted TPS receive two main benefits: protection against deportation and authorization to work within the US for a limited period of time. There are several means through which these benefits could impact a person’s income or labor supply decisions. First, while labor force participation rates of undocumented workers are high (Borjas 2017), undocumented immigrants disproportionately work in low-paying, hazardous occupations (Donato and Massey 1993; Hall, Greenman, and Farkas 2010; Hersch and Viscusi 2010). Receiving TPS may increase the range of jobs available to formerly undocumented workers. They may be more likely to work and, conditional on working, be more likely to seek out higher paying or lower risk jobs. In addition, by removing the threat of deportation and expanding outside options, TPS may increase recipients’ bargaining power.
Second, TPS could affect income and investments by making it easier for recipients to obtain loans and government licenses. TPS allows recipients to apply for a Social Security number as well as a state-issued ID (PennDOT 2022; MassLegalHelp 2010). Both of these forms of identification are often necessary for obtaining assets like a mortgage loan, a property lease, a driver’s license, auto insurance, or a bank account. Among these asset types, we test how TPS impacts homeownership and the likelihood of driving to work. Both outcomes reflect substantial financial investments with the capacity to influence decisions on whether to enter the labor force, job choice, and financial stability. Prior research identifies differences in homeownership rates as a factor influencing differences in wealth and intergenerational mobility across minority groups (Oliver & Shapiro 1995; Logan & Parman 2017; Albright et al 2021; Benetton, Kudlyak, & Mondragon 2022). While we do not have individual-level data on car ownership, we use as a proxy whether an individual drives a car to work. Driving to work can also reflect increased ownership of assets and increased earnings potential: work by Amuedo-Dorantes, Lofstrom, and Wang (2021) shows that likely undocumented immigrant women increase their labor supply if their state allows undocumented immigrants to obtain drivers licenses.
A third means by which TPS can impact income and wealth is by enabling access to federal healthcare benefits. For example, TPS recipients are eligible for federally-subsidized health insurance and Medicaid in some states, although they are precluded from other major welfare programs like Temporary Assistance for Needy Families (TANF) or the Supplemental Nutrition Assistance Program (SNAP) (Healthcare.gov n.d.; Kuhmerker 2003; Dept. of Health and Human Services 2012). Access to subsidized health insurance may increase income by improving health and may increase asset accumulation by reducing the risk of high medical bills (Farooq and Kugler 2022).
However, the potential advantages of TPS for recipients are limited by the possibility that benefits will be revoked and by the high administrative costs connected with TPS. TPS eligibility is determined annually at the discretion of the Secretary of Homeland Security. As a result, eligible individuals may be more reluctant to make substantial investments in the United States, such as buying a home, than they would be with permanent residency. Of this uncertainty, Menjívar (2006) notes:
This situation creates enormous anxiety, as each deadline accentuates these immigrants’ precarious situation, which for many has gone on for over two decades. . . . This uncertain status . . . permeates many aspects of the immigrants’ lives and delimits their range of action in different spheres, from job market opportunities and housing to family and kinship. . . .
Notably, receipt of TPS requires that applicants overcome significant administrative hurdles. Eligible individuals must meet “multiple and confusing deadlines for applications and renewals of permits and convoluted application procedures (e.g., fees, forms, photos, fingerprints, proofs of residence, and innumerable caveats and conditions)” (Menjívar 2006) in order to receive TPS. Each time the government announces a TPS extension, recipients must reregister for TPS, reapply for work permits (US Department of Justice 2018), and inform the Department of Homeland Security (DHS) of their current employer and current residence (Miyares et al. 2003). If TPS benefits are not extended, these disclosures may increase the risk of deportation.
The limits of TPS underscore the importance of exploring its impacts over a long timeframe. Recipients are more likely to make significant decisions after developing some trust that TPS benefits are likely to remain in place. As a result, impacts of the policy on wealth or labor supply decisions may take several years to manifest. We test how receipt of TPS impacts the behavior of eligible recipients over a 20 year timeframe in order to expose possible dynamic effects.
Migration History and Settlement Patterns of Salvadoran, Guatemalan, and Mexican Immigrants
Our empirical approach compares Salvadoran migrants who arrived in the United States between 1990 and 2000 to migrants from Guatemala who arrived during the same time period, but who were ineligible for TPS. We use Guatemalan migrants as our primary control group because prior immigration policies have treated Salvadoran and Guatemalan migrants identically.6El Salvador and Guatemala were both included in section 203 of NACARA in 1997. Prior to 2000, neither country had been granted TPS. We exclude migrants from Honduras and Nicaragua from our control countries because both countries were granted TPS in 1999 as a consequence of Hurricane Mitch. Further, both countries experienced destructive civil wars during the 1980s, have similar rates of poverty and economic development, and have experienced similar challenges with gang violence and instability in the 21st century (Meyer 2022). As a robustness check, we also consider Mexican migrants as a counterfactual for the experience of Salvadoran migrants following Orrenius and Zavodny (2015). This section examines three important aspects of Salvadoran migration to the US, showing that the similarity between Salvadoran and Guatemalan migrants is greater than that between Salvadoran and Mexican migrants. We also discuss ways in which Salvadorans may not be comparable to either control group, as well as our methods for addressing these concerns.
First, migration from El Salvador and Guatemala has been heavily shaped by fear of violence. The earliest substantial wave of immigration from both countries occurred in the 1980s, when the population of Salvadorans and Guatemalans more than quadrupled as the result of civil war (Gibson & Jung 2006). Nationals of both countries were treated as economic migrants and uniformly denied asylum until 1990, when the federal government accepted a legal settlement requiring that Guatemalan and Salvadoran asylum seekers be granted individual hearings (Hernandez 2006). In 1997, the Clinton administration retroactively reversed this decision with NACARA, which provided permanent legal status to Salvadorans, Nicaraguans, Cubans, Guatemalans, and Soviet Bloc citizens who had entered the United States prior to September 19, 1990, had applied for asylum prior to February 16, 1990, and had not since been apprehended at the border. Because a large share of pre-1990 Salvadoran immigrants benefitted from NACARA, we focus our analysis on immigrants who entered the United States no earlier than 1991 and were thus ineligible for this earlier legalization. While both countries’ civil wars ended in the early 1990s, poverty and gang violence spurred significant migration throughout the 1990s, with the number of nationals of both countries doubling between the 1990 and 2000 census (Gibson & Jung, 2006).
The connection between violence and migration in El Salvador and Guatemala may shape economic outcomes in the United States. Borjas (1989) argues that economic migrants from countries with greater income inequality than the United States are negatively selected for skill because low-skilled immigrants experience greater relative wage gains than do high-skilled immigrants. Since refugees’ migration decisions are less responsive to returns to skill, refugees may thus be more productive than observably similar economic immigrants. We show that Salvadorans and Guatemalans had very similar education, income, and years in the United States in the 2000 census. However, we control for years in the US interacted with country of origin to account for the possibility that refugee populations have steeper experience and earnings profiles.
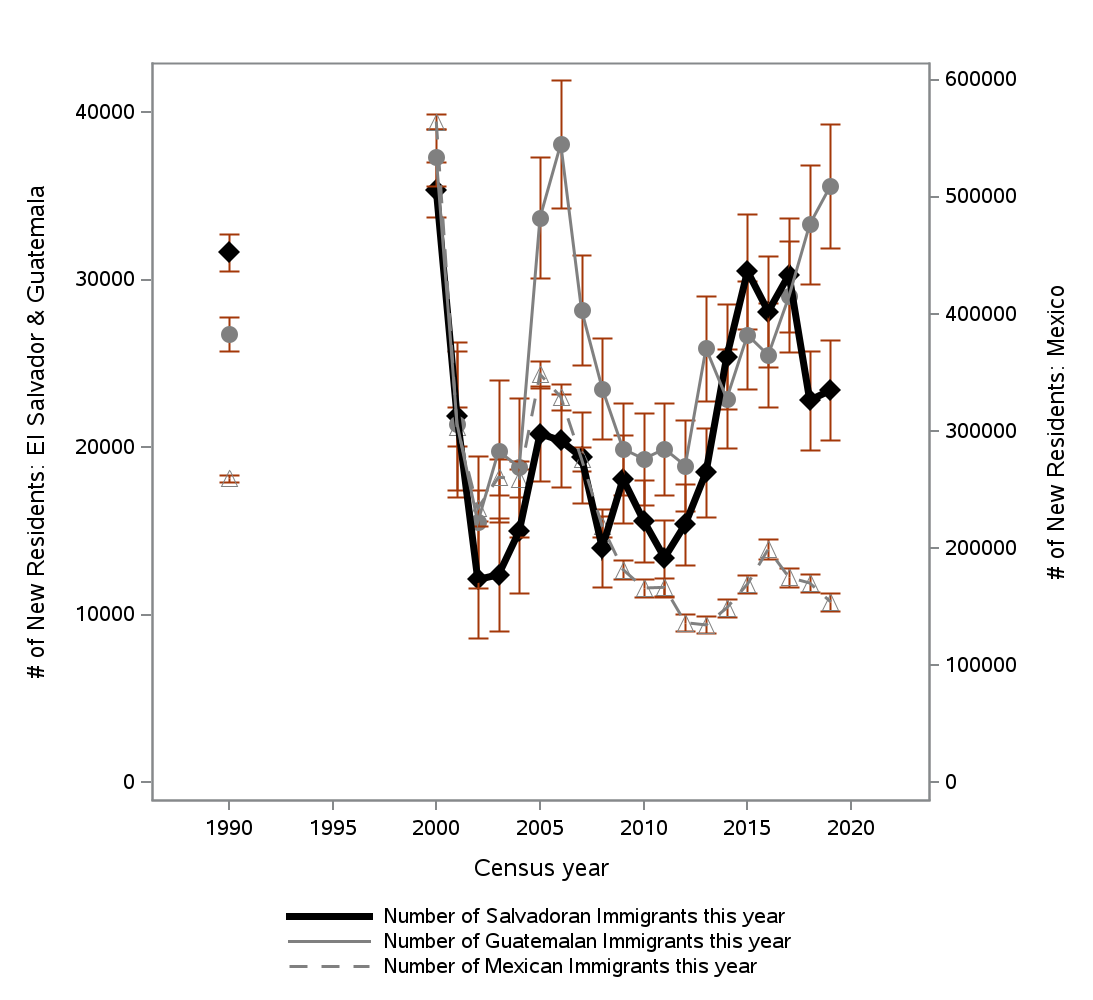
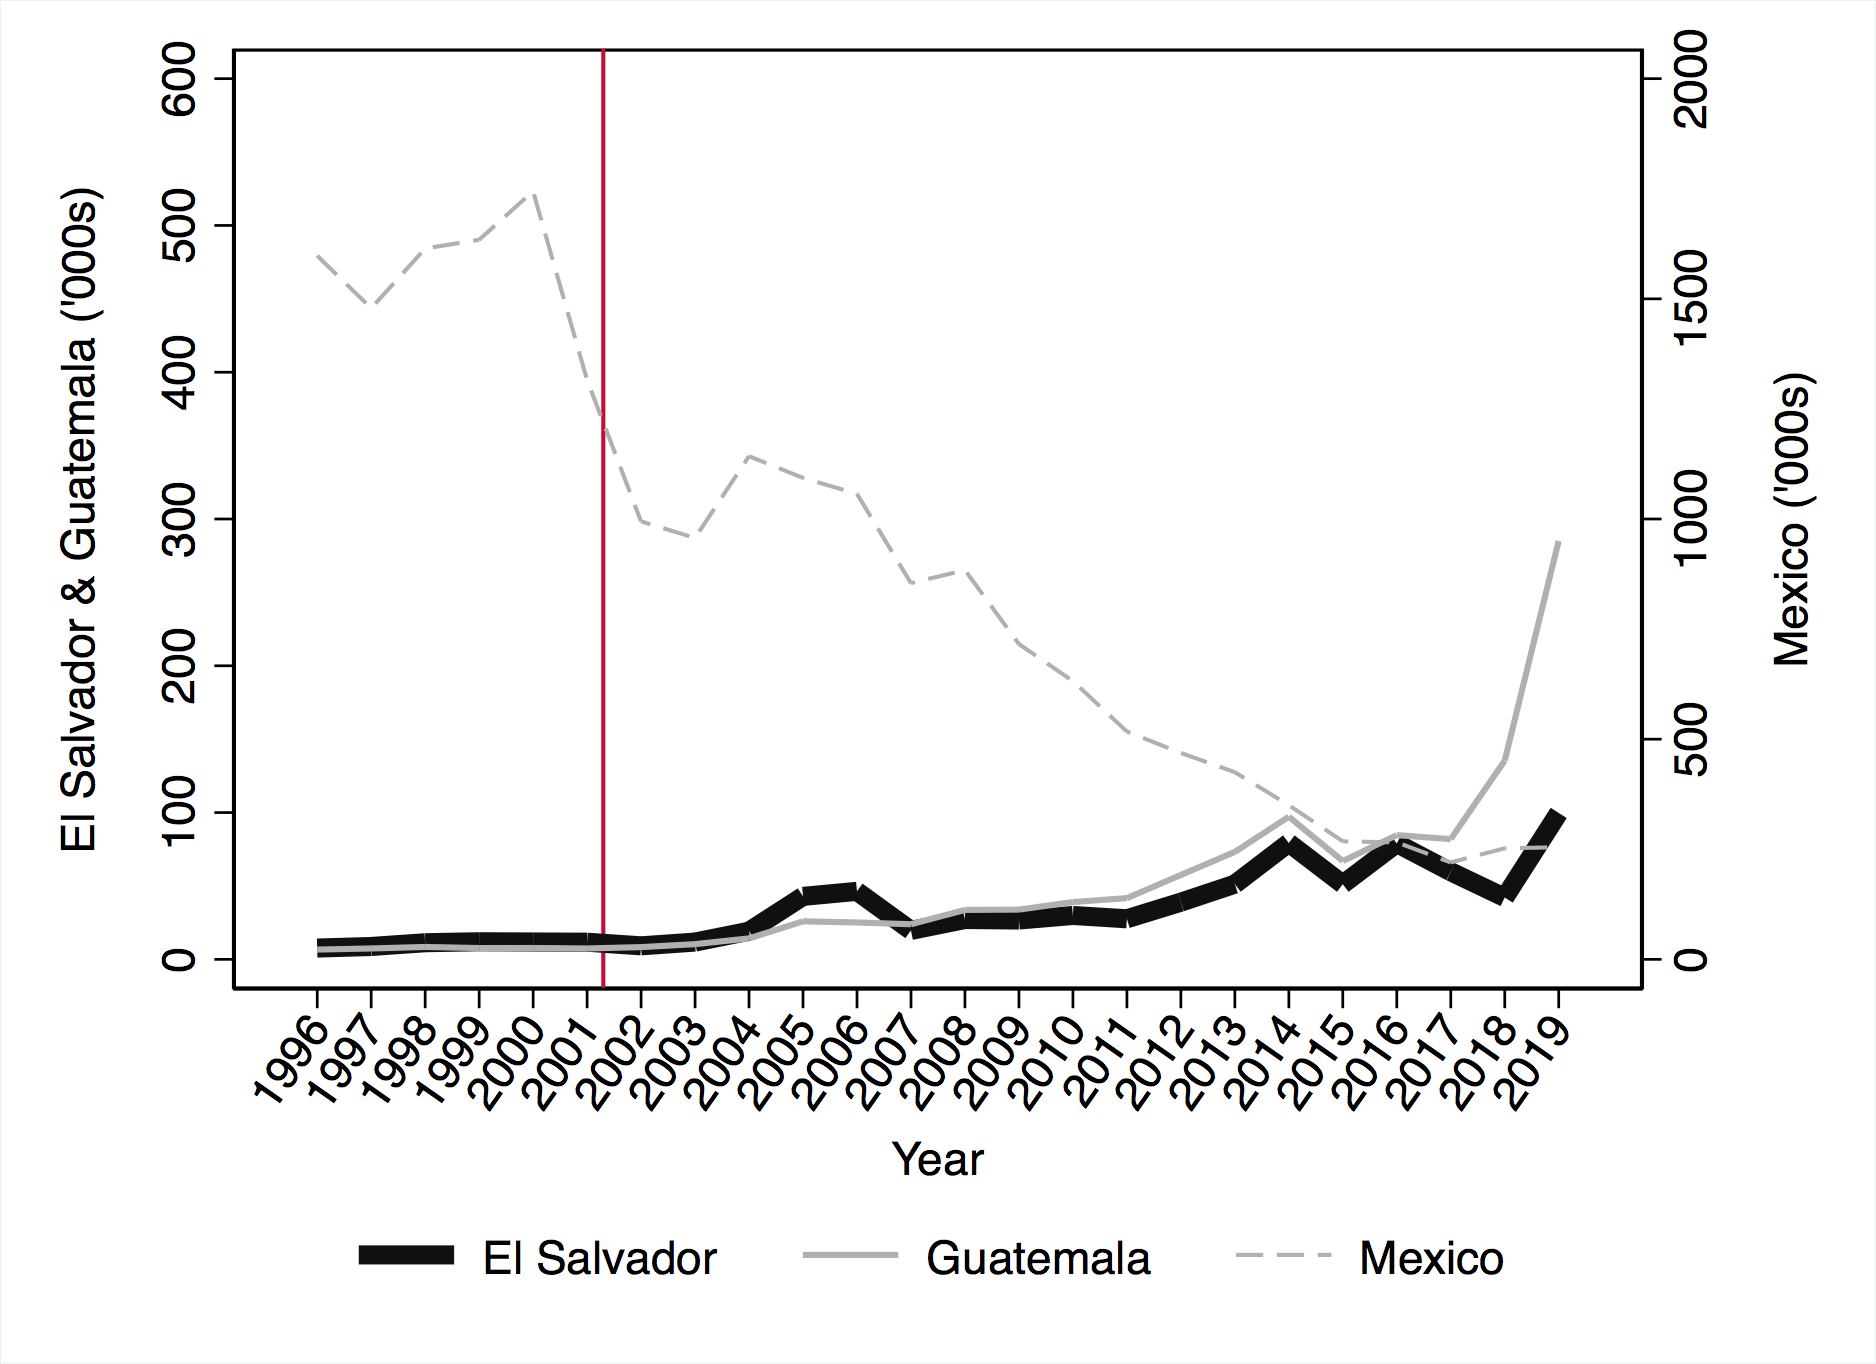
A second important feature of our selected control group is that Guatemalan immigration increased in lockstep with Salvadoran immigration in the two decades following receipt of TPS. While there was no surge of immigration from either country following the 2001 earthquakes, undocumented immigration has increased throughout the 21st century as a consequence of gang violence in both countries. Immigration from Mexico, in contrast—particularly undocumented immigration—has declined substantially since 2001 (see figure 2).
Figure 2: Rate of Salvadoran, Guatemalan, and Mexican Immigration before and after Temporary Protected Status
A) Estimate from American Community Survey
B) Estimate of Deportable Aliens by Customs and Border Patrol
C) Number of Legal Entrants Reported by Customs and Border Patrol
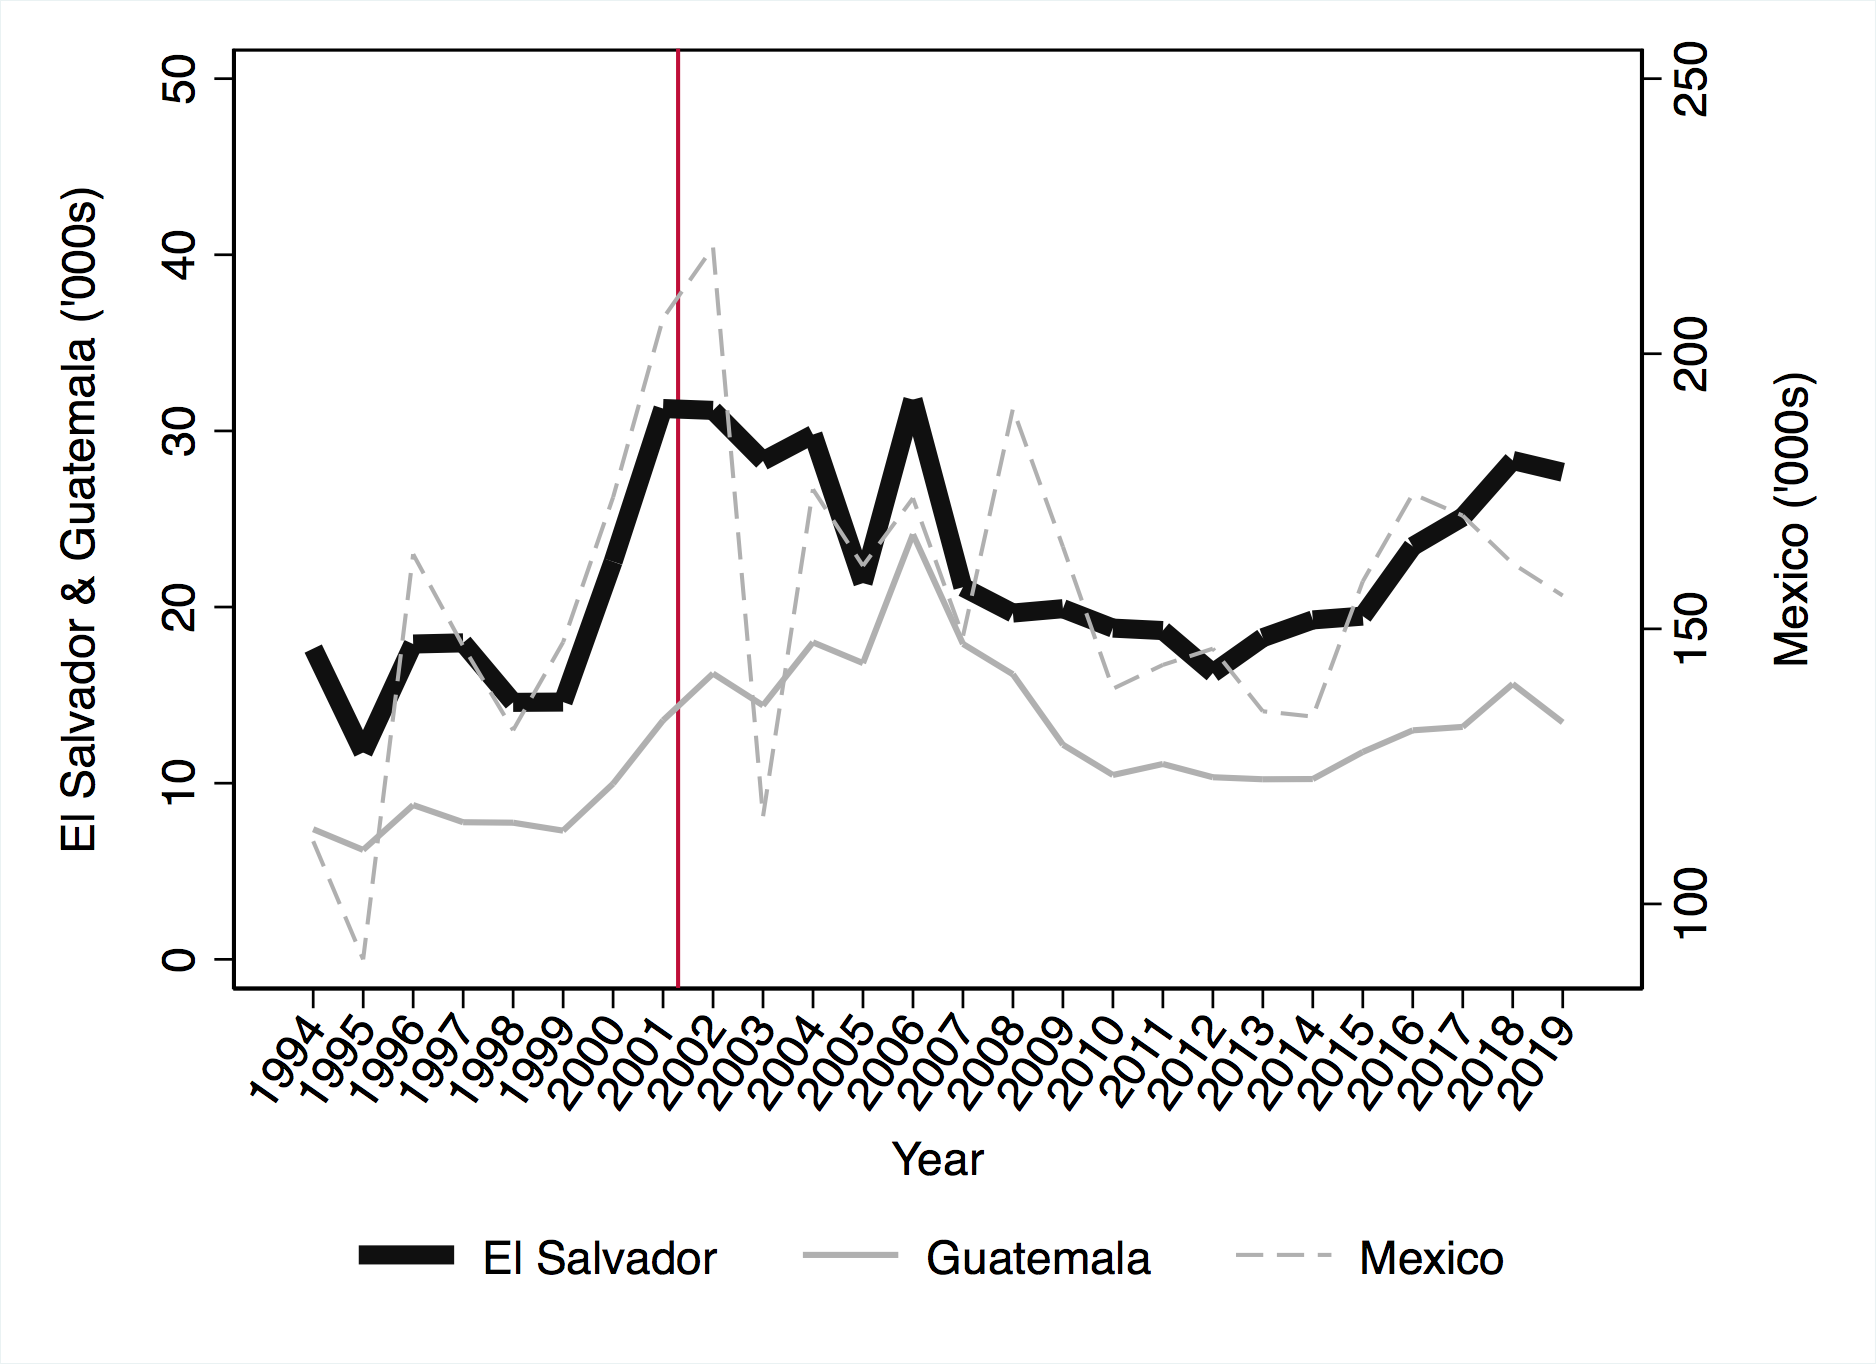
Notes: Figure 2 plots trends in immigration by source country across three metrics. Panel A shows new respondents into the ACS; panel B shows US border apprehensions of deportable aliens, and panel C shows legal immigrants in the US. Data in panels B and C sourced from the Yearbook of Immigration Statistics years 1996–2019, US Department of Homeland Security. Red vertical line denotes start of TPS for Salvadoran immigrants on March 9, 2001.
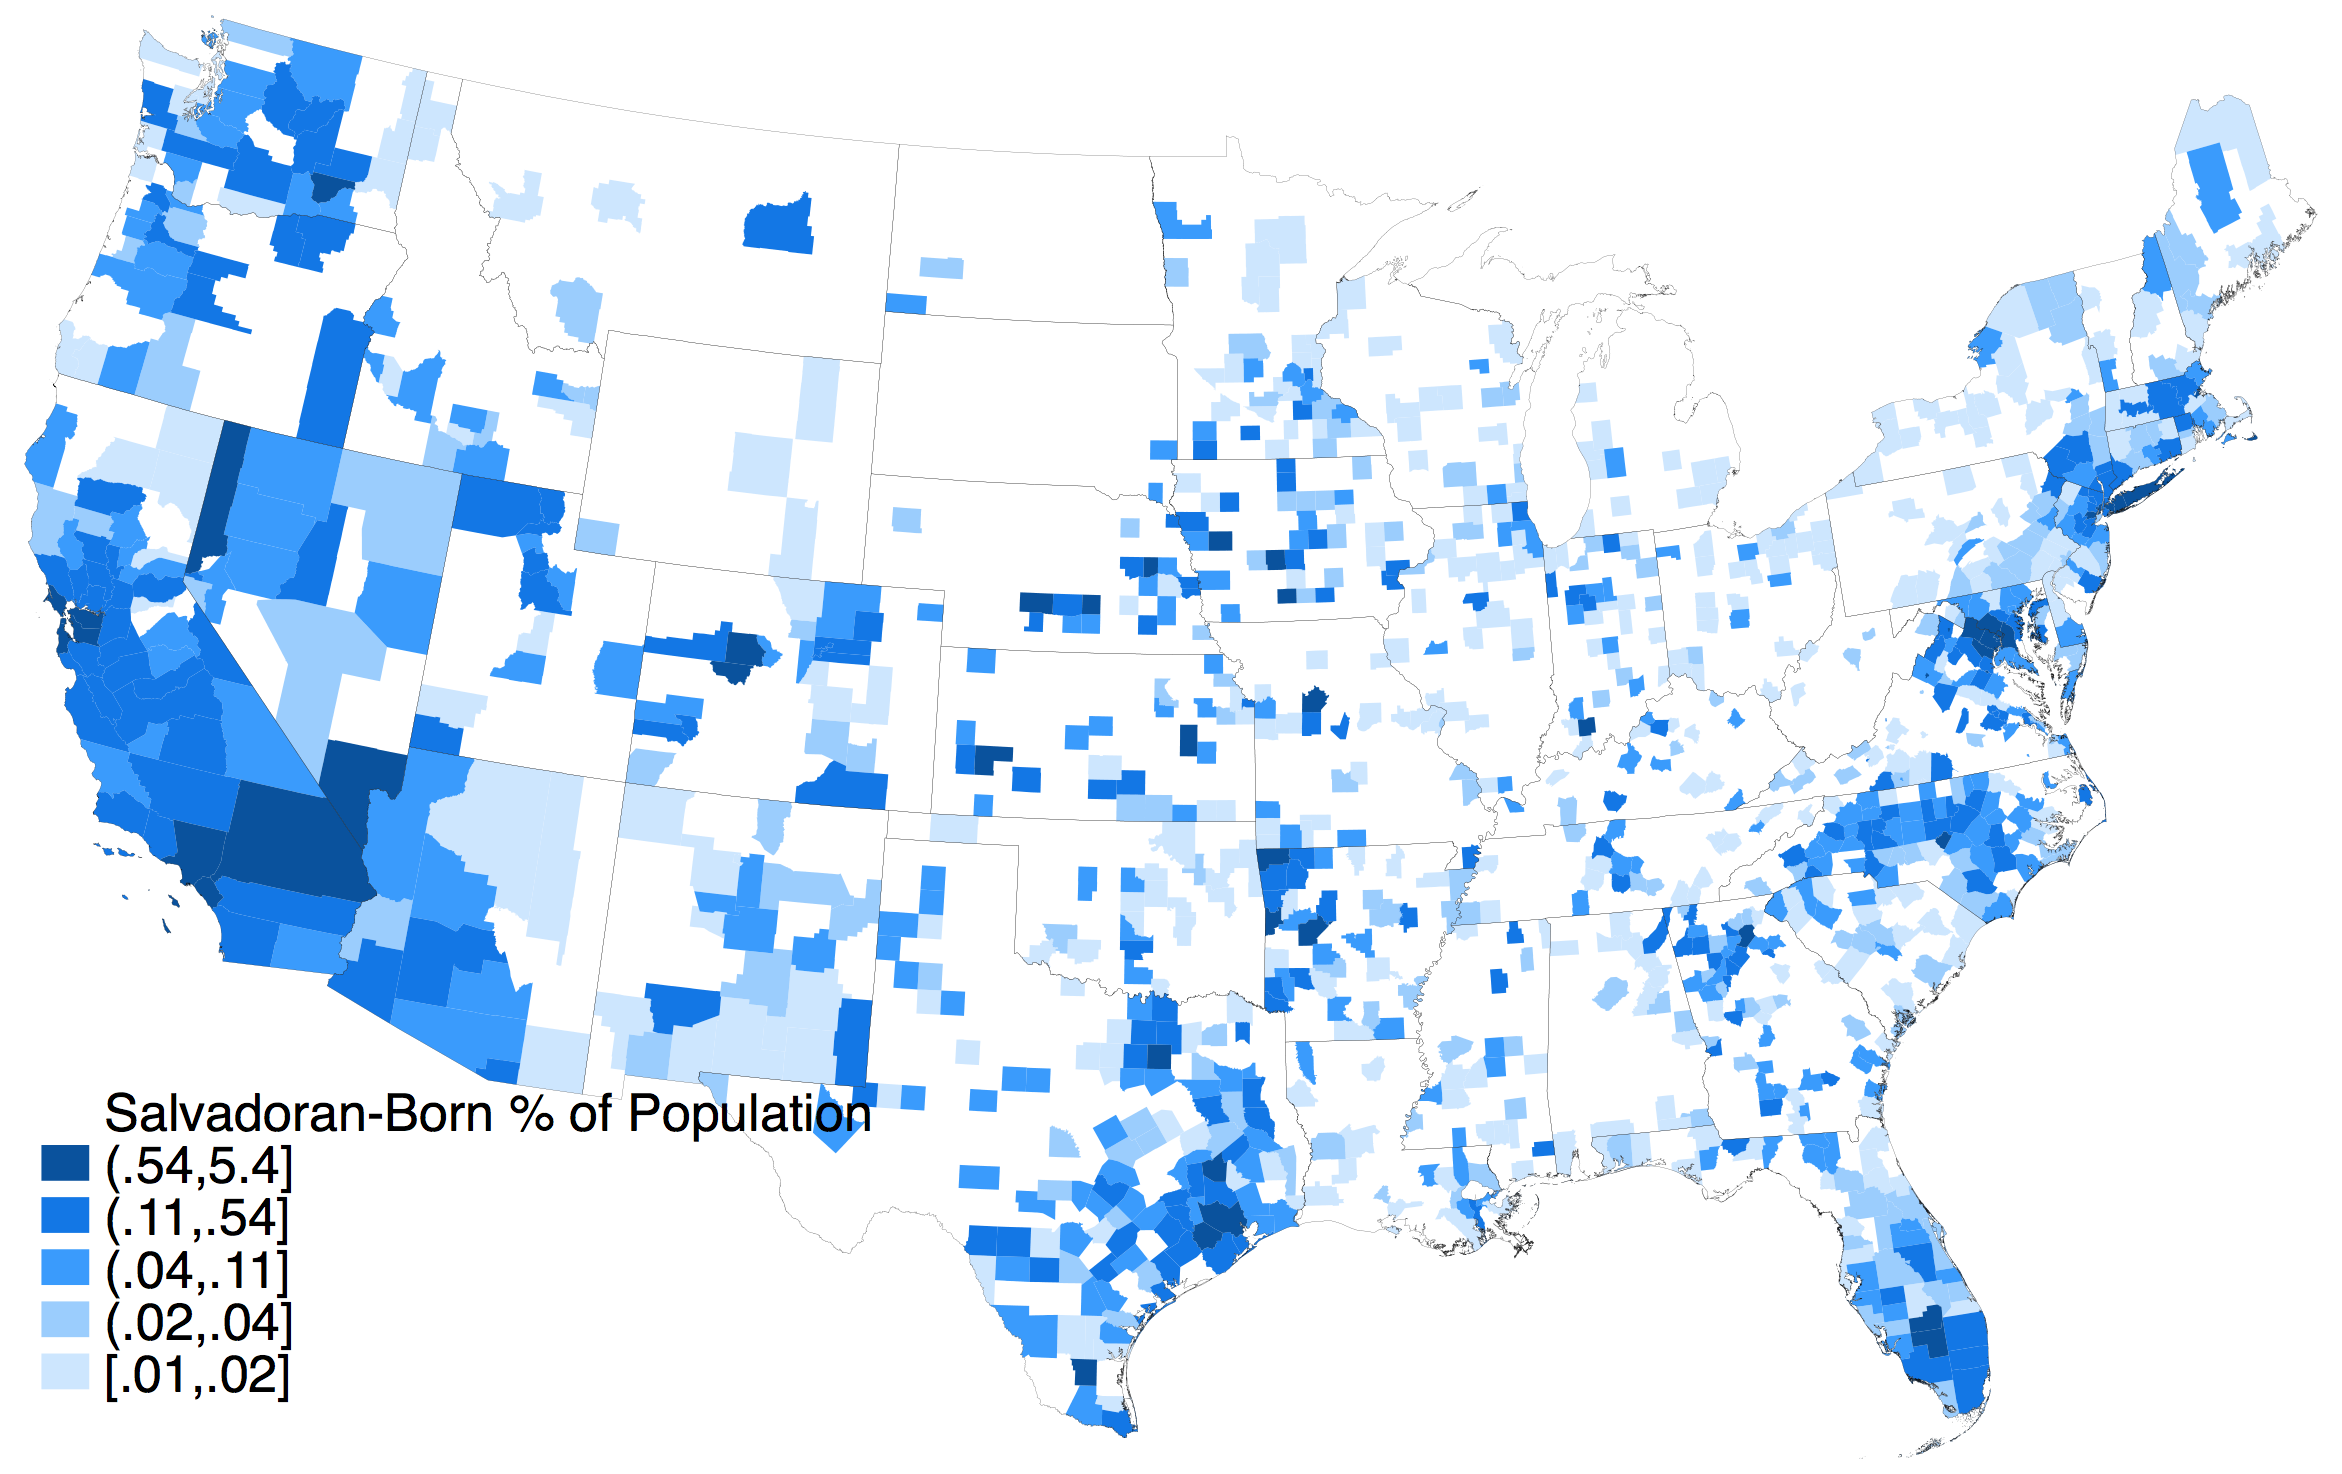
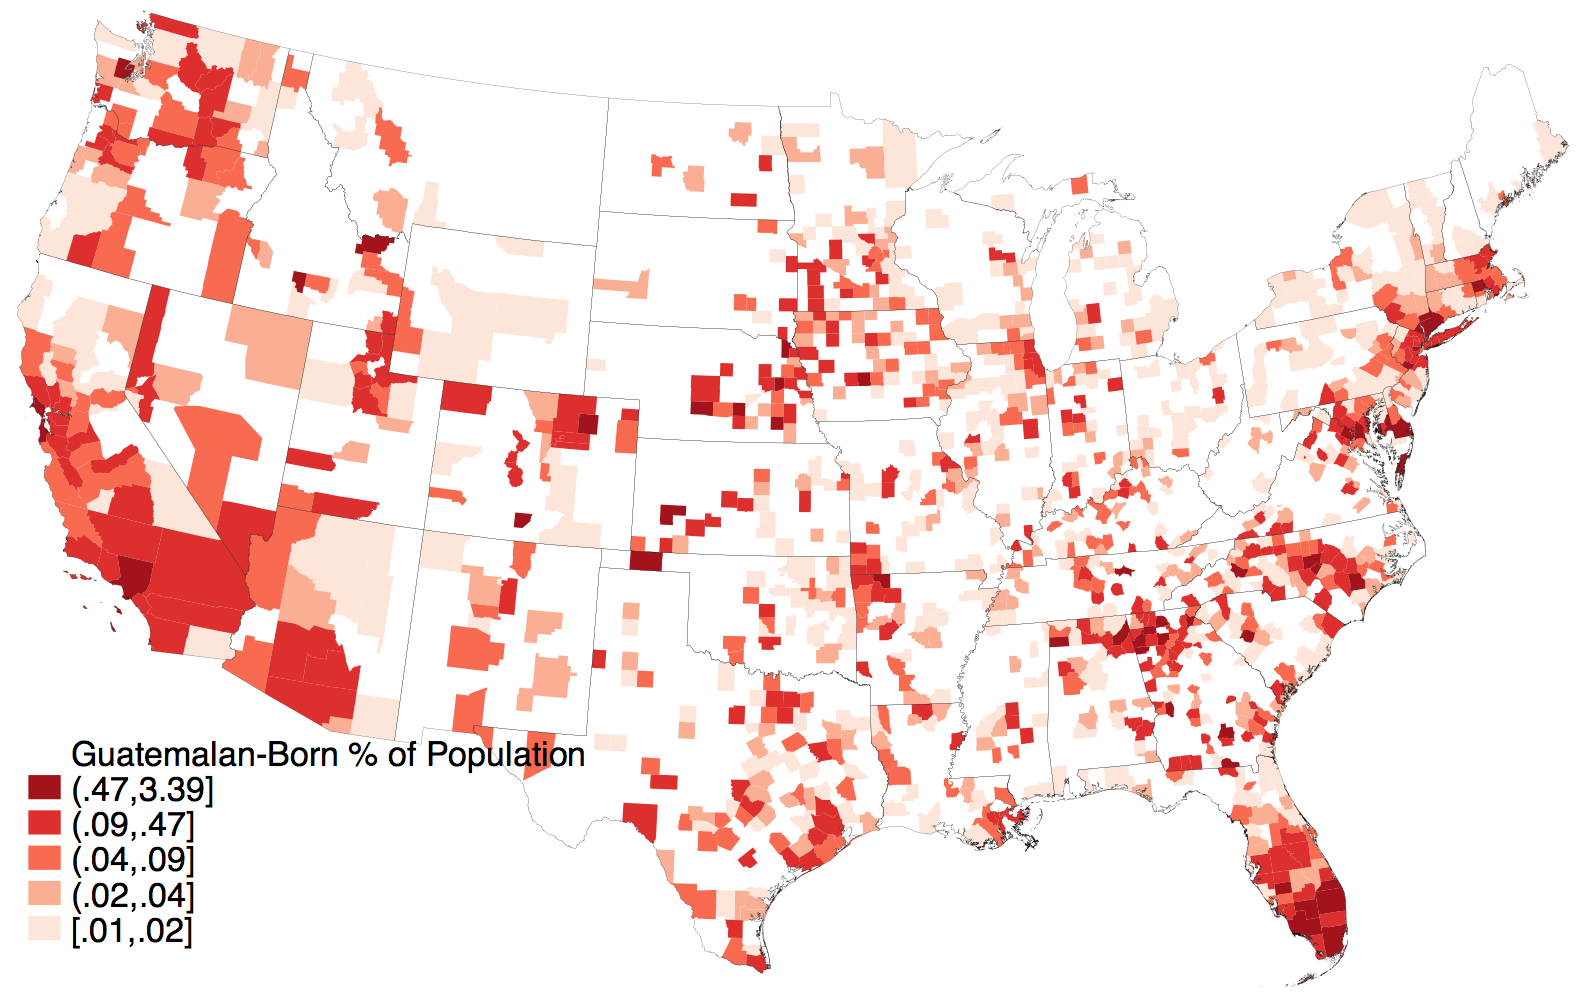
Lastly, Salvadoran and Guatemalan immigrant groups are far more geographically concentrated than are Mexican immigrants. Salvadoran immigrants are particularly concentrated in the Los Angeles and DC metro areas, while Guatemalan immigrants are concentrated in the Los Angeles, New York, and Miami metro areas. In contrast, there are substantial Mexican-born populations in a majority of US counties, particularly in the Southwest. As a robustness check, we restrict our analysis to states in which the geographic settlement patterns of Salvadoran immigrants largely match that of Guatemalan immigrants, and find qualitatively similar results.
Figure 3: Salvadoran, Guatemalan, and Mexican-Born Populations by County, 2000
Panel (A): Salvadoran
Panel (B): Guatemalan
Panel (C): Mexican
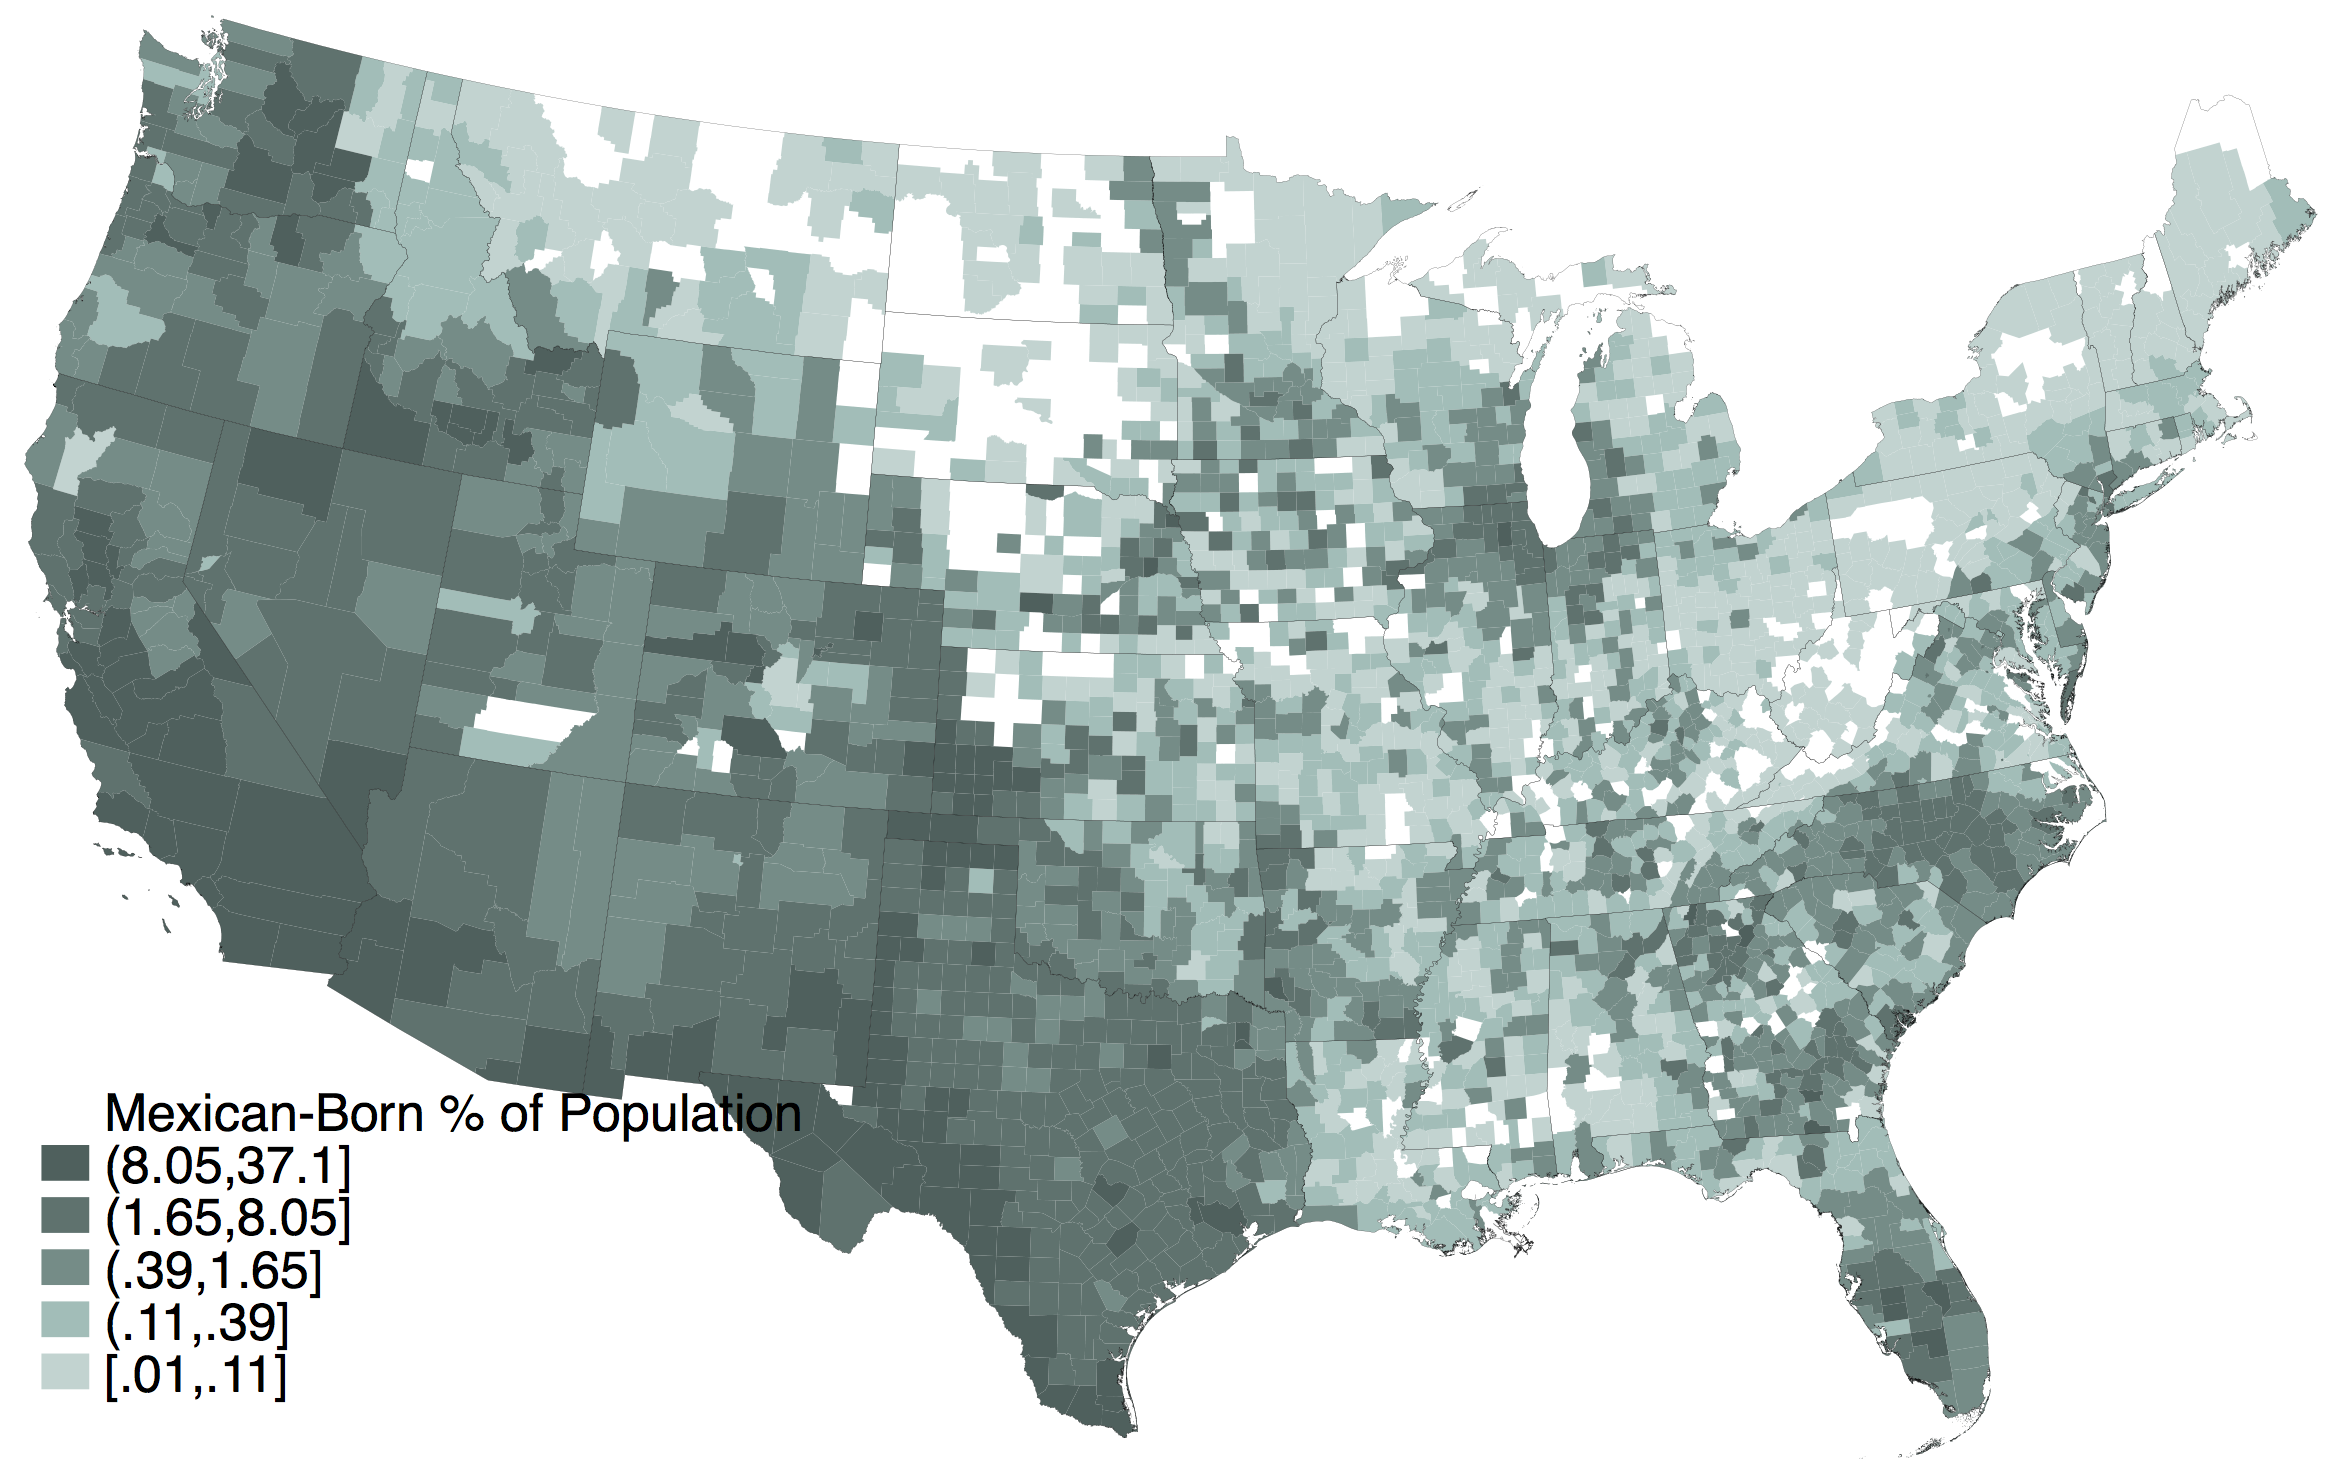
Note: Figure 3 plots share of population by county that is Salvadoran-born (panel A), Guatemalan-born (panel B), or Mexican-born (panel C) as of 2000. Legend color scale corresponds to the 25th, 25th–50th, 50th–75th, 75th–95th, and above the 95th percentiles from lightest to darkest shades, respectively. Source: IPUMS NHGIS and US Census.
Data and Empirical Strategy
Our primary analysis uses individual-level microdata from the 2000 longform Decennial Census and the 2001–2019 ACS, provided by (Ruggles et al. 2021). The ACS is a large, cross-sectional, nationally representative survey that includes questions on citizenship, nativity, year of entry to the United States, personal and household income, education, language spoken at home, access to personal vehicles, and homeownership. Our analysis centers on immigrants from El Salvador and Guatemala who entered the US between 1991 and 2000, were above the age of 18 in 2000, are noncitizens, and have less than a high school education. These sample restrictions are intended to identify individuals who were likely to be eligible for TPS.7If receiving TPS increases the probability of obtaining a high school diploma or of obtaining citizenship, these sample restrictions would result in an underestimate of the true effect of TPS. We show in Table A.10 that, in a sample of all Salvadoran adults, difference-in-differences estimate suggest that the likelihood of being included in the sample declines by 2.4 percentage points for Salvadorans, relative to Guatemalans, after TPS. This is driven by a 1.9 percentage-point increase in the probability of holding a high school diploma. As we will discuss in Section 5.4, this could be driven either by an increase in Salvadoran educational attainment following receipt of TPS or by an increased likelihood of remaining in the US among more highly-educated migrants following receipt of TPS.
Because the Decennial Census and ACS do not ask respondents for their specific immigration status, we follow Borjas (2017) in estimating a respondent’s likely legal status from their observed characteristics. We consider a respondent to have a high likelihood of being undocumented if they are not a US citizen, if they report speaking Spanish at home,8The Migration Policy Institute (2019) estimates that 7% of unauthorized immigrants speak English at home, while 72% speak Spanish at home. Restricting the sample to Spanish speakers also addresses differences between Guatemala and El Salvador in the number of individuals who speak Mayan languages at home. and if they have less than a high school education.9Unlike Borjas (2017), we exclude characteristics directly connected to current legal status, such as employment in a government job or service in the armed forces because we want to estimate respondents’ likelihood of having been undocumented prior to 2000. We believe our prediction method is relatively accurate because the majority of Salvadoran-born migrants living in the US as of 2000 were undocumented. An estimated 51% of all Salvadoran-born residents of the US were unauthorized in 2000 (Cohn, Passel & Gonzalez-Barrera 2017). According to calculations by Borjas (2017), 42% of undocumented immigrants and only 19% of legal immigrants have less than a high school education. Consequently, we estimate that 70% of Salvadorans without a high school degree as of 2000 were unauthorized and thus eligible for TPS. If TPS had no spillover effects for ineligible Salvadorans, the effect on TPS-eligible individuals is likely 40% larger than our estimates.
Among all adults of Salvadoran origin sampled from 2000–2019, 37% meet the criteria for “likely undocumented,” while 24% would have been eligible for TPS based on their date of entry to the country. As a result, our final sample includes 9% of Salvadoran adults, constituting 19,262 observations. The comparison group includes 10.5% of Guatemalan adults, constituting 13,354 observations. While ACS samples after 2005 sample 1% of the US population, the earliest years of the ACS are smaller, sampling between 1 in 232 and 1 in 261 households from 2001 to 2004. As a consequence, estimates of the effects of TPS in its earliest years are somewhat imprecise, deriving from as few as 263 Salvadoran adults per year.
Table 1 presents descriptive statistics for Salvadoran, Guatemalan, and Mexican immigrants in 2000, before Salvadoran immigrants became eligible for TPS. There are a few important takeaways from this table. First, Salvadoran, Guatemalan, and Mexican immigrants in our sample are very similar along most observed dimensions. The only characteristic where Salvadoran immigrants substantially differ from Guatemalans is homeownership—22% of Salvadorans in our sample owned their home in 2000, relative to 14% of Guatemalan immigrants. Second, the sample is on average young and very low income. The average sample member was 31 years old in 2000, had lived in the United States for fewer than five years, and had received fewer than seven years of education. Average individual income was approximately $10,000 per year, with total household income at just over $30,000 per year (2020 dollars).
We estimate the effect of TPS on recipients using an event-study strategy that compares changes in outcomes for likely TPS-eligible Salvadoran adults after 2001 to changes for Guatemalan adults who would be likely TPS-eligible were they Salvadoran. We estimate the following regressions for each outcome Y, with an observation defined by an individual, i, in year t:
 (1)
(1)
Where Salvadorian is an indicator for whether a respondent was born in El Salvador,
  are a set of time-varying individual controls consisting of quadratics of age and years in the United States, gender, age, race, and educational attainment.
  are a set of state-by-year fixed-effects.
In order to provide a single statistical test for each outcome, we also estimate difference-in-differences regressions, with post-period consisting of the years 2006–2019. We exclude the years 2001–2005 in the difference-in-differences regressions because the ACS was not nationally representative in these years. The difference-in-differences regression take the form:
 (2)
(2)
Main Results
We examine effects on three broad topics: personal income and earnings, work arrangements and occupational standing, and ownership of physical assets. We also present inconclusive evidence of effects on children’s education in Appendix A. For each, we present evidence for effects on these outcomes in three ways: first, we show mean outcomes for Salvadorans, Guatemalans, and Mexicans in each year. Second, we show the results of event study regressions as described in equation (1), and finally we show the result of difference-in-differences regressions with a range of controls and control groups as described in equation (2).
Overall, we find that beneficiaries of TPS experienced higher incomes, wages, and employment than did similar immigrants from neighboring countries. These positive effects appear to be due in part to better labor market opportunities: TPS recipients are more likely to work in high-wage occupations and work in occupations in which a larger share of the workforce is licensed by the government. Beneficiaries are also more likely to make long-term investments in US-based capital, with increases in homeownership and a higher likelihood of driving to work than control immigrants. We describe each of these findings in greater detail below.
Income, Wages, and Employment
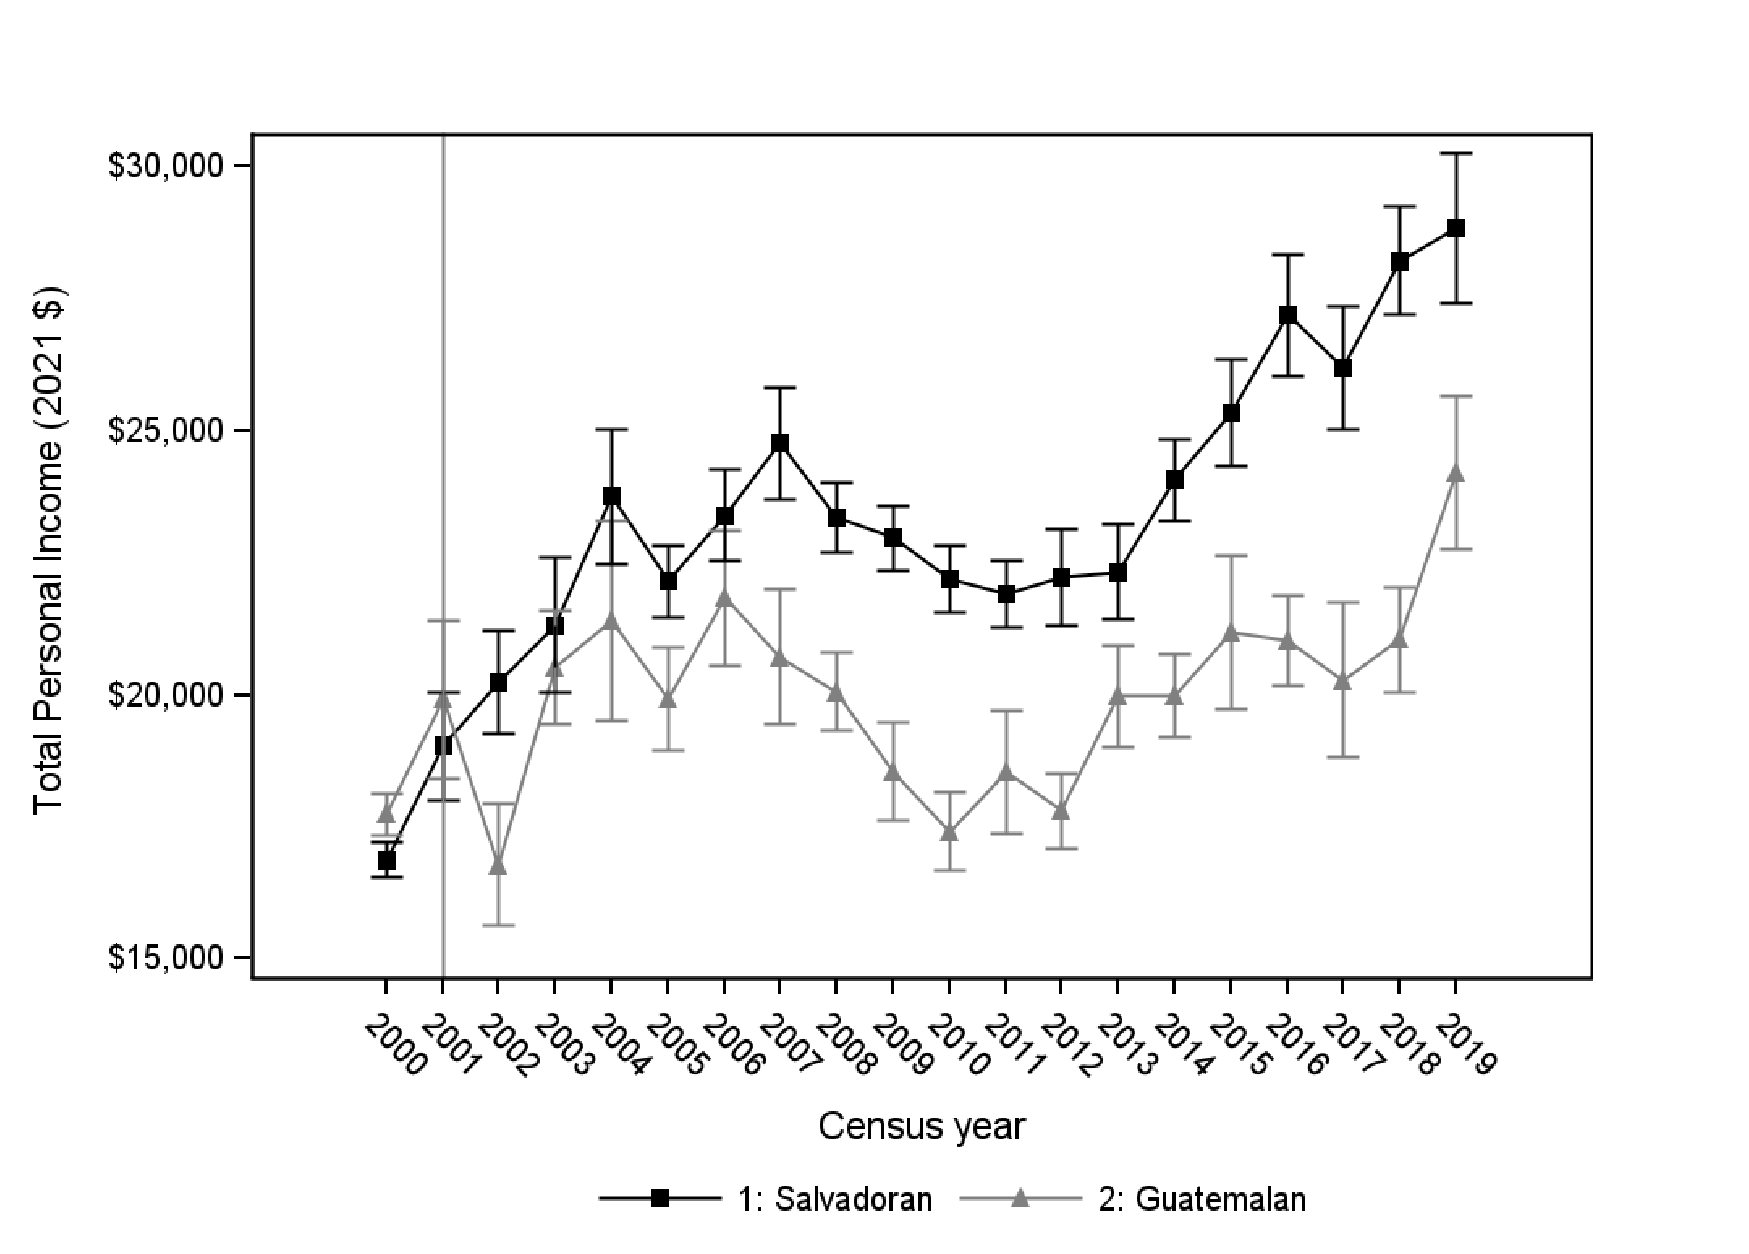
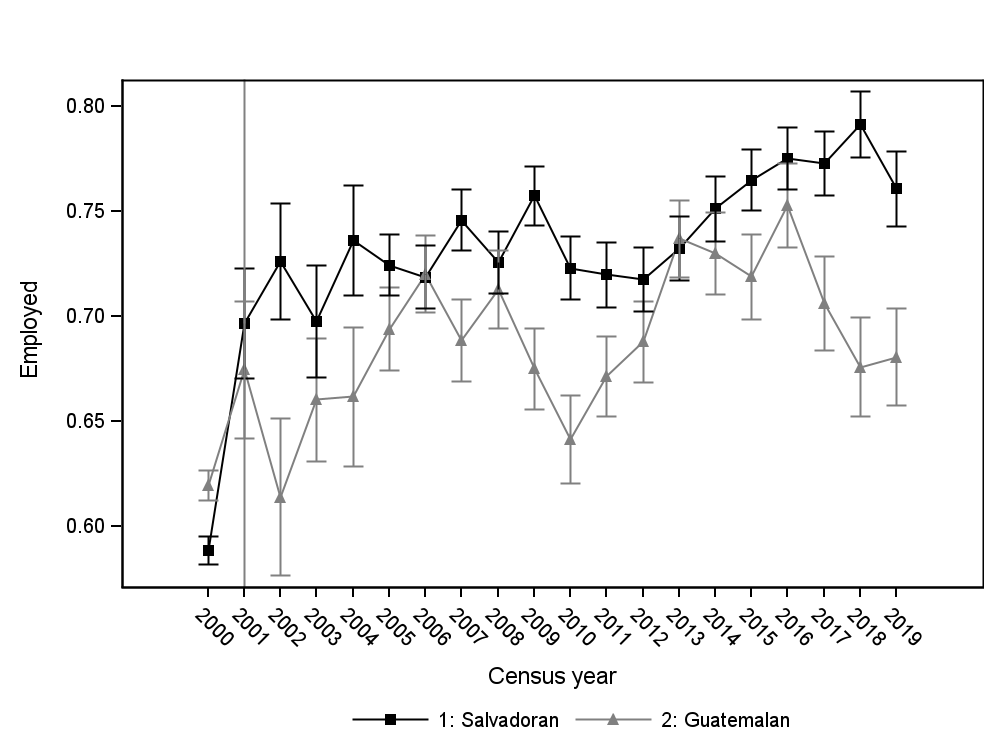
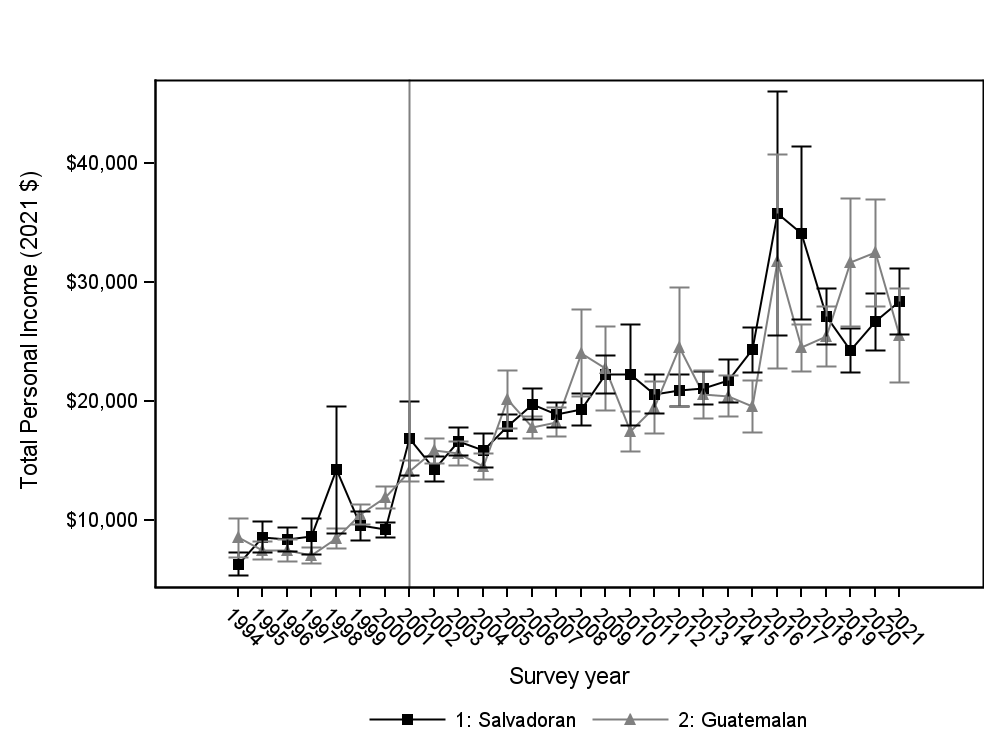
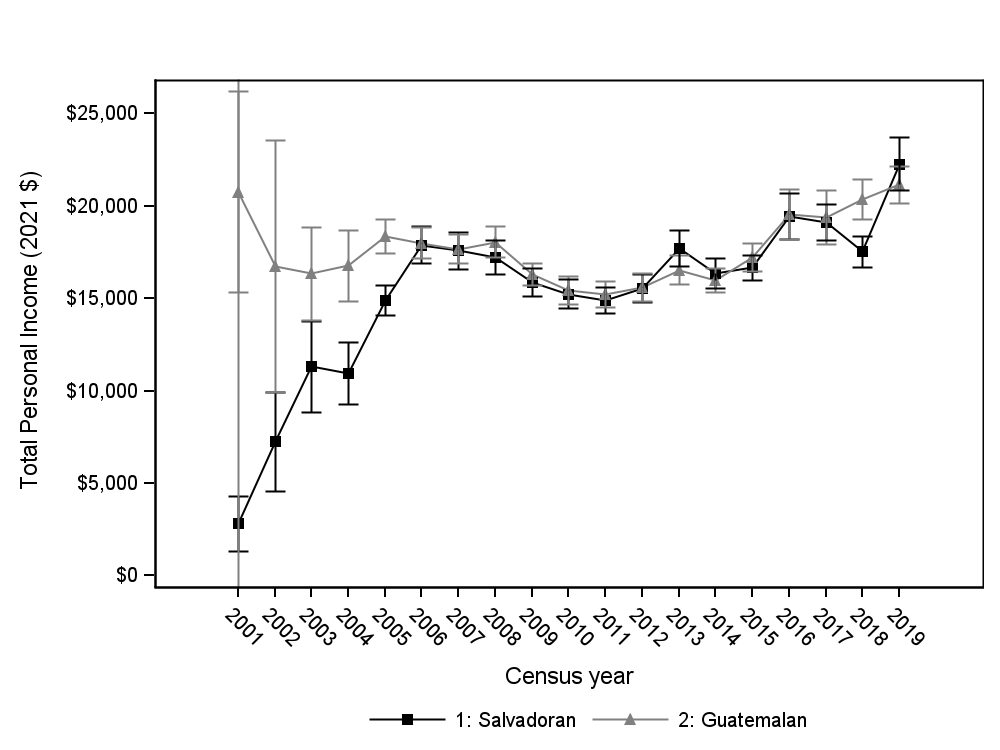
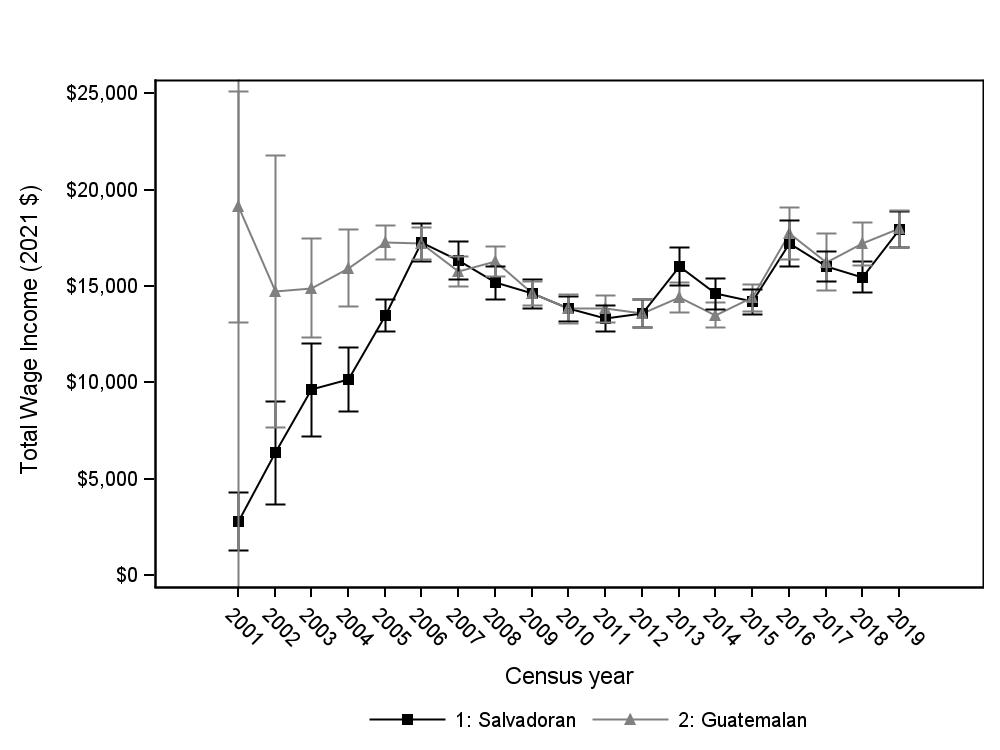
We consider four measures of earnings and employment: a respondent’s total personal income, their income from wages and salaries, their likelihood of being employed when the survey was conducted (defined as having done any work for pay or profit in the week of the survey), and their estimated wage rate, defined as annual earnings divided by annual hours, for individuals who worked at least 1000 hours in the past year (all in 2020 dollars). Figure 4 shows that average Salvadoran total income, wage income, wage rate, and employment were similar to Guatemalan averages in 2000, prior to the start of TPS. After the start of TPS, however, income and employment for Salvadorans steadily increased relative to income and employment of Guatemalans. Salvadorans earned an average of $6,000 per year more than either control group by 2019, with an employment rate more than eight percentage points higher.
Figure 4. Mean Values of Financial Outcome Variables by Country of Origin and Year (2021 Dollars)
(A) Total Personal Income
(B) Wage and Salary Income
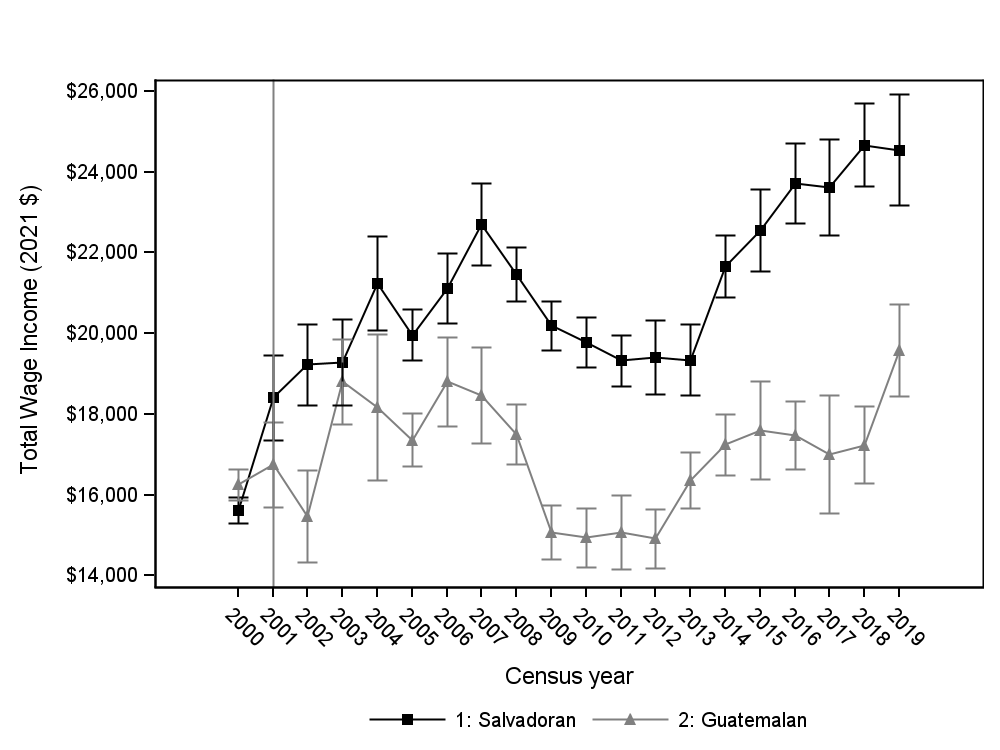
(C) Employment Rate
(D) Wage Rate
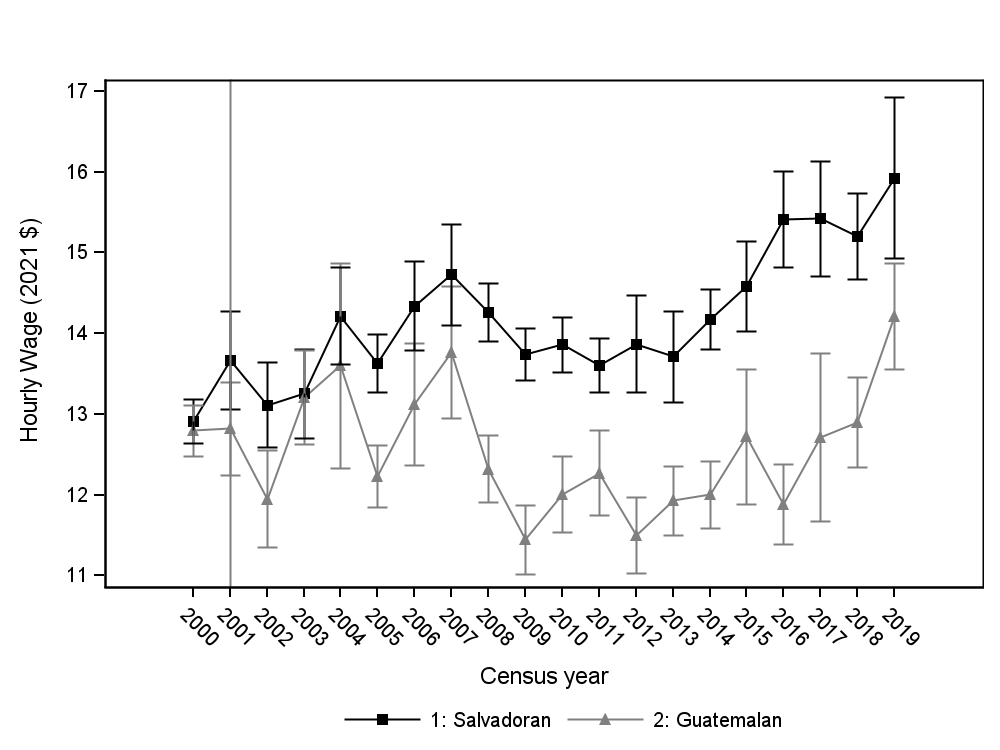
Notes: Figure 4 plots mean outcome values for Salvadoran and Guatemalan respondents to the ACS.
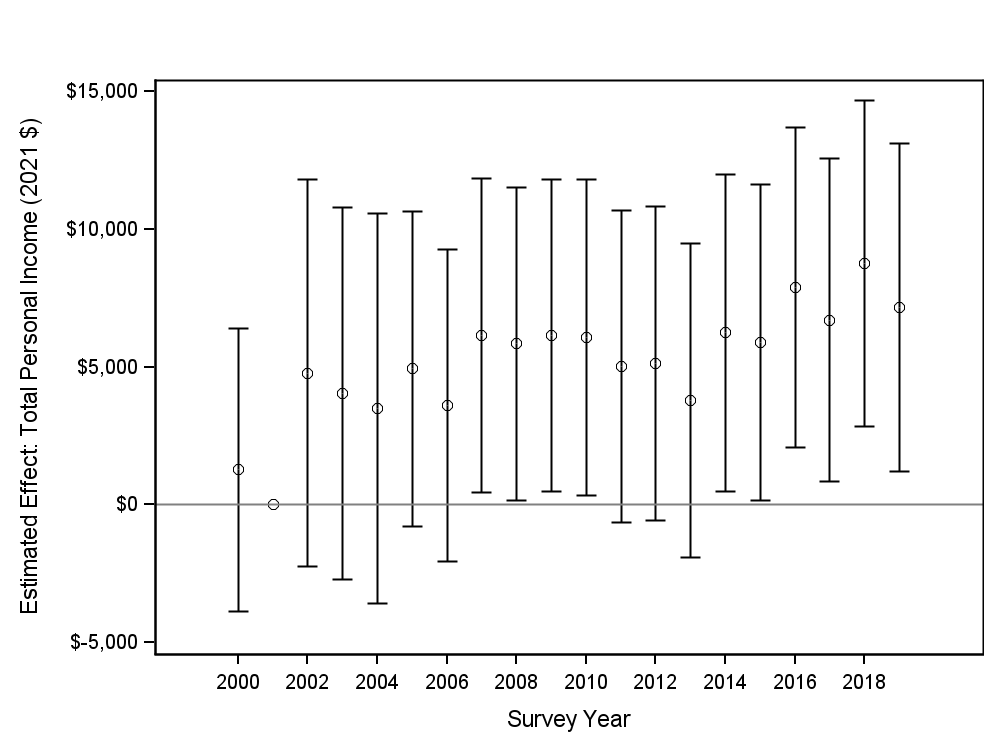
We validate these findings using event study regressions as described in equation (1). Figure 5 shows that average incomes for Salvadorans increased by approximately $4,000 from 2000 to 2007 relative to Guatemalans and by approximately $5,000 from 2017 to 2019. These income gains appear to be made up almost entirely of wage and salary income, which increased somewhat more than total income through 2019. These findings suggest the positive impacts of TPS on income increase over time. Part of the delayed effect may be due to the fact that Salvadoran immigrants were initially reluctant to provide their information to the federal government in order to receive TPS in the first several years of the program (Miyares et al. 2003).
Figure 5. Event Studies Comparing Personal and Family Incomes of Salvadoran vs Other Central American Immigrants
(A) Total Personal Income
(B) Wage and Salary Income
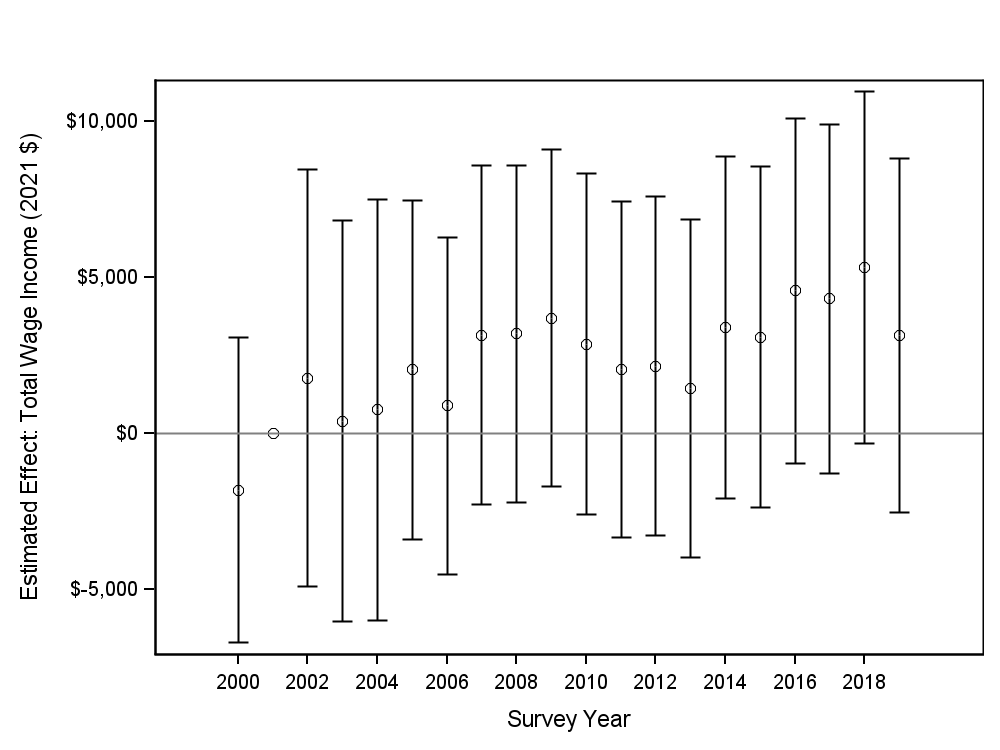
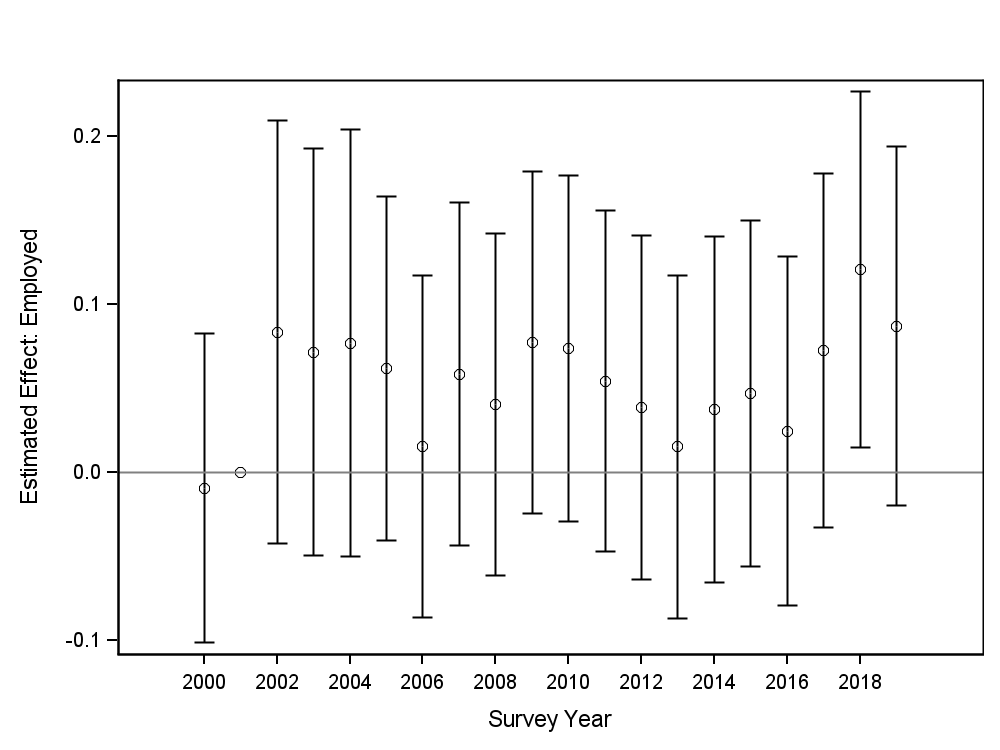
(C) Employment Rate
(D) Wage Rate
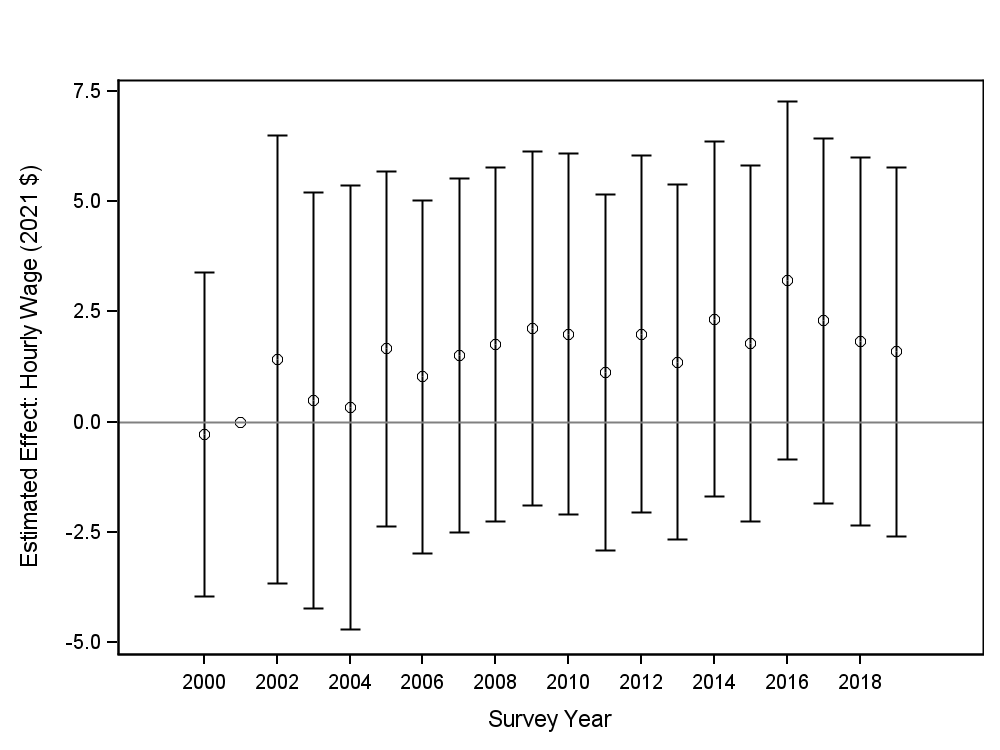
Notes: Figure 5 plots estimated event study coefficients using equation (2), on a sample of Salvadoran and Guatemalan migrants as described in the text.
We further confirm these findings by estimating difference-in-differences regressions, as described in equation 2. These estimates are presented for each of our four income and employment measures in Table 2. Column (1) estimates the average effect of TPS without control. Column (2) adds controls for personal characteristics: gender, a quadratic of age, race, years of education, and years in the United States. Column (3) adds controls for state-by-year fixed-effects.10For ease of exposition, Table 2 does not show coefficients on control variables. We show full regression results in Appendix Tables A.1 – A.4.
Table 2. Effect of TPS on Income, Earnings, Employment, and Wages
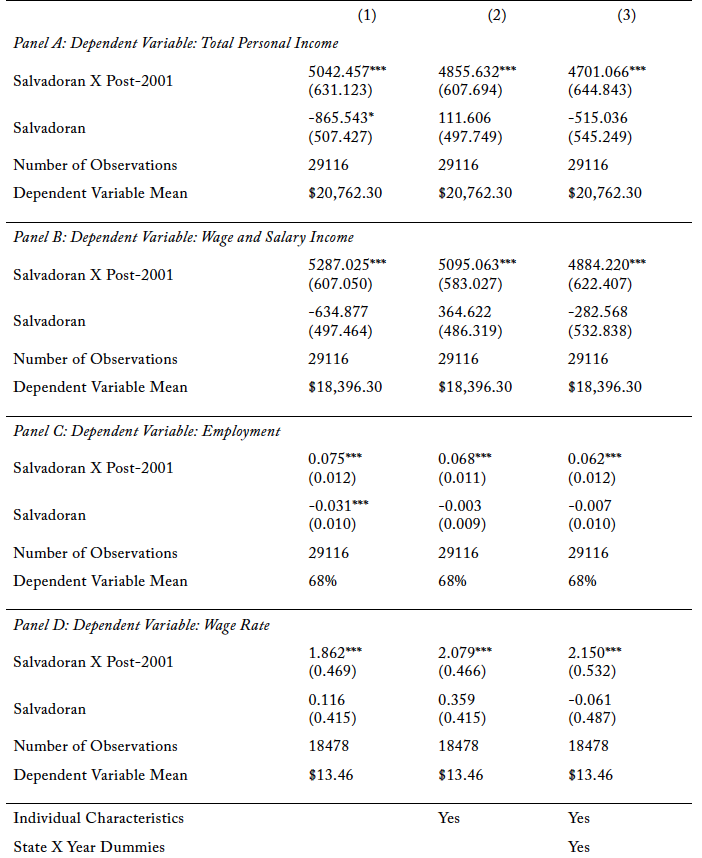
Notes: This table reports Ordinary Least Squares (OLS) estimation results from equation (2) in the text. Column (1) includes a dummy for whether the person was observed after 2001. Column (2) adds controls for race, sex, quadratics of years of education and years in the US, and education category, as described in the text. Column (3) adds state-by-year fixed-effects. Significance levels are: *10%, **5%, ***1%.
Table 2 shows that receipt of TPS increased average income by approximately $4,701 per year, or approximately 24% of the average income of the control group, in the years from 2006 to 2019. These estimates are fairly robust to the choice of controls, with estimates differing by only $300/year, or half of a standard-error, between the no-controls and fully saturated specifications. These gains in income appear to come entirely from wage and salary income, which increased by an average of $4,884 per year.
This increase in wage and salary income in turn appears to be driven both by an increase in employment of six percentage points (a 9% increase) and an increase in hourly wages of $2.15 (a 16% increase). Effects on employment are particularly large in 2009 and 2010, when job losses due to the great recession were greatest. Effects on hourly wage rates are large relative to the wage penalty faced by undocumented workers, which Borjas and Cassidy (2019) estimate to be 6% for men and 4% for women.
These findings present a few interesting contrasts to prior work on more comprehensive legalizations of undocumented immigrants. Whereas Kossoudji and Cobb-Clark (2002), Kaushal (2006), and Amuedo-Dorantes and Bansak (2011) find that legalization increased wages but had no or negative effects on workforce participation, we find substantial increases in workforce participation. This difference may be due in part to the limited nature of TPS. NACARA and ICRA provided beneficiaries with legal permanent residency and rights to welfare benefits, including unemployment insurance. In contrast, TPS provided no access to welfare or social services. As a consequence, TPS may not have raised reservation wages, in contrast to permanent legalizations. We find no differences between Salvadorans and either control group in income from social services in Appendix Table A.7, lending support to this explanation. The positive effect of TPS on employment may also be a result of changes in the enforcement of work restrictions. Beginning in 2005, use of E-Verify—an electronic system for determining the legal status of workers—has become widespread, resulting in declines in the employment of likely unauthorized immigrants (Amuedo-Dorantes & Basnak 2014). As a result, the value of legal status for securing employment may have been greater in the 21st century than it was during earlier legalizations.
Next, we examine the possibility that TPS increased the number and quality of job opportunities for recipients by examining changes in the occupations and work arrangements of eligible Salvadoran immigrants. In Table 3, we examine four characteristics of occupations. First, we test how TPS affects the average hourly wages of workers employed in the occupation. Second, we explore the percent of workers in each occupation holding a government-issued license. Undocumented immigrants are typically unable to receive occupational licenses, so lack access to licensed occupations, which are generally higher paid (Borjas 2017). Third, we test how TPS affects the percent of workers in a recipient’s occupation who are noncitizens. Finally in panel D, we examine self-employment rates. Because self-employment is highest among undocumented immigrants (Amuedo-Dorantes, Lofstrom, & Wang 2021), declines in the rate of self-employment may imply that recipients gain access to formal, more stable employment channels.
Table 3. Effect of TPS on Occupation and Self-Employment
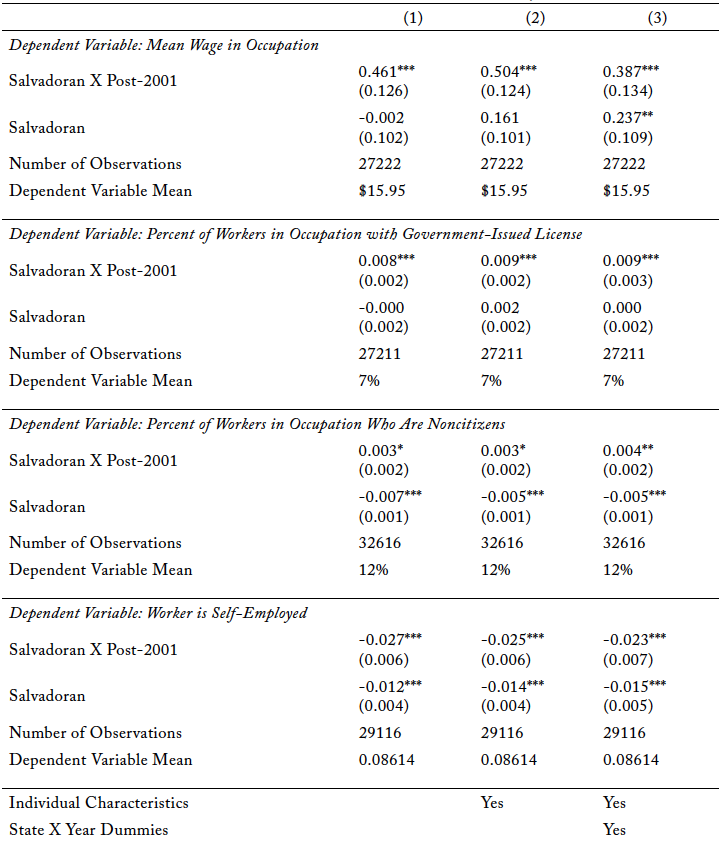
Notes: This table reports OLS estimation results from the regressions described in equation (2) in the text. Column (1) includes a dummy for whether the person was observed after 2001. Column (2) adds controls for race, sex, quadratics of years of education and years in the US, and education category, as described in the text. Column (3) adds state-by-year fixed-effects. Significance levels are: *10%, **5%, ***1%.
As shown in Table 3, we find that TPS appears to shift Salvadorans into modestly higher-wage occupations in which a larger percentage of workers hold a government license, but does not shift them into occupations that are more likely to employ citizens. The average wage of Salvadoran occupations increased by $0.39, a 2.3% increase. This effect is about one-fifth of the imprecisely-estimated $2.15 increase in hourly earnings, suggesting that changes in occupation are not the primary driver of increased wages after TPS. We find that the share of workers in a recipient’s occupation with a government license increased by 0.9 percentage points—a 13% increase. Because legal status is necessary to receive any occupational license, this finding is consistent with TPS expanding the range of employers and types of work available to recipients. However, the small magnitude of the effect on occupational licensing makes it unlikely that licensing drives wage gains: most estimates suggest that licenses raise wages by 15% or less (Dept. of the Treasury 2015). Meanwhile, we find a positive but economically insignificant increase in the fraction of workers in TPS recipients’ occupations who are noncitizens. As a final piece of evidence suggesting that TPS improved the quality of employment opportunities for recipients, we find a 25% reduction in self-employment following the adoption of TPS in panel D. Reductions in self-employment may indicate increased availability of paid, formal employment. Together, these findings provide some evidence that TPS recipients move into higher-quality occupations, but occupation change accounts for a small share of earnings growth.
Homeownership and Driving to Work
We next examine the effect of TPS on the likelihood of living in a home owned by a household member (hereafter called homeownership) and the likelihood of driving to work. Homeownership is defined as living in a dwelling that is owned by its inhabitants (including other family members and including homes that are mortgaged). Driving to work is defined as traveling in a privately-owned car, truck, or van, including as a passenger. Owning a home involves significant financial commitment to the United States. It may be helped by legal status both because the risk of deportation can make buying a home risky and because legal immigration status can help buyers secure mortgages. Likewise, legal status makes it easier to obtain a driver’s license: undocumented immigrants cannot obtain drivers’ licenses in 32 states and may be reluctant to create formal records of their presence in the United States even where they can legally obtain a license. In addition, owning a car may increase the financial losses that an undocumented immigrant suffers from deportation.
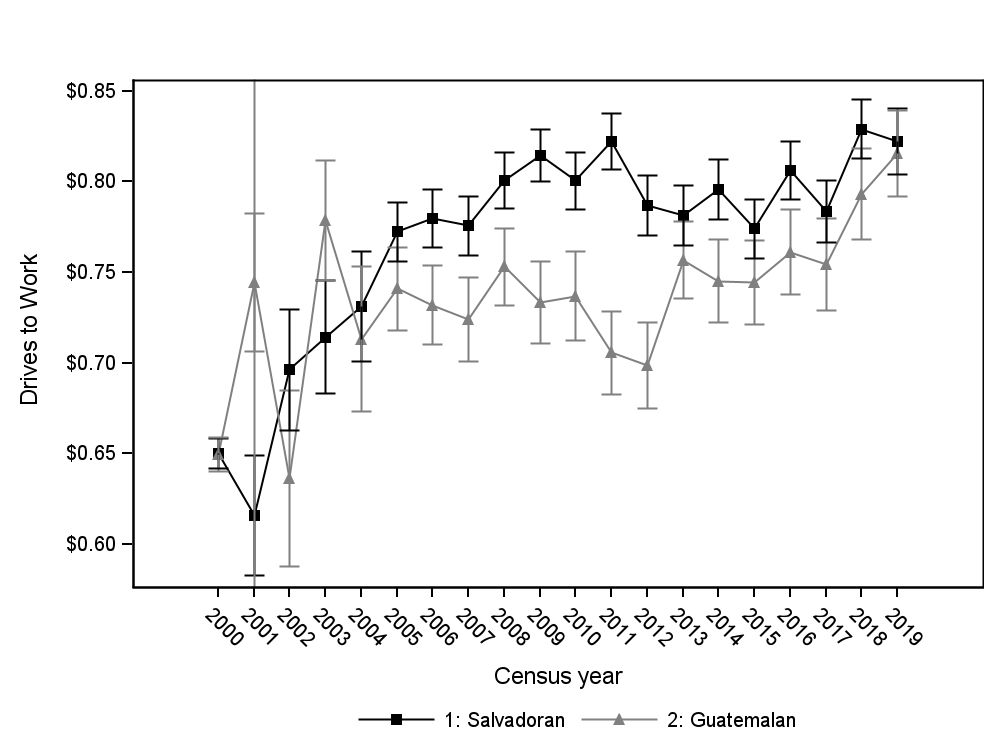
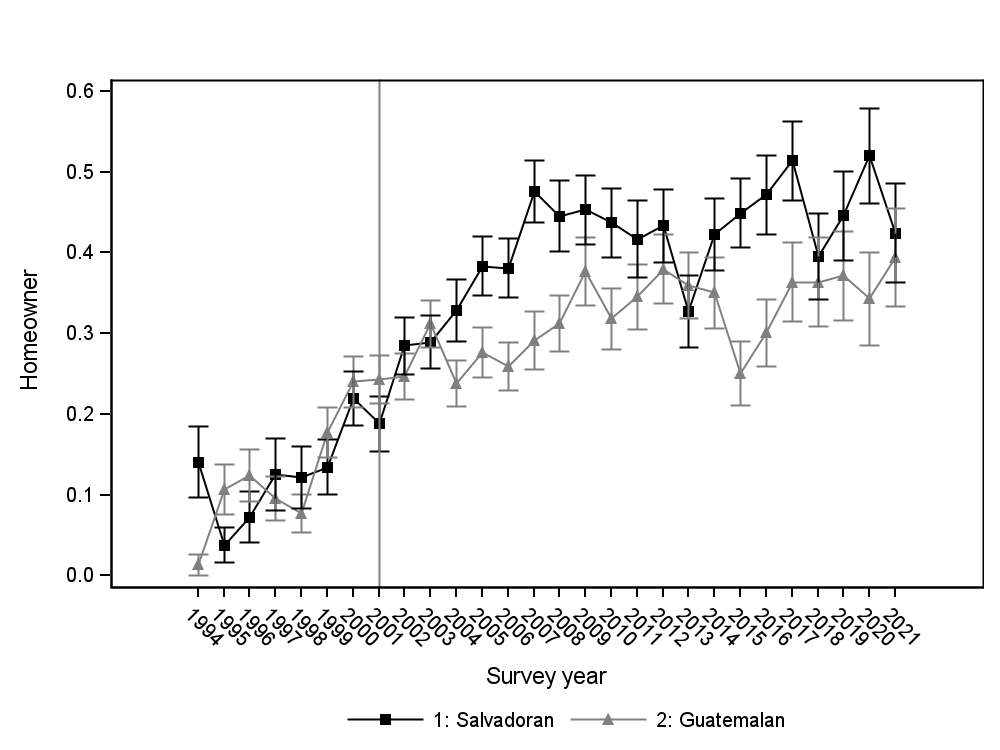
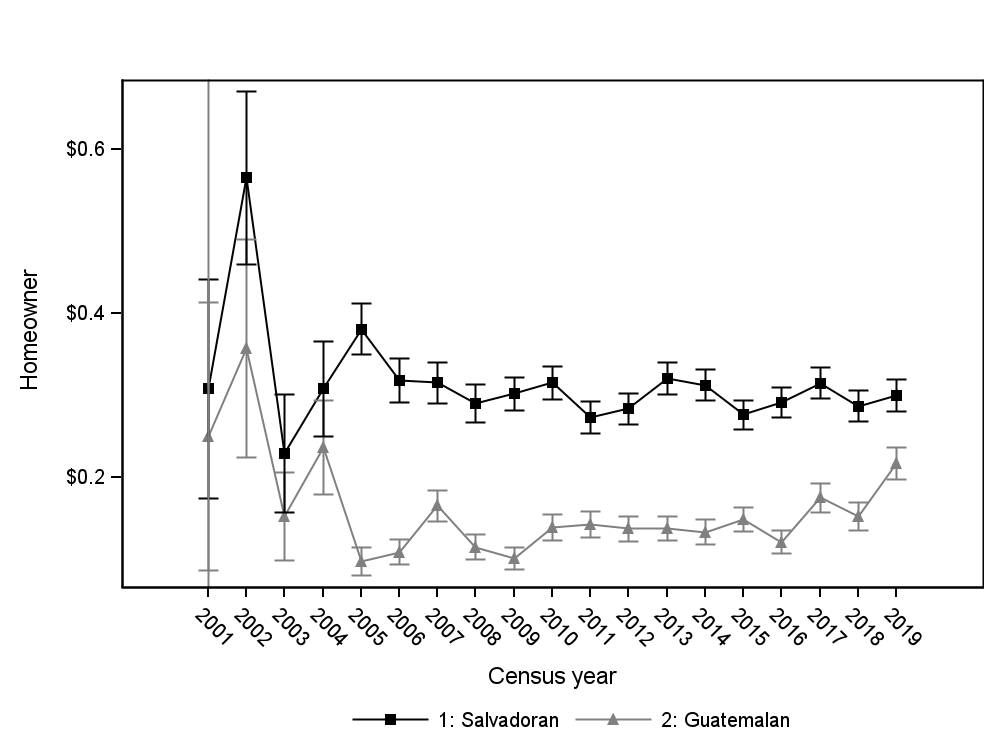
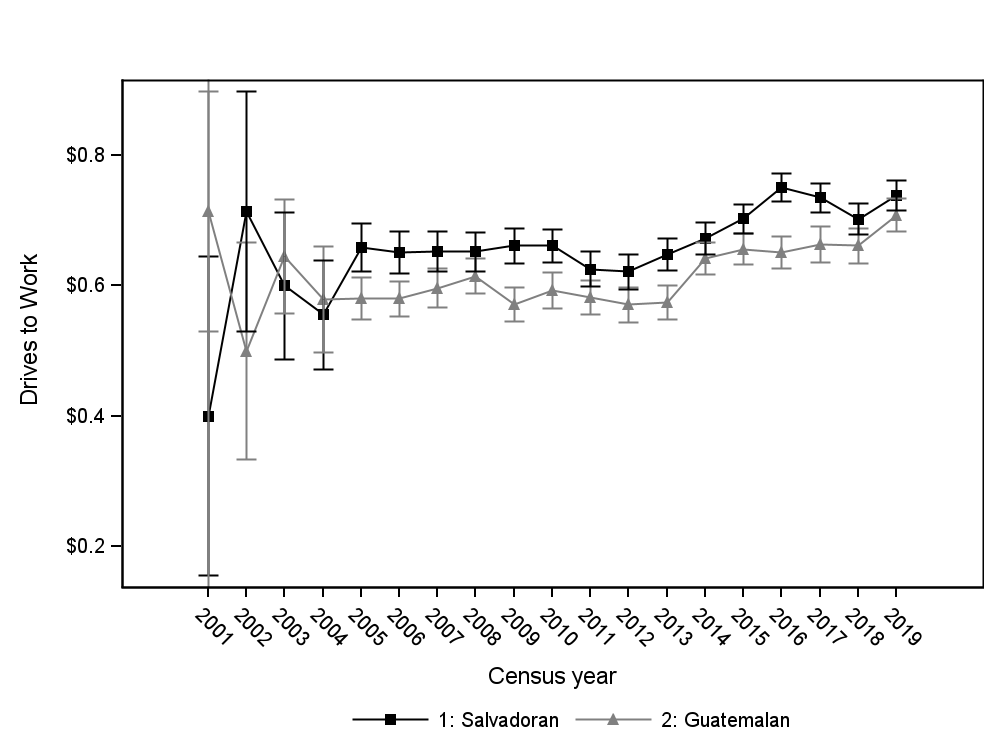
As shown in panels A and B of figure 6, Salvadoran homeownership rates were somewhat above Guatemalan homeownership rates in 2000, prior to the granting of TPS. While the two groups experienced similar growth in homeownership from 2000–2004, Salvadoran homeownership rates increased to nearly 50% from 2005–2008, increasing the gap between Guatemalan and Salvadoran homeownership rates to more than 20 percentage points. Nationals of both countries experienced declines in homeownership beginning with the 2009 housing market collapse. However, the gap in homeownership rates only began to close in 2017, with increasing Guatemalan homeownership.
Figure 6. Means and Event Studies Comparing Homeownership and Driving to Work for Salvadoran and Control Immigrants
(A) Homeownership: Means
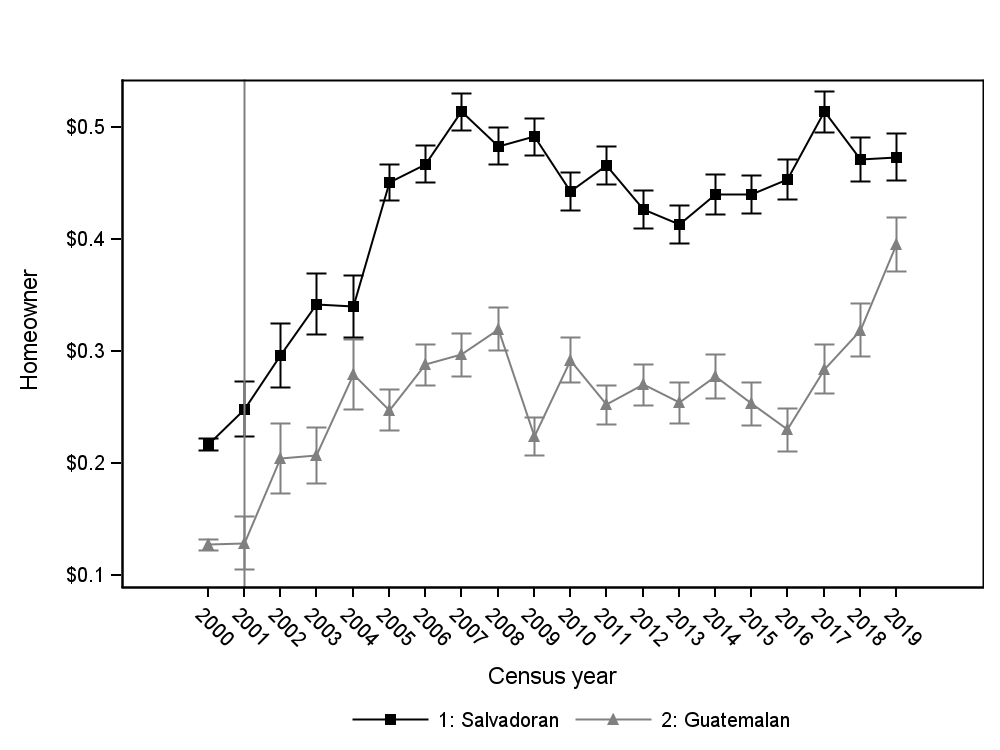
(B) Drives to Work: Means
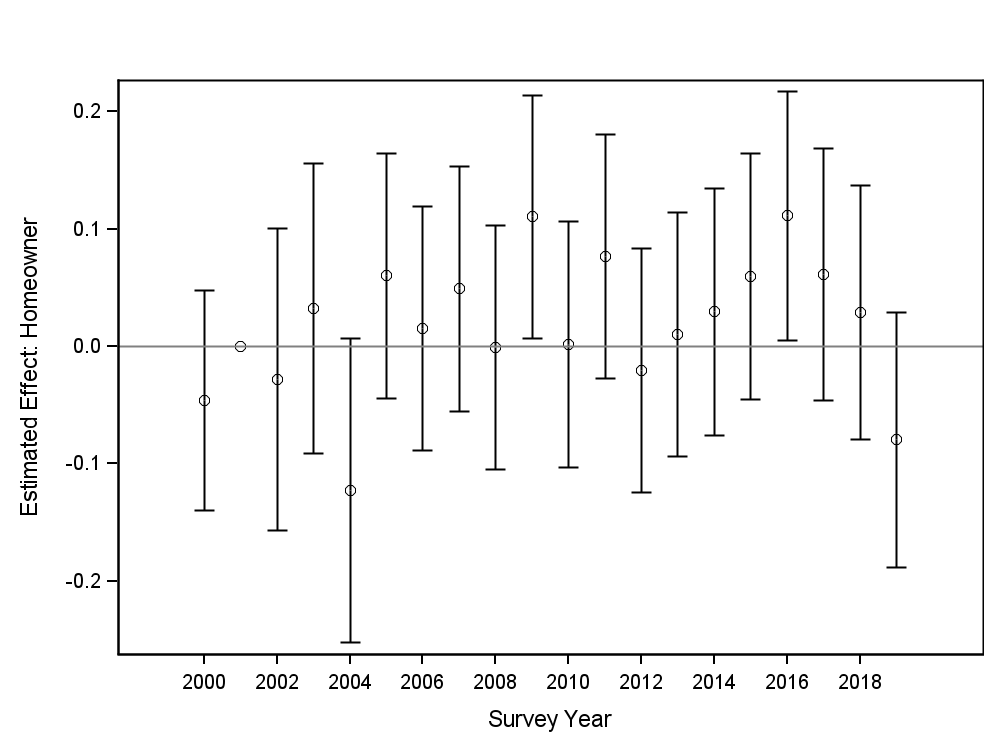
(C) Homeownership: Event Study
(D) Drives to Work: Event Study
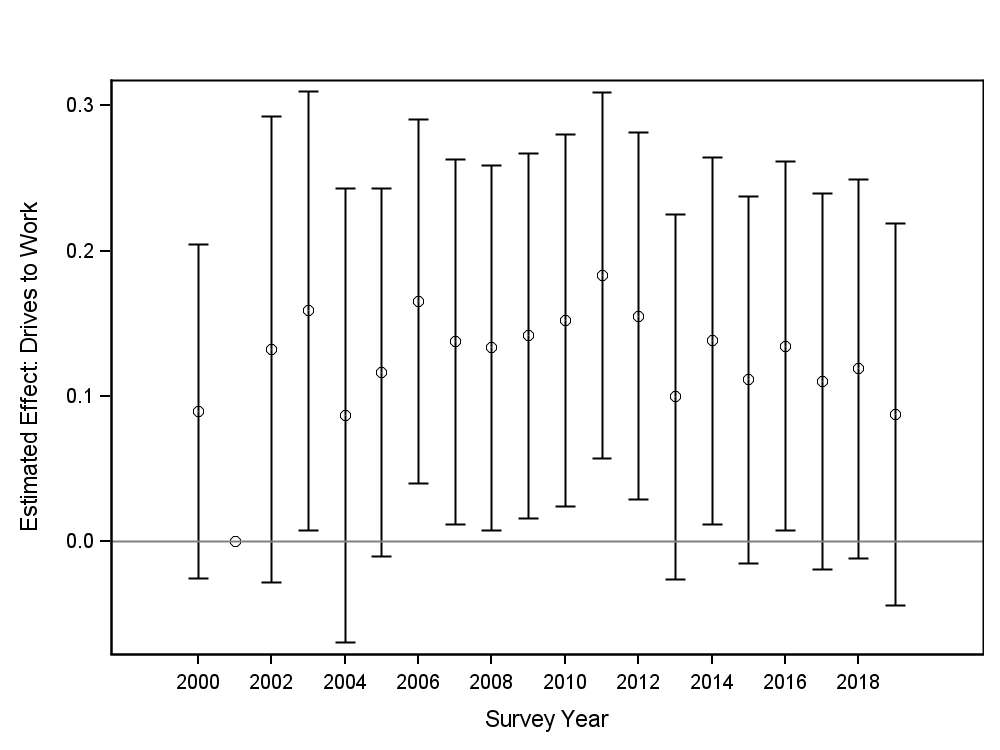
Notes: Panels A and B plot mean outcome values for Salvadoran and Guatemalan respondents to the ACS. Panels C and D plot event study estimates from equation (1) on a sample of Salvadorans and Guatemalans.
Notably, Salvadoran homeownership rates increased shortly after the expansion of subprime lending in 2004 and began to decrease beginning in 2007 with the onset of subprime foreclosures. This timing suggests that the positive effects on Salvadoran homeownership are likely influenced by access to subprime loans. However, it is unlikely that this housing market dynamic invalidates our empirical design. First, Salvadorans had similar incomes and only somewhat higher rates of homeownership than Guatemalans prior to 2004, making it unlikely that the two groups had substantial differences in income, wealth, and access to credit unrelated to TPS. Second, Salvadorans continue to have higher rates of homeownership than Guatemalans through 2018—well after the end of the subprime mortgage crisis. Third, as shown in figure 3, the concentration of Salvadoran and Guatemalan households is very similar across US counties, making it unlikely that Salvadorans were more exposed to subprime lending due to their location. Estimated effects on homeownership are entirely unresponsive to the inclusion of state by year fixed-effects, supporting this assertion. As a robustness check, we restrict the sample to households living in the 12 states where the dissimilarity index of Salvadoran and Guatemalan residents by county is lower than 0.2 in Appendix Table A.8.11As shown in Appendix figure A.1, these states are California, Nevada, Utah, Arizona, Texas, Illinois, Virginia, Maryland, Delaware, Massachusetts, and Vermont. Collectively, these states include 60% of our sample. In this restricted sample, we estimate an average effect of TPS receipt on homeownership of 4.9 percentage points. While lower than the effect on the main sample, this estimate is substantial and highly statistically significant. Lastly, as shown in Table 1, Salvadoran homeownership rates were lower than Mexican homeownership rates in 2000. We will show in Section 5.2 that estimated effects on Salvadoran homeownership are of similar magnitude when using a comparison group of Mexican immigrants as when using a comparison group of Guatemalan immigrants.
We also see evidence that TPS increased recipients’ likelihood of driving to work. Panels B and D of figure 6 show that Salvadoran immigrants were considerably more likely to drive to work and that this difference persisted through 2016. Because many states bar undocumented immigrants from receiving drivers’ licenses, this increase in driving is likely a consequence both of an increased willingness to invest in a car and reduced risks associated with driving. Notably, for both measures, increases in investment attributable to TPS occurred only after several years. This is perhaps unsurprising given the considerable uncertainty among Salvadoran recipients of TPS about the longevity of the program when initially offered.
We validate these results in difference-in-differences regressions shown in Table 4.12Full regression tables are available in Appendix Tables A.5 and A.6. Homeownership rates increased by an average of 8.1 percentage points (a 25% increase) for Salvadorans relative to Guatemalans after the adoption of TPS. Likewise, the rate of driving to work increased by 4.4 percentage points (a 6% increase).
Table 4. Effect of TPS on Homeownership and Driving to Work
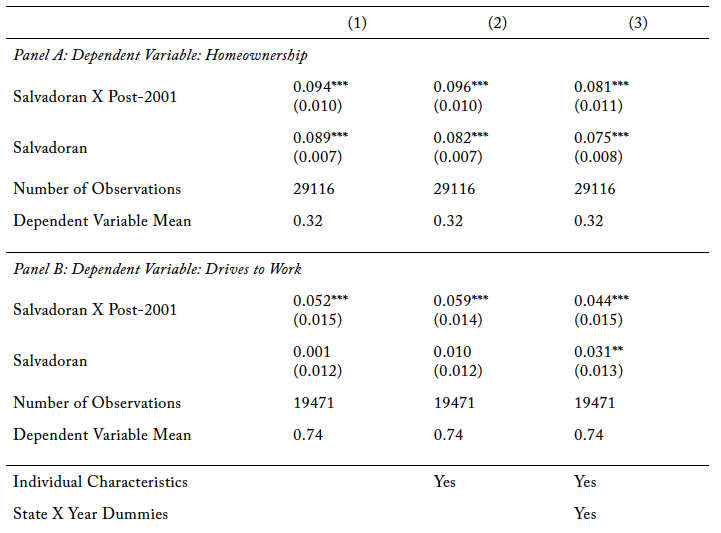
Notes: This table reports OLS estimation results from equation (2) in the text. Column (1) includes a dummy for whether the person was observed after 2001. Column (2) adds controls for race, sex, quadratics of years of education and years in the US, and education category, as described in the text. Column (3) adds state-by-year fixed-effects. Significance levels are: *10%, **5%, ***1%.
Overall, our estimates suggest that TPS had a large, sustained, positive effect on the economic circumstances of Salvadoran immigrants. As shown in figure 7, estimated effects on our primary outcomes of interest are large, with effects on income and homeownership all greater than 15% of the control group mean.
Figure 7. Summary of Main Results
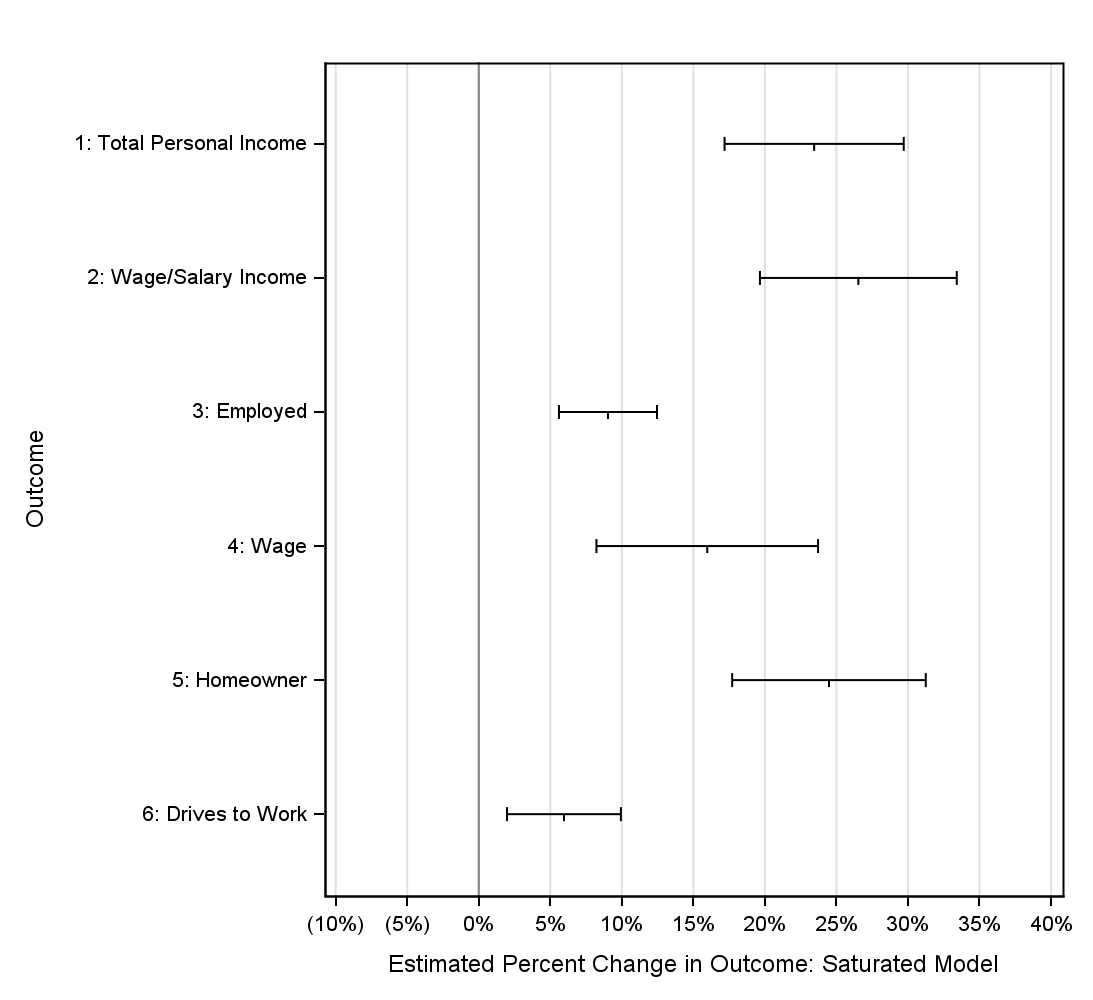
Notes: Figure 7 plots difference-in-differences estimates and 95% confidence intervals from equation (2) in the text as a percentage of control-group mean outcomes.
We also examine effects of TPS on the educational outcomes of children of recipients. However, our estimated effects are highly sensitive to the choice of control group. Consequently, we do not believe that these estimates can provide useful lessons for policy. We describe our analysis of education outcomes in Appendix A in the hopes of informing future research. We follow Orrenius and Zavodny (2015) in exploring heterogeneity of effects by gender, with results shown in Appendix figure A.3. While we find positive and significant effects for men and women for all main outcomes, employment effects are entirely driven by women. In addition, women see double the effect on likelihood of driving to work than do men—likely as a consequence of having a much lower probability of driving to work in the pre-period.
Threats to Empirical Strategy and Robustness Checks
Our results depend on the assumption that absent the offer of TPS in 2001, the incomes and investments of likely undocumented immigrants born in El Salvador would have experienced similar changes to those born in Guatemala. While this assumption is supported by the similarity in characteristics of Salvadoran and Guatemalan immigrants, it is threatened by a few factors.
First, it is possible that the earthquakes, violence, and social instability in El Salvador that led to the offer and continued extension of TPS could have influenced our outcomes of interest regardless of TPS. Such factors would not have directly affected Salvadoran-born immigrants already in the United States, however they might have had a number of indirect effects. For instance, the volatile environment in El Salvador may have increased the need for remittances, thereby increasing earnings, wages, and labor market outcomes of US residents. Conditions in El Salvador may also have spurred increased immigration to the United States, altering the labor supply decisions and housing demand of our treated group over time through social ties or network effects.
Alternatively, major macroeconomic shocks in the early 21st century, including the 2008 financial crisis and Chinese import competition, may have differentially impacted Salvadorans relative to Guatemalans for reasons related to unobserved differences across these two groups. Likewise, changes in the perceptions and political power of Salvadorans over 20 years might have led to improved economic circumstances regardless of TPS. Lastly, TPS or changing conditions in El Salvador might have reduced the rate of return migration among TPS-eligible Salvadorans. In this case, our estimates could be biased by changes in the composition of Salvadorans remaining in the United States.
Pre-Trends
We address these concerns in a few ways. First, we examine pre-trends in some of our outcomes of interest using the Current Population Survey Annual Social and Economic Supplement (CPS-ASEC). While the CPS-ASEC has sufficient information to identify our treatment sample beginning in 1994, when it first asked about respondents’ birthplace, it is a much smaller survey than the ACS, with samples ranging from 130,476 to 217,209. As a result, estimated pre-trends and effects measured in the CPS-ASEC are imprecise. Figure 8 shows pre-trends in two variables: Total Personal Income and Homeownership.
Figure 8. Pre-Trends Estimated using the CPS-ASEC
(A) Total Personal Income: Means
(B) Homeownership: Means
(C) Total Personal Income: Event Studies
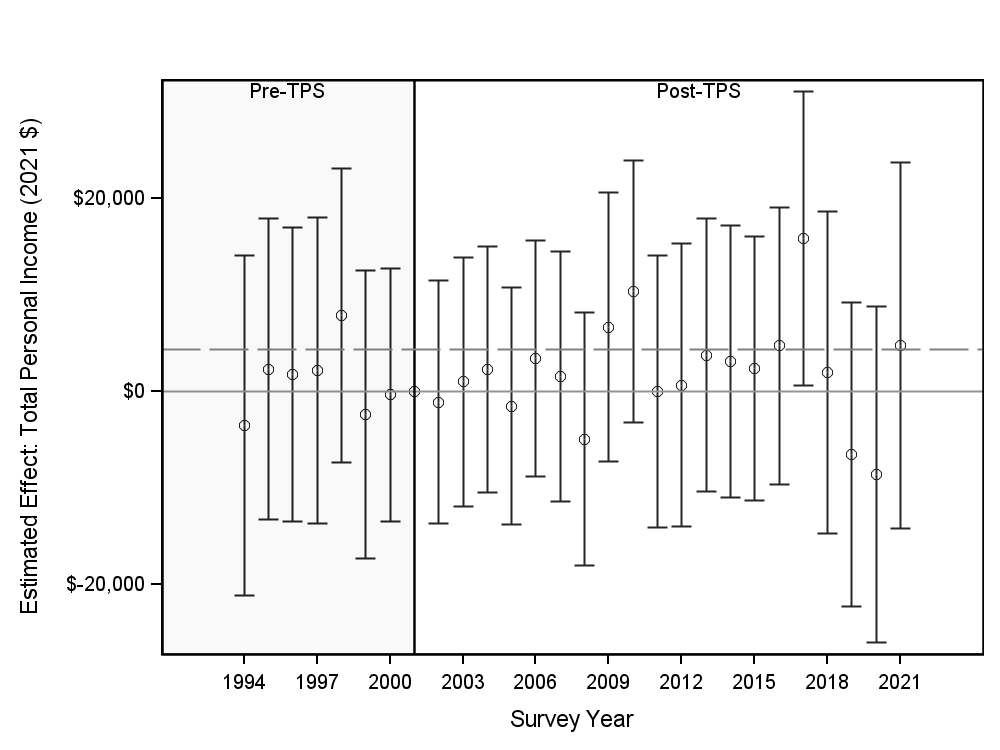
(D) Homeownership: Event Studies
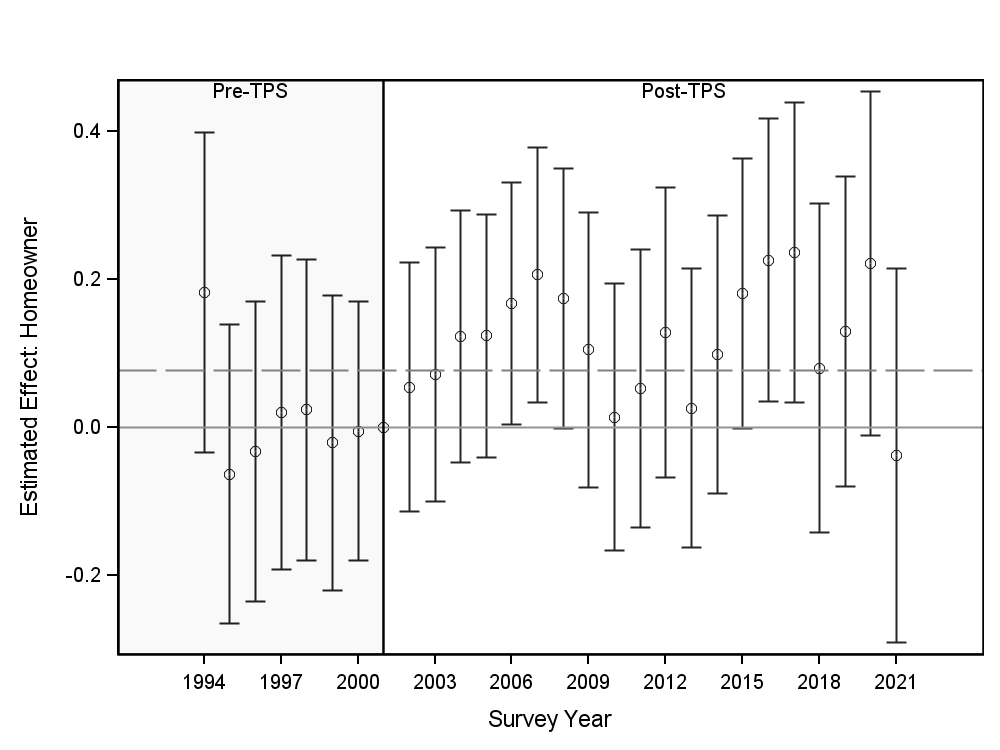
Note: Estimates from CPS-ASEC. Dashed lines represent average estimated effect from Decennial Census and American Community Survey.
Panel A of figure 8 shows that pre-trends are highly similar for Salvadoran and Guatemalan immigrants for personal income. The one exception is the year 1998, shortly after some Salvadoran immigrants became eligible for NACARA—average personal income increased for Salvadorans relative to Guatemalans. While the selected sample should not have been eligible for NACARA, it is possible either that some individuals misreported their year of entry to the US in the CPS or that increases in the incomes of relatives and neighbors resulted in higher reported incomes. Panel B shows that Salvadoran and Guatemalan-born homeownership rates experienced similar trends from 1994 to 2000, but Salvadorans experienced increases in homeownership relative to Guatemalans after 2004.
Alternate Comparison Groups
Next, we estimate our main results using three alternative comparison groups: Mexican immigrants, late-arriving Salvadoran immigrants, and a synthetic control group composed of nationals of nine Latin American countries. For each alternative control group, we replicate the difference-in-differences estimation described in equation (2). In each analysis, we restrict the sample to Spanish-speaking noncitizens with less than a high-school education, who arrived in the United States after 1990. We summarize estimated effects with each alternative control group in figure 10, and provide full results for each in Appendix Tables A.1 – A.6. We find qualitatively similar results for our main outcomes using all of these alternative control groups.
Mexican-Born Immigrants
First, we estimate equation (2) replacing Guatemalan-born immigrants with Mexican-born immigrants. Migrants from El Salvador are more similar to those from Guatemala in their migration history, exposure to US policy prior to 2000, and geography of settlement within the United States, as described in Section 2. Despite this, Mexican migrants offer a few advantages as a control group. First, Mexicans had a higher rate of homeownership relative to Salvadorans in 2000, as shown in Table 1. As a result, analyses with a Mexican comparison group should be biased in the opposite direction of analyses with a Guatemalan comparison group if homeownership is related to unobserved correlates of socioeconomic status. Furthermore, because there are more than 10 times as many Mexican immigrants in the United States as there are Guatemalan immigrants, estimates using Mexican immigrants as a control group are more precise than those using Guatemalans.
Synthetic Comparison Group
Next, we compare TPS-eligible Salvadoran migrants to a synthetic comparison group constructed of nationals from nine Latin American countries. We include all countries that did not receive TPS between 1990 and 2019 and had at least 1000 sample members across the 2000 census and 2001–2019 ACS.13The synthetic comparison group is drawn from nationals of Mexico, Costa Rica, Guatemala, Cuba, the Dominican Republic, Argentina, Colombia, Ecuador, and Peru. Following Abadie, Diamond and Hainmueller (2010), we construct a synthetic comparison group by calculating country weights for each comparison country that minimize mean differences between Salvadorans and the synthetic control group in 2000 on a broad set of sample characteristics. The weights placed on nationals of each country for each outcome variable are shown in Appendix figure A.2. We compare mean outcomes in each year for El Salvador and the synthetic control group in figure 10 and Appendix Tables A.1 through A.6.14Because our data include only one pre-treatment year, we are unable to produce meaningful statistical inferences via the permutation resampling procedures described in Abadie, Diamond, and Hainmueller (2010). We, instead, calculate difference-in-differences estimates using equation 1. In order to preserve the relative weight on each comparison country shown in figure A.2, we apply an individual weight to person i from comparison country j equal to the country weight multiplied by the ratio of the Salvadoran sample size to the country sample size:  . Note that, in contrast to permutation-based inference, the standard errors produced by this estimate reflect sampling-based uncertainty only, rather than design-based uncertainty (Abadie et al. 2020).
Late-Arriving Salvadoran Immigrants
Last, we follow Orrenius and Zavodny (2015) in comparing Salvadoran immigrants who arrived in the US after 2001, and were thus ineligible for TPS, to those who arrived between 1991 and 2000, and were thus eligible for TPS. We include early and late-arriving Guatemalan immigrants as a control group in a difference-in-differences design as follows:

Where Salv is an indicator of whether the respondent was born in El Salvador, Pre2000 is an indicator of whether the respondent entered the United States between 1991 and 2000, are a set of time-varying individual controls consisting of quadratics of age and years in the United States, gender, age, race, and educational attainment. are a set of state-by-year fixed-effects.
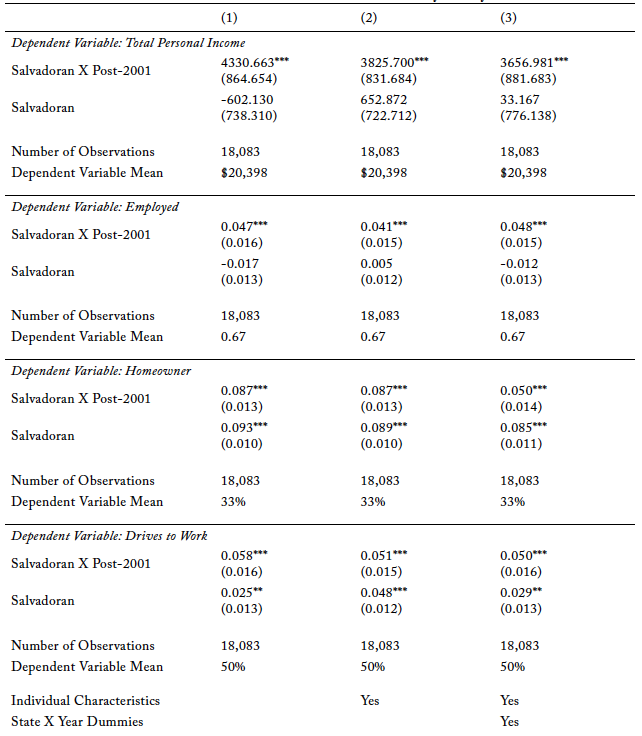
We estimate this equation using the 2006–2019 ACS. This robustness check addresses the concern that some factor other than the extension of TPS benefitted Salvadorans, but not Guatemalans. Were this the case, we would expect the economic circumstances of late-arriving Salvadorans to improve from 2001 to 2019 relative to late-arriving Guatemalans. We examine this in figure 9 by plotting mean outcomes by year for post-2001 migrants from El Salvador and Guatemala.
Figure 9. Immigrants Who Entered the US after 2001
(A) Total Personal Income: Means
(B) Wage Income: Means
(C) Homeownership: Means
(D) Drives to Work: Means
Notes: Estimates from ACS. Sample includes individuals who migrated to the US in 2001 or later and were thus ineligible for TPS regardless of their country of origin.
As shown in figure 9, Salvadoran immigrants who entered the US in the years immediately following 2001 had lower incomes than did immigrants from Guatemala—likely as a consequence of the impoverishment of Salvadorans present in El Salvador during the earthquakes. By 2005, however, differences in income and driving to work had largely disappeared, and post-2001 Salvadoran immigrants remained indistinguishable from control immigrants on these measures through 2019. This pattern of differences presents a marked contrast to differences seen in pre-2000 immigrants, for whom outcomes were largely similar between Salvadoran and Guatemalan immigrants in 2000, but grew over time after Salvadoran immigrants became eligible for TPS. We interpret these results as evidence that our findings are not driven by trends in the US economy that disproportionately benefit Salvadorans relative to Guatemalan immigrants, by social network effects unique to Salvadorans, or by changes in Salvadoran political power.
While late-arriving Salvadoran immigrants had higher-rates of homeownership than late-arriving Guatemalans, this difference declined somewhat in the 20 years following the granting of TPS. One potential explanation for this is that post-earthquake Salvadoran immigrants may have been more likely than other immigrants to live with homeowning relatives in the US. Notably, while homeownership rates increased substantially for pre-2001 Salvadoran immigrants after 2005, there was no similar increase for post-2001 Salvadoran immigrants, making it unlikely that Salvadorans were differentially affected by changes in the mortgage and housing markets for reasons other than TPS.
Results of Robustness Checks
Figure 10 summarizes the results of each of these robustness checks, and compares them to our main findings. The estimated effects of TPS using all four comparison groups are broadly comparable to our main findings, with most estimates falling within the confidence intervals for our main estimates. This suggests that our results are unlikely to be driven by unobserved differences between Guatemalan and Salvadoran immigrants.
Figure 10: Effect Estimates with Alternate Comparison Groups
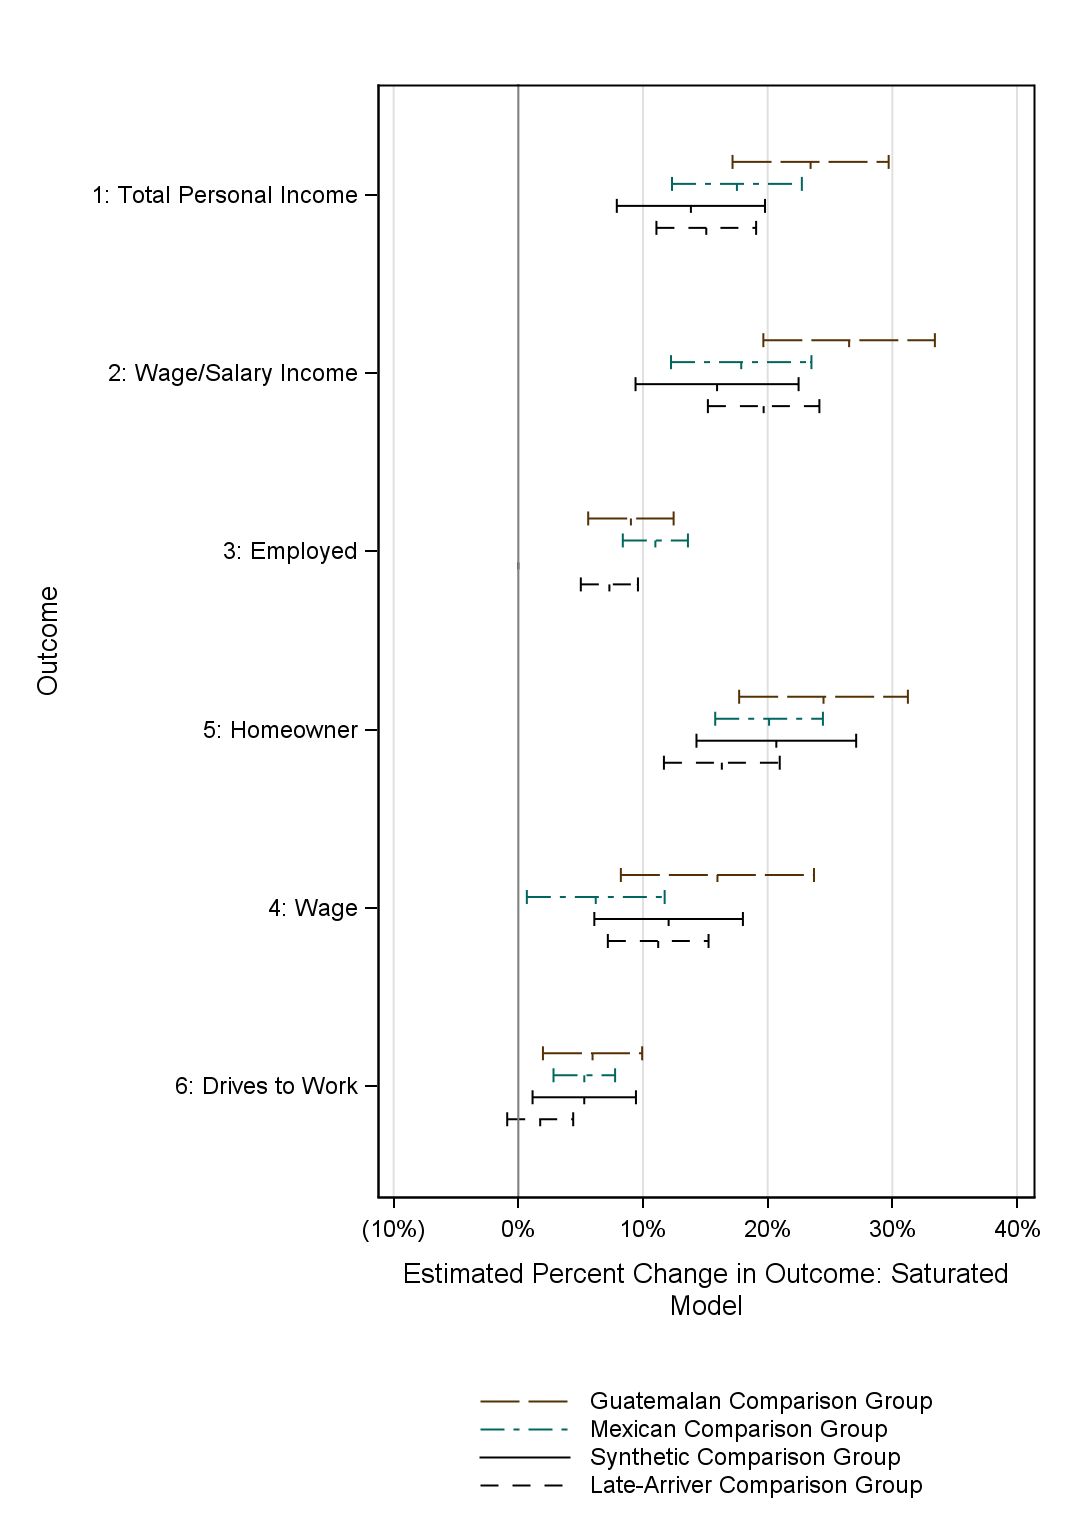
Notes: This figure plots difference-in-differences estimates and 95% confidence intervals from equation (2) in the text as a percentage of control-group mean outcomes. The figure compares the primary estimation strategy to three alternative estimation strategies described in Section 5.2 of the text.
Differential Return Migration
Lastly, we directly examine the possibility that worsening conditions in El Salvador could have influenced return-migration, particularly of relatively high-wage or successful immigrants. As described in Rho and Sanders (2016), immigrants are more likely to return to their country of origin when their earnings are larger in the United States. This is a potential concern for us because if relatively high-earning Salvadorans remain in the US longer than relatively high-earning Guatemalans, measured average incomes and assets would increase for Salvadorans over time even if TPS had no effect on the incomes or assets of individuals.
We examine return-migration by estimating the fraction of our population of interest residing in the United States in each year. We do this by counting, in each year, the number of census respondents who claimed to be Salvadoran or Guatemalan immigrants who entered the country between 1991 and 2000, weighted by ACS sample weights. We impose no further sample restrictions (e.g., we do not require census respondents to be Spanish speaking or to have less than a high school education). For each year after 2000, we then divide this estimated total population value by the estimated population present in the year 2000 in order to estimate the “survival rate”—i.e., the share of sample members present in 2000 who are still present in each year.
Because it is mechanically impossible for the total number of immigrants who arrived in the US prior to 2000 to increase after the year 2000, the true population “survival rate” must be below 100%. However, our estimates represent the number of ACS survey respondents, rather than the number of people actually present. For instance, Van Hook et al. (2014) find that nonresponse rates for undocumented Mexican immigrants fell over time, from an estimated 18% in 2000 to 8% in 2010. As a result, increases in survey response can push estimated “survival” rates above 100%. Indeed, we find “survival” rates above 100% in early years.
We show in figure 12 that immigrants from El Salvador are substantially more likely to remain in the ACS sample after 2000 than are immigrants from Guatemala.15Estimated attrition is, in fact, negative from 2001 to 2016 for Salvadoran immigrants. This is likely a consequence of nonresponse bias: because undocumented immigrants are less likely to respond to government surveys, the provision of TPS may have increased response rates among Salvadoran immigrants. We estimate a survival rate of 100% for Salvadorans in 2014, but of 78% for Guatemalans. By 2019, 77% of Salvadorans remained in the sample, compared to 60% of Guatemalans.
Figure 11: Estimated Population Attrition from Return Migration or Death
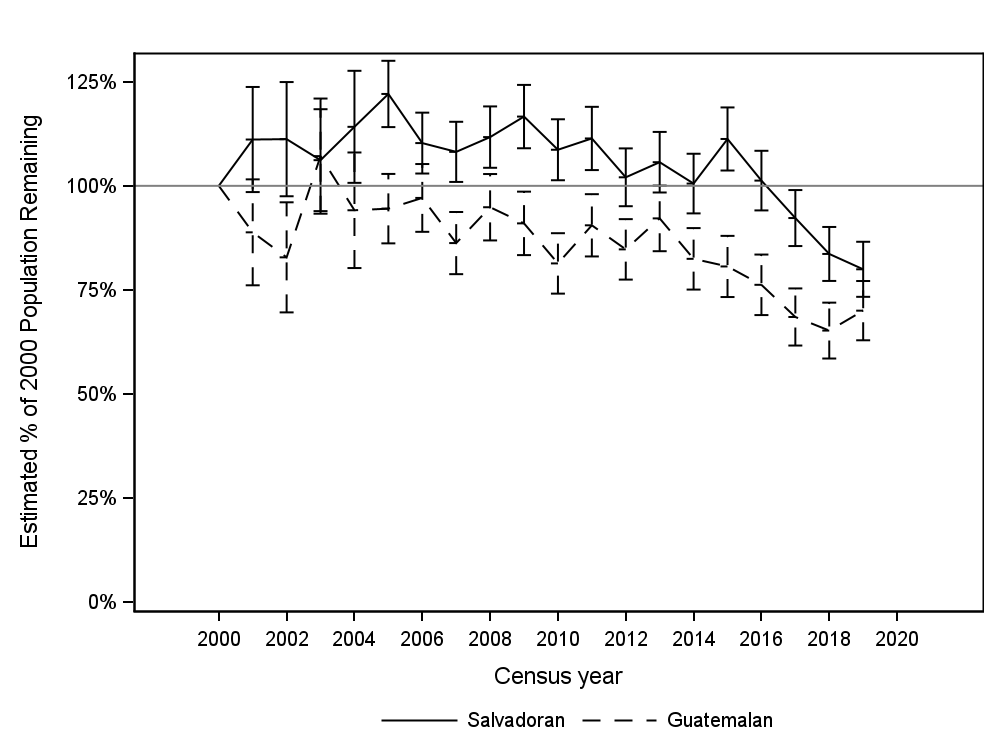
Notes: This figure shows the estimated population of sample members present in the United States in each year from 2000 to 2019 as a percentage of the 2000 population. Note that this measure of attrition reflects a combination of migration out of the United States and changes in survey non-response. As a consequence, it is possible for the estimated population to increase. As discussed in the text, survey response rates increased for likely undocumented immigrants after the 2000 census.
These differences in the ACS survey survival rate likely reflect both a lower likelihood to leave the country for Salvadoran immigrants and a greater willingness to respond to the ACS. The receipt of TPS plausibly increased the attractiveness of remaining in the US, while the devastation of the earthquakes and the increases in violence and instability that followed plausibly reduced the attractiveness of returning to El Salvador. At the same time, reduced fear of deportation likely increased the response rate to the ACS of Salvadoran recipients. Indeed, if we use a baseline of 2001 (the first year that TPS was in effect) rather than 2000, we see very similar survival rates for Salvadoran and Guatemalan migrants.
Both sources of differential survival rates could bias our estimates if they differentially affect more economically advantaged Salvadoran immigrants—survey nonresponse likely biases estimates downward while reduced return migration likely biases estimates upward. We examine the possibility of bias in two ways. First, we directly examine differential attrition from the sample by sex and education. As shown in figure 13, we find that differences in sample attrition between Salvadorans and Guatemalans are similar for men and women, and are similar for those with relatively high and relatively low levels of education (among those with less than a high school education). In keeping with Rho and Sanders (2016), we find that relatively highly-educated individuals experience greater sample attrition, likely due to higher rates of return migration.
Figure 12. Differential Attrition from Sample Population by Education and Gender
(A) Women
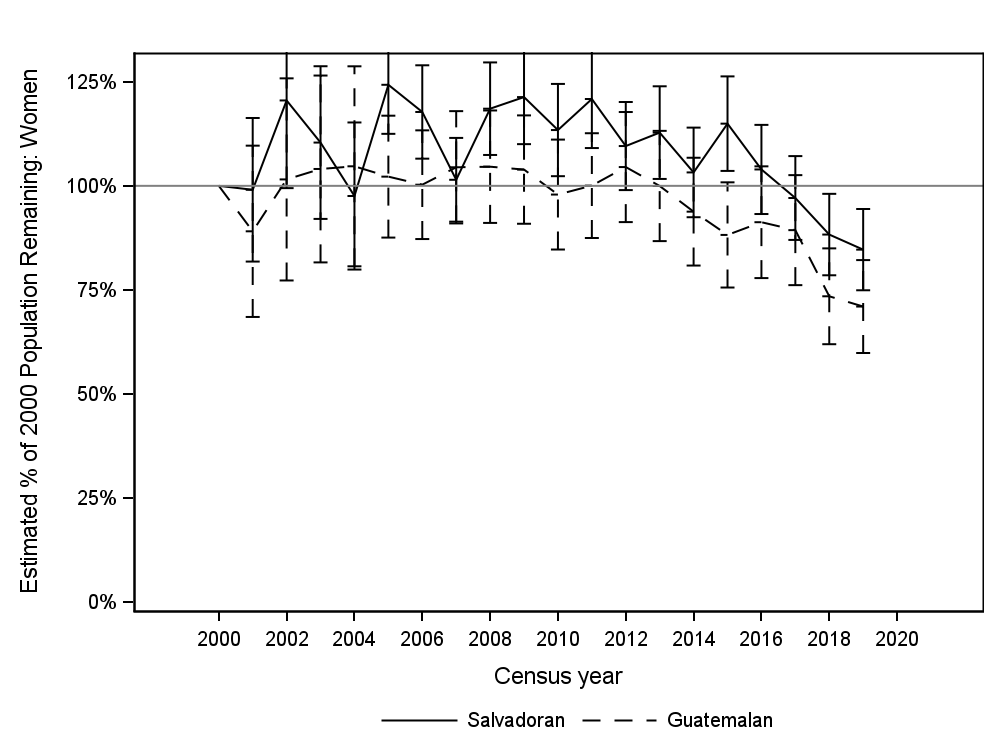
(B) Men
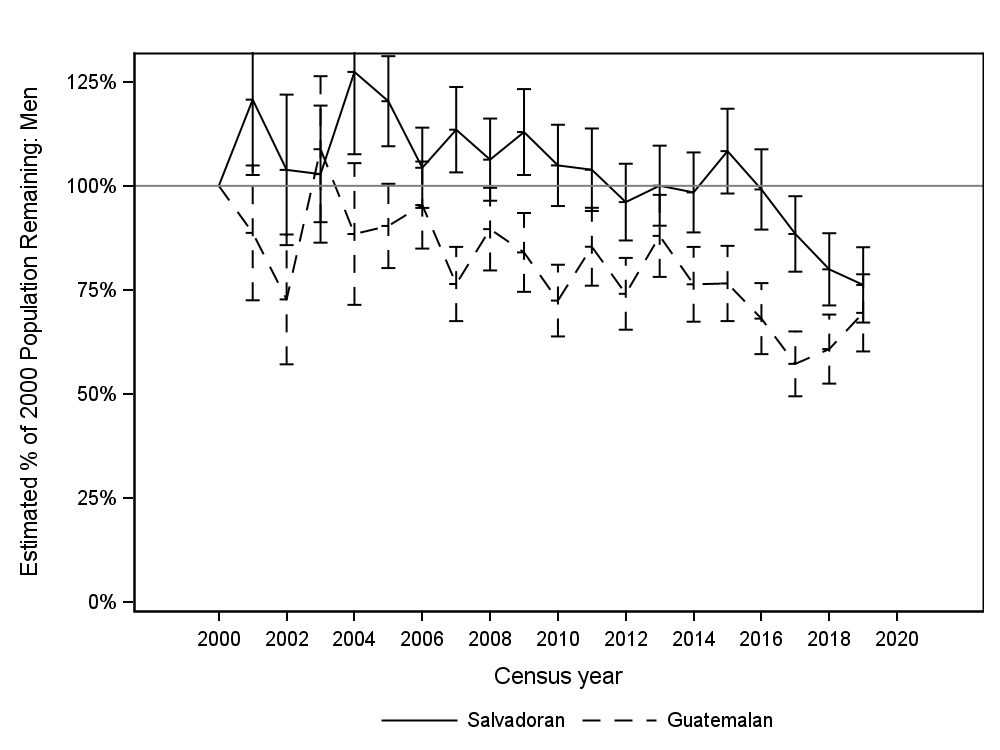
(C) 0–4th grade Education
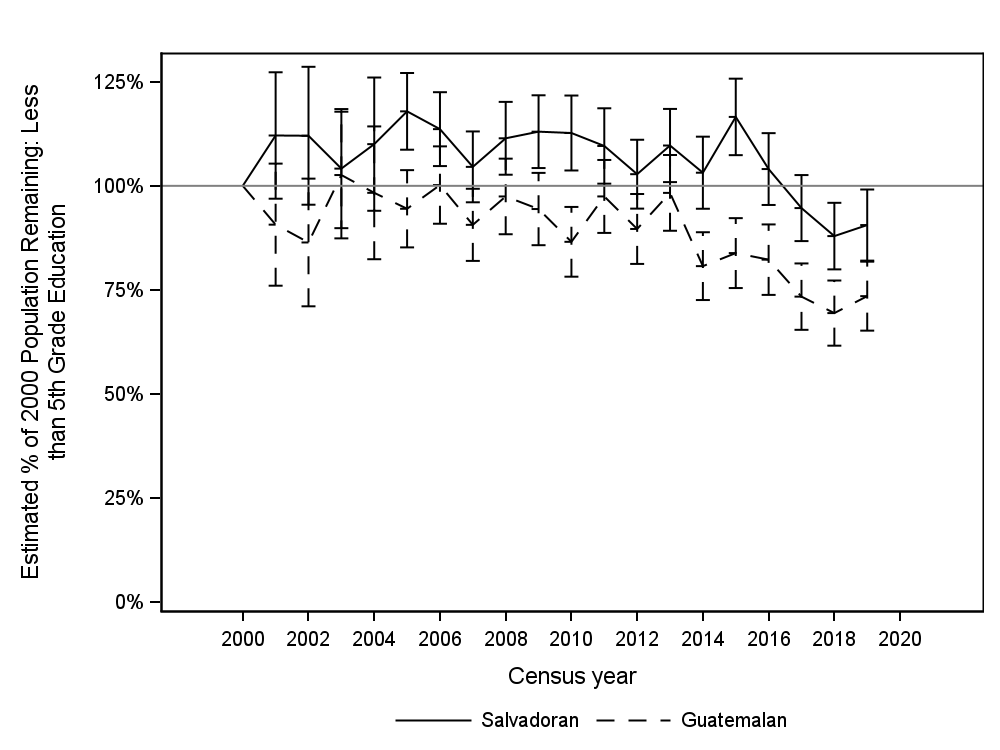
(D) 5th–8th Grade Education
(E) 9th–11th Grade Education
Notes: This figure shows estimated attrition rates for five subpopulations of Salvadoran and Guatemalan sample members.
Lastly, we estimate the size of potential attrition bias by reweighting our sample to reflect the probability that a person remained in our sample based on age, sex, and education. Appendix Table A.9 shows that accounting for attrition has a very small effect on estimated coefficients, suggesting that sample attrition is either not a substantial source of bias or that biases are due only to unobserved characteristics.
Discussion
We find that Temporary Protected Status had a positive, sustained effect on adult recipients: increasing personal income and employment, increasing homeownership, and increasing the likelihood that recipients drive to work. Our analysis brings new evidence on the dynamic impacts of TPS over a 20-year period. Specifically, we show that the positive impacts of TPS on income grow over time, and that positive impacts on employment, homeownership, and driving to work remain substantial over at least two decades. These findings suggest that even very limited legalization of undocumented immigrants can improve life circumstances and provide a basis for financial investment in the United States.
Understanding the effects of temporary legalizations has several important policy implications. TPS and similar programs are the most flexible immigration policy tools available to governments. In the United States, TPS has been extended within weeks of unexpected crises—for instance, the Department of Homeland Security announced that Ukrainians would receive TPS within a week of Russia’s invasion of Ukraine, with protection going into effect less than two months after the invasion. TPS also affects a large number of people: nearly 400,000 people in the United States currently hold TPS. If this tool is effective at promoting economic security for migrants, policymakers may wish to focus on maintaining this flexibility. Furthermore, because TPS provides a minimum level of security and legal status to undocumented immigrants, positive effects of TPS suggest that any form of legalization meaningfully improves the lives of undocumented immigrants.
The policy debate surrounding immigration policies often centers around its impacts on US citizens and the domestic economy. Policies like TPS may have benefits for citizens by encouraging recipients to invest in their schools and neighborhoods and to participate more openly in their communities. On the other hand, TPS may result in greater competition for jobs that require legal status, potentially reducing the incomes of some citizens. Future research should explore the impact of TPS and other legalization policies to non-recipients who live near TPS recipients.
Understanding the effects of immigration policy, especially policy centered on disaster relief, is of growing importance because forced migration is likely to increase in the near future. Severe weather events such as floods, droughts, hurricanes, and wildfires have forced people to migrate, both, within and across national borders in the past (Vigdor 2008; Gröger and Zylberberg 2016; Boustan et al. 2020). Climate change is projected to increase the frequency and severity of such events. If changing weather patterns contribute to political instability, disputes over resources, and mass migration (Abel et al. 2019), policies like TPS could provide a policy tool to alleviate immediate risks to migrants.
Appendix A: Education Effects for Children of Recipients
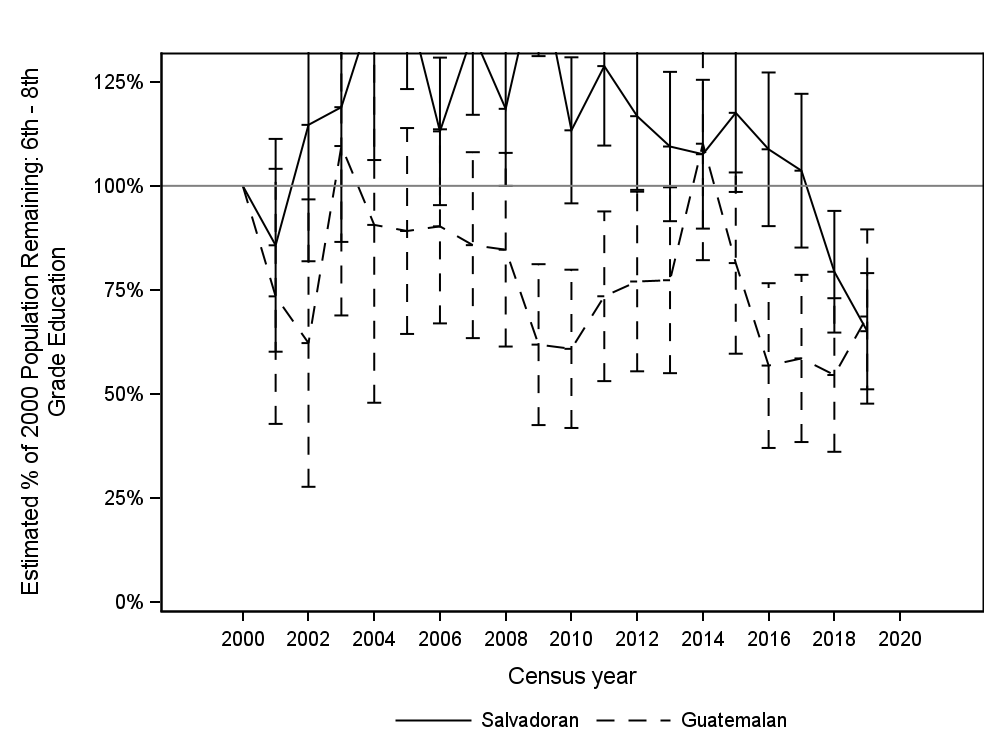
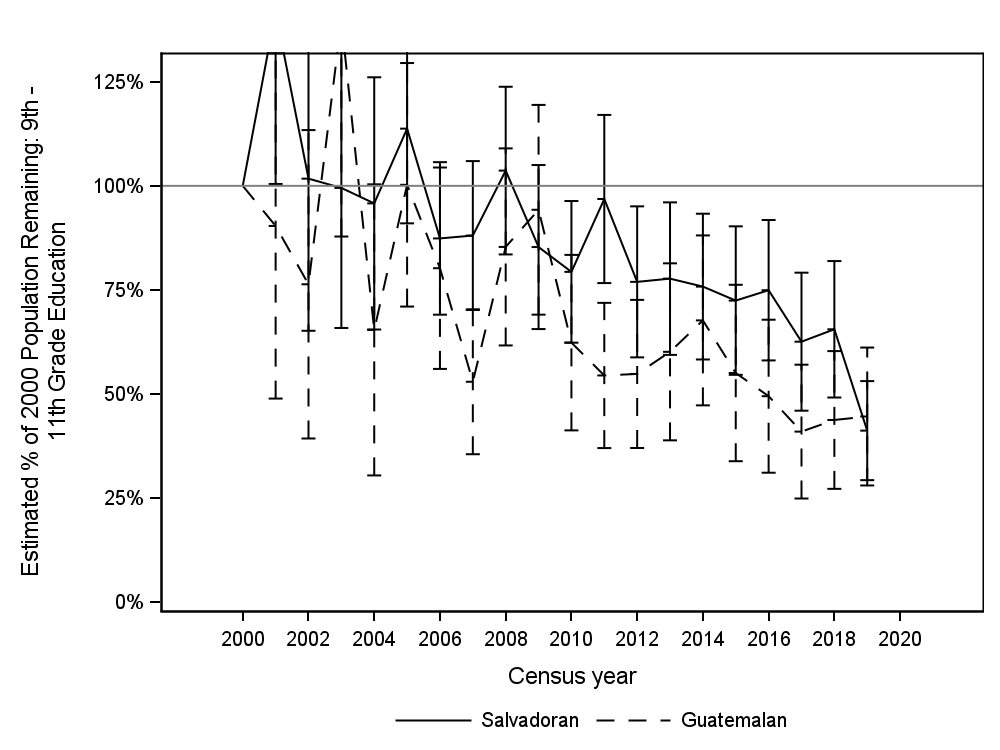
This section describes our estimates the effect of exposure to Temporary Protected Status on the educational attainment of children of recipients. Our estimated effects are contingent on the choice of control group, with Salvadoran children showing improved educational outcomes relative to the children of Central American immigrants, but worsened outcomes relative to children of Mexican immigrants. This analysis focuses on a different sample than our adult analyses, and employs a slightly different empirical strategy.
We examine the educational attainment of the children of adults affected by TPS. This sample consists of two groups. First, we look at children currently living with parents who were born in El Salvador, Central America, or Mexico and who were adults in the year 2000. Second, we look at adults who were born in El Salvador, Central America, or Mexico, who entered the United States prior to 2000, were below the age of 25 in 2000, and were younger than 18 when they arrived in the United States. Because we want to examine educational outcomes for this group, we do not restrict to individuals with low levels of education, individuals who speak Spanish at home, or individuals who are noncitizens. Because we cannot determine the parental characteristics of adults not living with their parents, we also do not apply these restrictions to the parents of children living at home. As a result, outcomes on children examine a less economically disadvantaged group than do outcomes on adults, and examine a group that includes more people who were not affected by TPS.
Our analysis examines the effect of an additional year of childhood exposure to TPS on children. We define years of exposure to TPS as eighteen minus the child’s age in 2001, when TPS went into effect, with children who were over the age of 18 in 2001 having an exposure of 0. We estimate the effect of TPS exposure as:
 (4)
(4)
Where  represents the respondent’s years of childhood exposure to TPS. We also estimate the following event study regressions:
 (5)
(5)
As shown in Appendix Table A.11, TPS has ambiguous effects on children’s education. When compared to a Central American control group, we estimate than 10 years of exposure to TPS increases average years of education by 0.7, increases the likelihood of high school graduation by 8.5%, and increases the likelihood of college graduation by 3.5%. However, when compared to a Mexican control group, we find no positive effects of TPS, and estimate that 10 years of exposure to TPS reduces the likelihood of high school graduation by 6 percentage points.
While we believe that it is likely that the improvement in performance of Mexican-American students after 2001 is a consequence of changing school quality in areas with large Mexican-American populations and small Salvadoran and Central American populations, we have not been able to validate this hypothesis. Indeed, in California, graduation rates have improved more after 2000 in Los Angeles County, which has a high Salvadoran population, than in Central Valley counties with large Mexican-American populations.
Table A.1. Effect of TPS on Total Personal Income
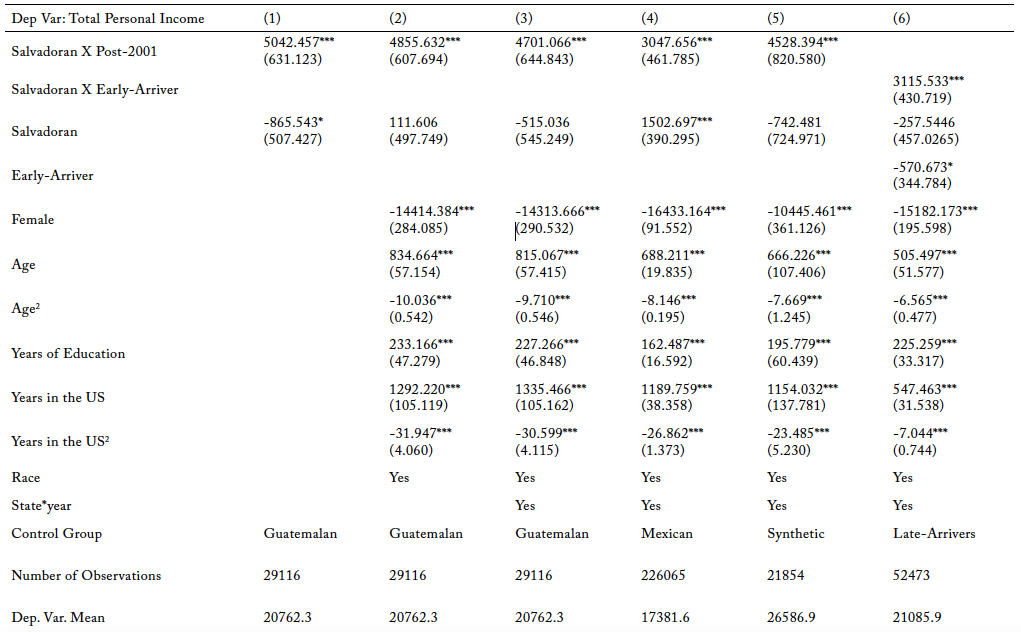
Note: This table reports OLS estimation results from the regressions described in equation (2) in the text. The dependent variable is the respondent’s total household income. Columns 1–3 use a sample of Salvadoran and Guatemalan migrants. Column (4) uses a sample of Salvadoran and Mexican migrants, while column (5) uses a sample of migrants from El Salvador and a set of Latin American countries, as described in the text. Column (6) estimates equation (3) in the text on a sample of Guatemalan and Salvadoran migrants, but includes migrants who arrived after 2001, as described in the text. Significance levels are: *10%, **5%, ***1%. Source: American Community Survey.
Table A.2. Effect of TPS on Wage/Salary Income
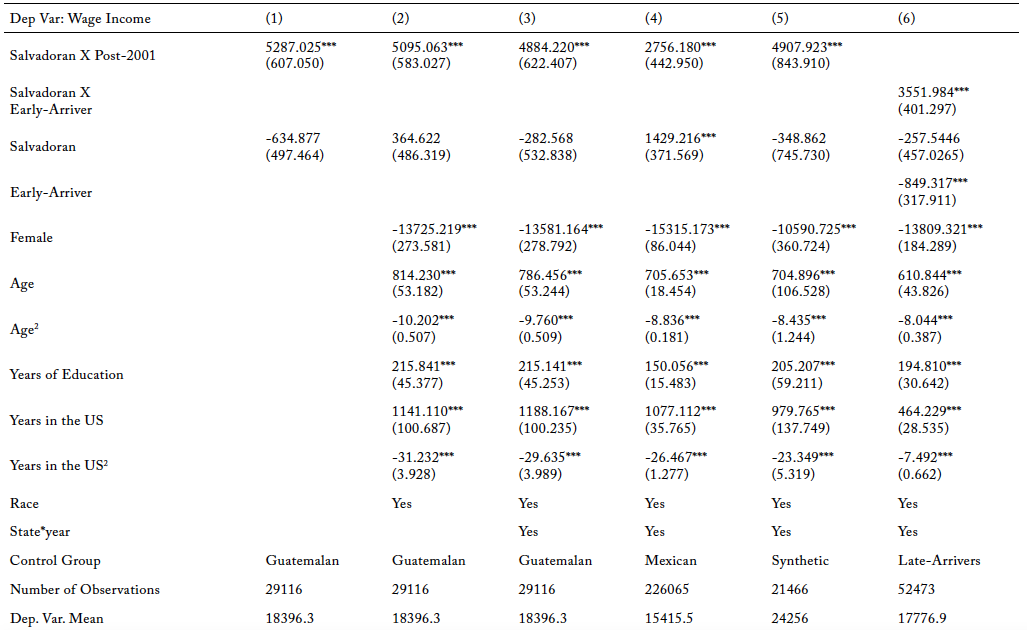
Note: This table reports OLS estimation results from the regressions described in equation (2) in the text. The dependent variable is the respondent’s wage/salary income. Columns 1–3 use a sample of Salvadoran and Guatemalan migrants. Column (4) uses a sample of Salvadoran and Mexican migrants, while column (5) uses a sample of migrants from El Salvador and a set of Latin American countries, as described in the text. Column (6) estimates equation (3) in the text on a sample of Guatemalan and Salvadoran migrants, but includes migrants who arrived after 2001, as described in the text. Significance levels are: *10%, **5%, ***1%. Source: American Community Survey.
Table A.3. Effect of TPS on Employment
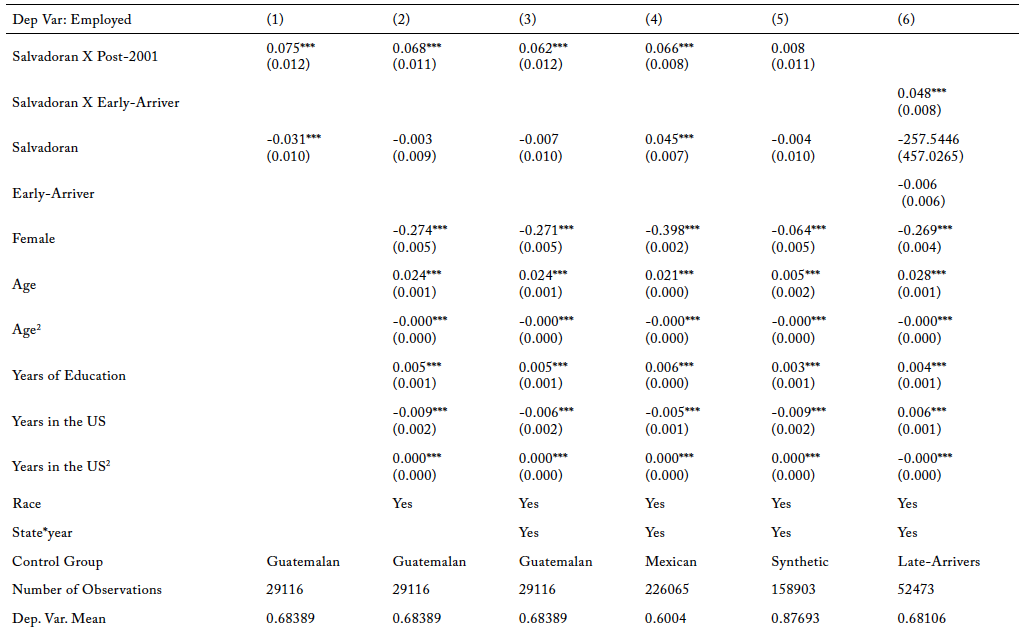
Note: This table reports OLS estimation results from the regressions described in equation (2) in the text. The dependent variable is an indicator of whether the respondent is employed. Columns 1–3 use a sample of Salvadoran and Guatemalan migrants. Column (4) uses a sample of Salvadoran and Mexican migrants, while column (5) uses a sample of migrants from El Salvador and a set of Latin American countries, as described in the text. Column (6) estimates equation (3) in the text on a sample of Guatemalan and Salvadoran migrants, but includes migrants who arrived after 2001, as described in the text. Significance levels are: *10%, **5%, ***1%. Source: American Community Survey.
Table A.4. Effect of TPS on Hourly Wage
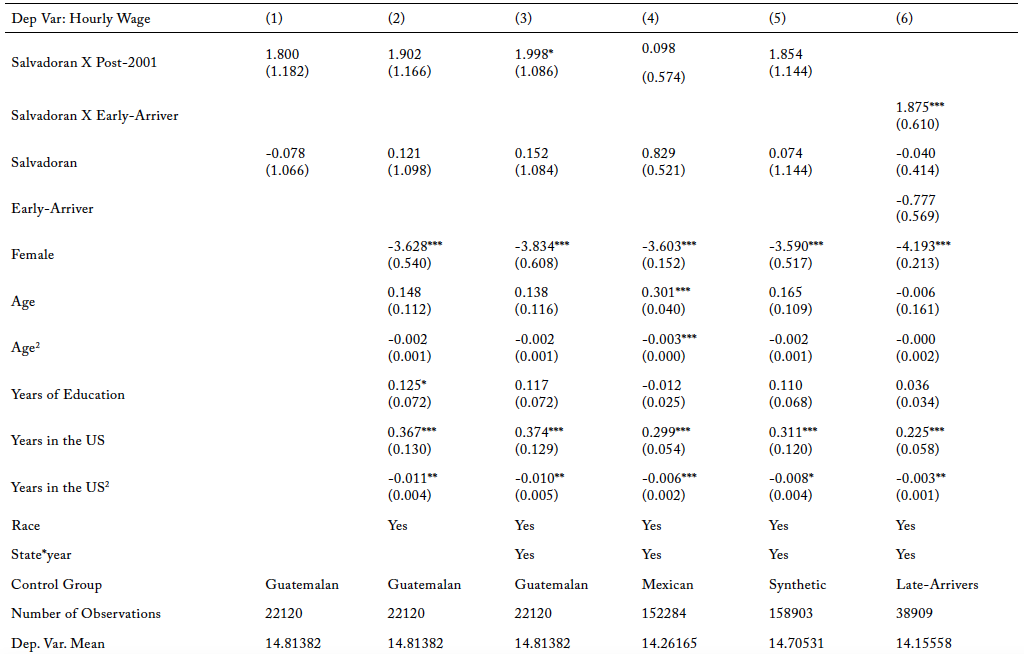
Note: This table reports OLS estimation results from the regressions described in equation (2) in the text. The dependent variable is hourly wage. Columns 1–3 use a sample of Salvadoran and Guatemalan migrants. Column (4) uses a sample of Salvadoran and Mexican migrants, while column (5) uses a sample of migrants from El Salvador and a set of Latin American countries, as described in the text. Column (6) estimates equation (3) in the text on a sample of Guatemalan and Salvadoran migrants, but includes migrants who arrived after 2001, as described in the text. Significance levels are: *10%, **5%, ***1%. Source: American Community Survey.
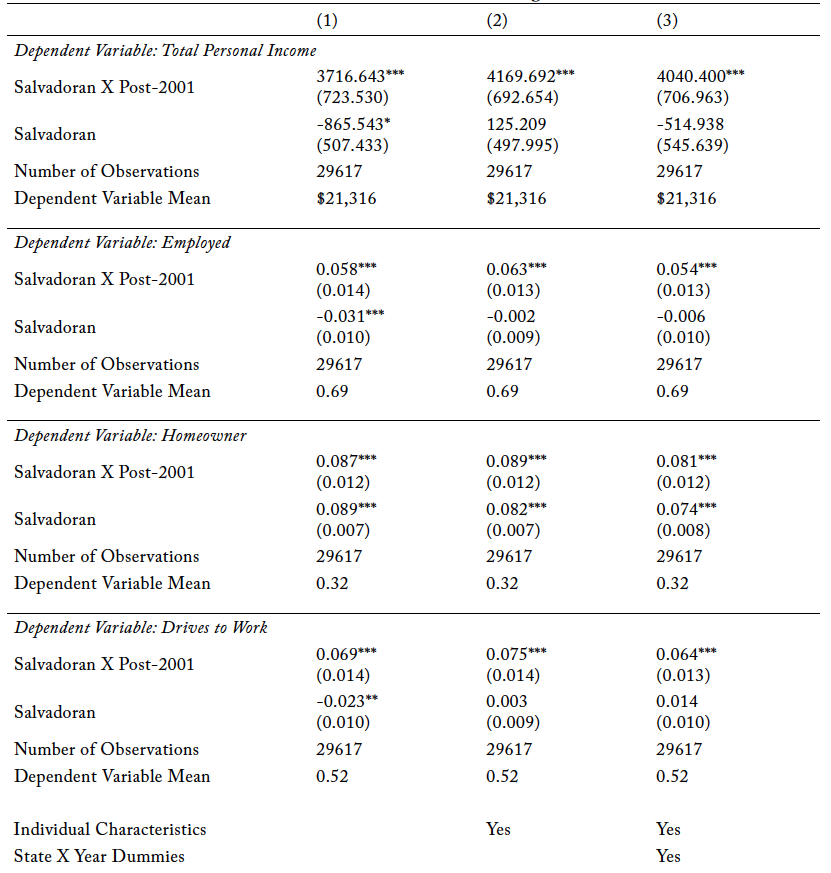
Table A.5. Effect of TPS on Homeownership
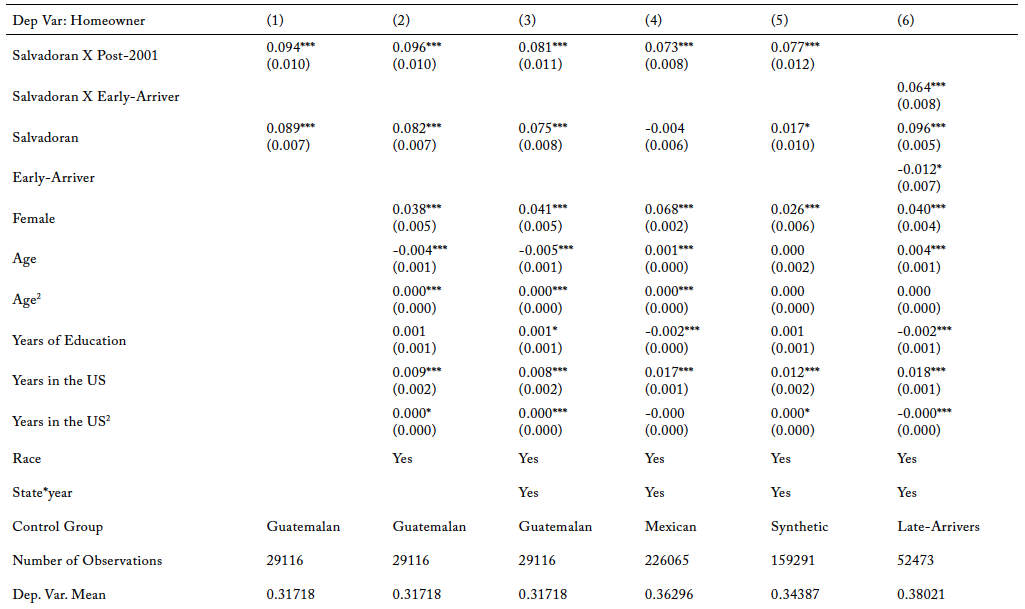
Note: This table reports OLS estimation results from the regressions described in equation (2) in the text. The dependent variable is homeownership. Columns 1–3 use a sample of Salvadoran and Guatemalan migrants. Column (4) uses a sample of Salvadoran and Mexican migrants, while column (5) uses a sample of migrants from El Salvador and a set of Latin American countries, as described in the text. Column (6) estimates equation (3) in the text on a sample of Guatemalan and Salvadoran migrants, but includes migrants who arrived after 2001, as described in the text. Significance levels are: *10%, **5%, ***1%. Source: American Community Survey.
Table A.6. Effect of TPS on Driving to Work
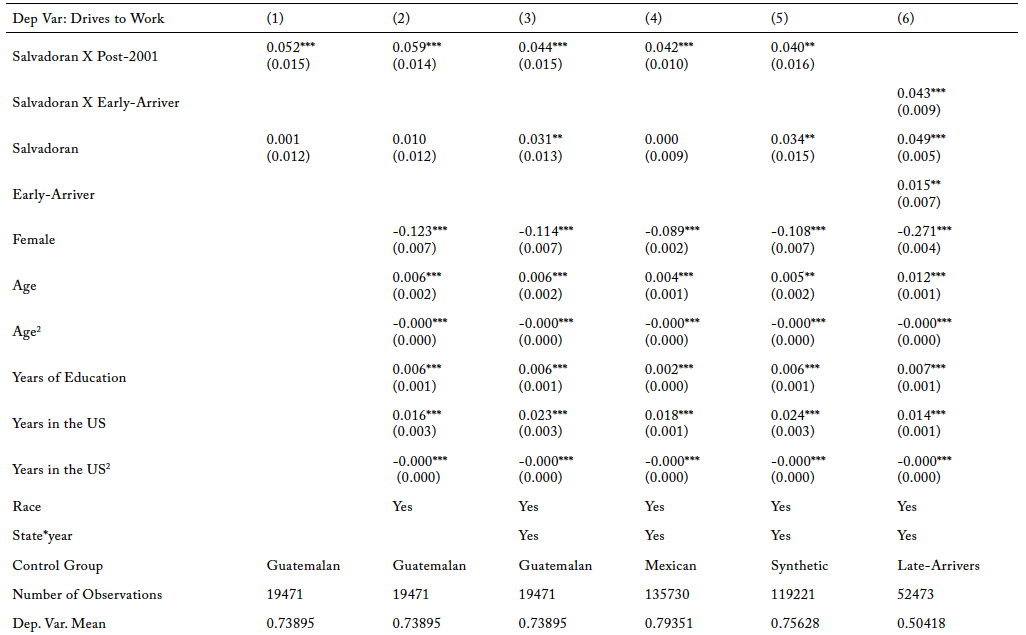
Note: This table reports OLS estimation results from the regressions described in equation (2) in the text. The dependent variable is an indicator of whether the respondent drove to work. Columns 1–3 use a sample of Salvadoran and Guatemalan migrants. Column (4) uses a sample of Salvadoran and Mexican migrants, while column (5) uses a sample of migrants from El Salvador and a set of Latin American countries, as described in the text. Column (6) estimates equation (3) in the text on a sample of Guatemalan and Salvadoran migrants, but includes migrants who arrived after 2001, as described in the text. Significance levels are: *10%, **5%, ***1%. Source: American Community Survey.
Table A.7. Effect of TPS on Annual Income from Welfare and Social Assistance
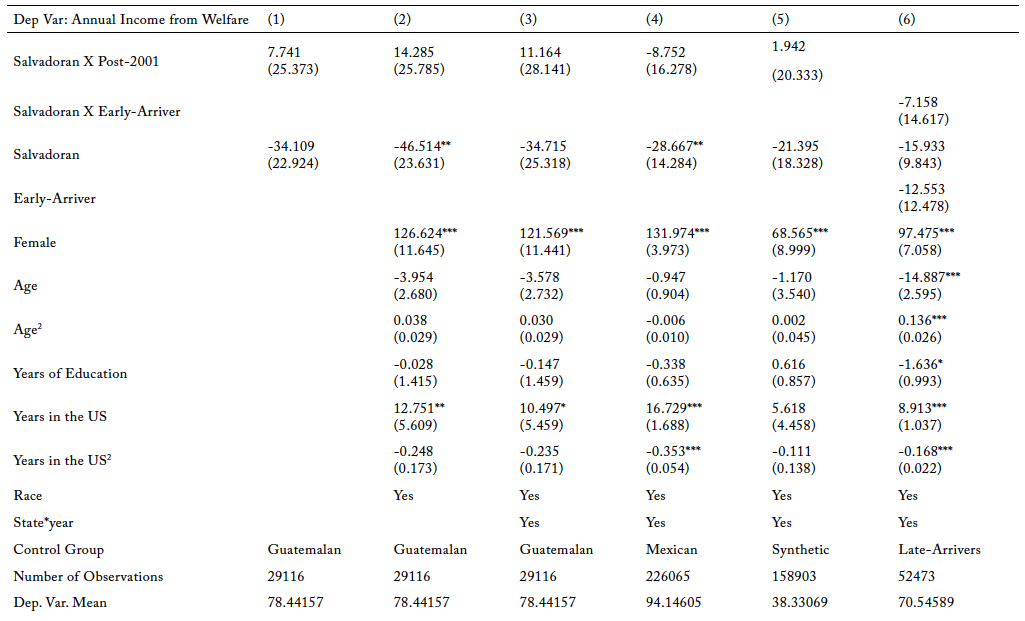
Note: This table reports OLS estimation results from the regressions described in equation (2) in the text. The dependent variable is income received from welfare or public assistance in the past month (2020 dollars). Columns 1–3 use a sample of Salvadoran and Guatemalan migrants. Column (4) uses a sample of Salvadoran and Mexican migrants, while column (5) uses a sample of migrants from El Salvador and a set of Latin American countries, as described in the text. Column (6) estimates equation (3) in the text on a sample of Guatemalan and Salvadoran migrants, but includes migrants who arrived after 2001, as described in the text. Significance levels are: *10%, **5%, ***1%. Source: American Community Survey.
Table A.8. Effect of TPS on Primary Outcomes: States with Similar Distribution of Salvadorans and Guatemalans by County
Note: This table reports OLS estimation results from the regressions described in equation (2) in the text. The sample includes households in 12 states with a dissimilarity index below 0.2, as described in the text. Column (2) controls for race, sex, quadratics of years of education and years in the US, and education category, and column (3) controls for state-by-year fixed-effects, as described in the text. Significance levels are: *10%, **5%, ***1%.
Table A.9. Effect of TPS on Main Outcomes, Weighted for Attrition
Note: This table reports OLS estimation results from the regressions described in equation (2) in the text. Observations are weighted by the inverse survival rate of individuals by sex, age, and education. Column (2) adds controls for race, sex, quadratics of years of education and years in the US, and education category. Column (3) adds controls for state-by-year dummies. Significance levels are: *10%, **5%, ***1%.
Table A.10. Effects on Adult Education, Spanish Language, and Inclusion in Primary Sample
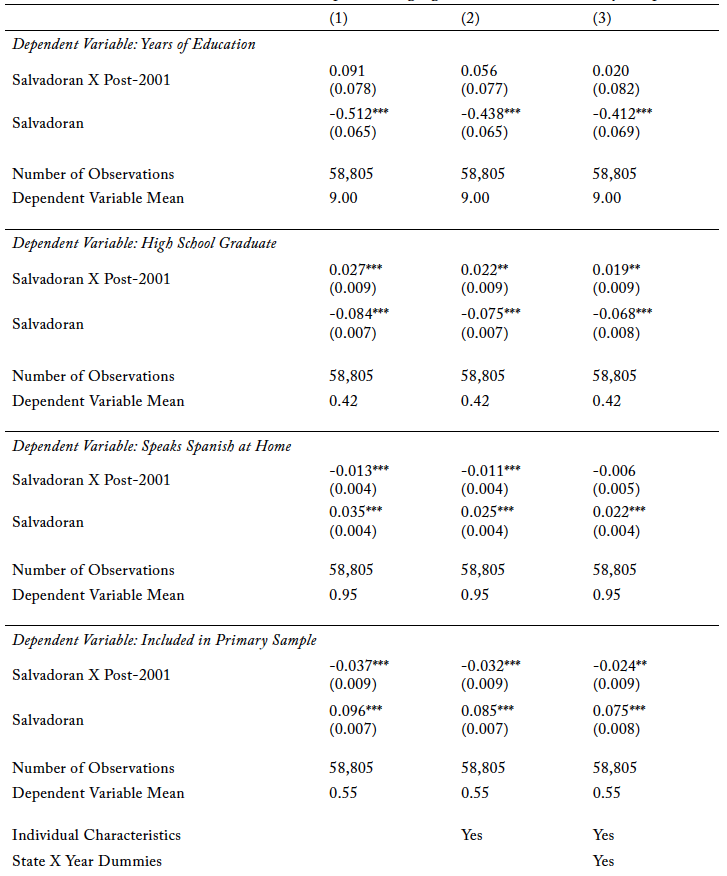
Note: This table reports OLS estimation results from the regressions described in equation (2) in the text. The sample includes households in 12 states with a dissimilarity index below 0.2, as described in the text. Column (2) controls for race, sex, quadratics of years of education and years in the US, and education category, and column (3) controls for state-by-year fixed-effects, as described in the text. Significance levels are: *10%, **5%, ***1%.
Table A.11. Effect of TPS on Children’s Education
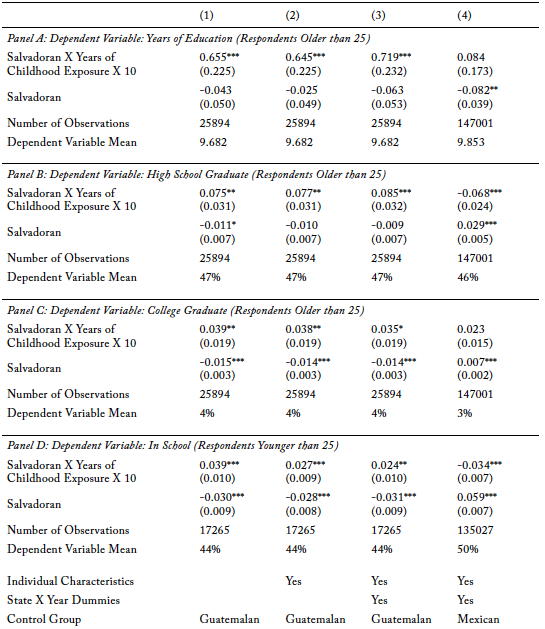
Note: This table reports OLS estimation results from equation (5) in the text. Column (1) includes dummy variables for number of years exposed to TPS. Column (2) adds controls for race, sex, quadratics of years of education and years in the US, and education category, as described in the text. Columns 3 and 4 add state-by-year fixed-effects. Columns 1–3 include Salvadoran and Guatemalan respondents, while column (4) includes Salvadoran and Mexican respondents, as described in the text. Significance levels are: *10%, **5%, ***1%.
Table A.12. Previous Work on Legalization Policies and Labor Market Outcomes
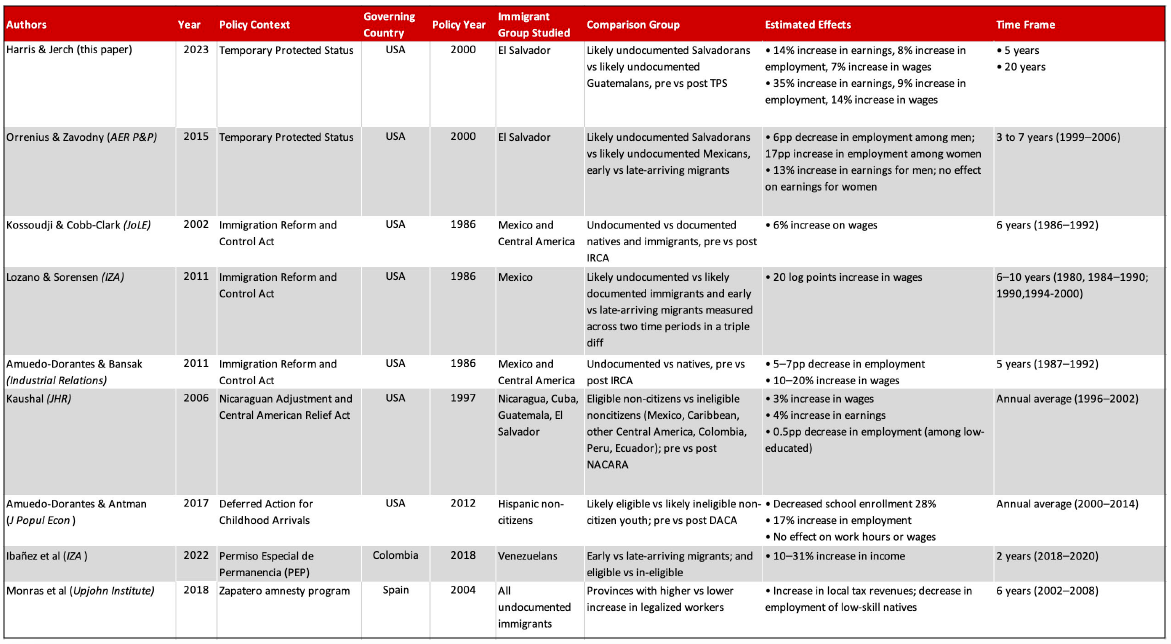
Figure A.1. Spatial Distribution of Salvadoran-born Residents Relative to Guatemalan-born Residents as of 2000
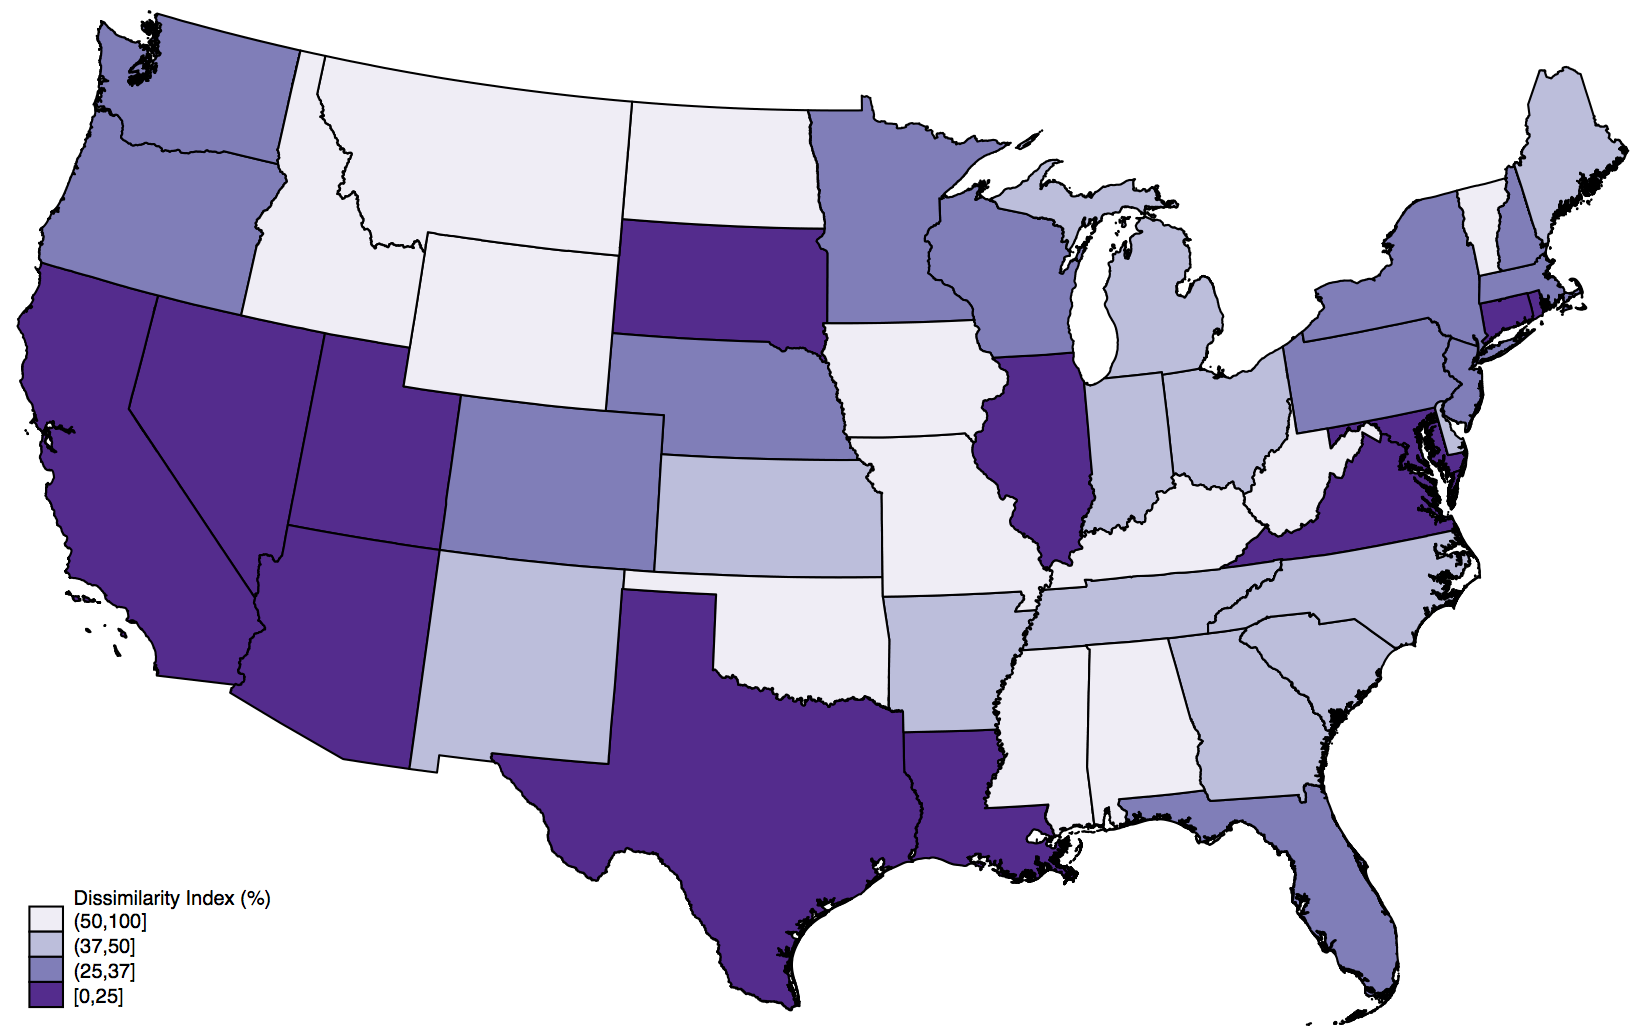
Note: Map shows the dissimilarity index, or the level of segregation, of Salvadoran-born relative to Guatemalan-born residents by state as of 2000. Each color category represents a quantile. The dissimilarity index varies between 0 and 100 and measures the percentage of Salvadoran-born that would have to move across counties within a state to be distributed the same way as Guatemalan-born in that state. An index of 0 indicates total integration. An index of 100 indicates total segregation. We calculate the dissimilarity index for each state s as follows:  where i indexes counties, S is the Salvadoran-born population and G is the Guatemalan-born population. Data sourced from NHGIS.
Figure A.2. Synthetic Control Weights for Comparison Countries
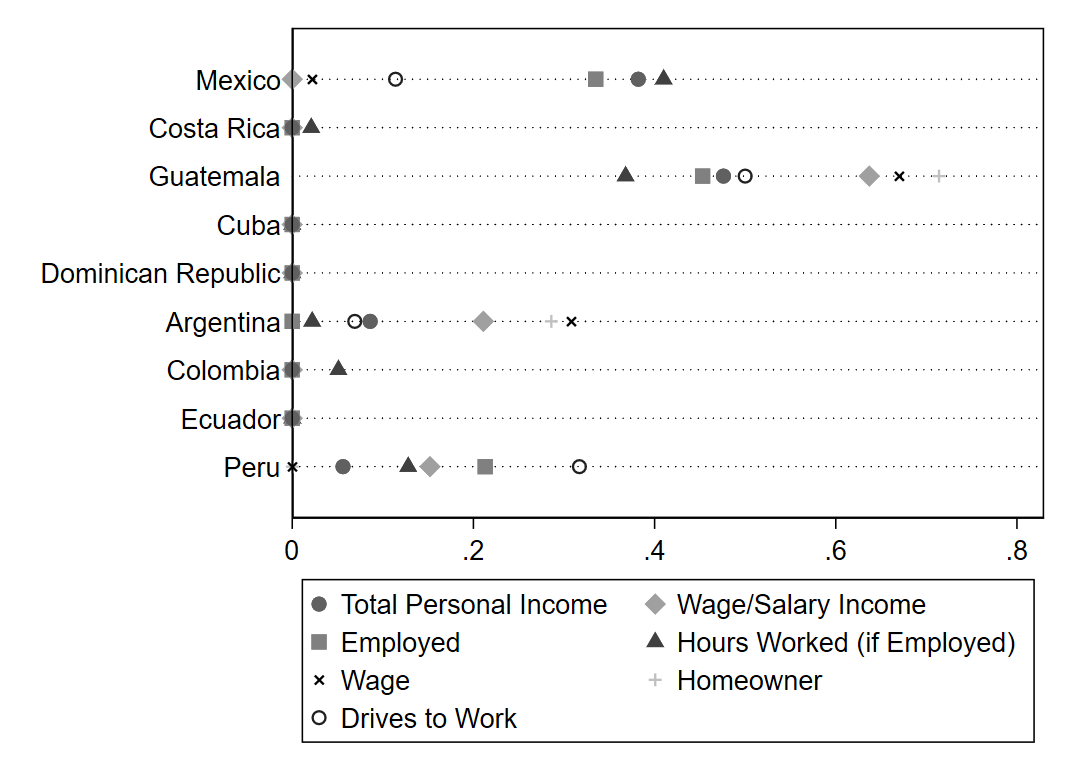
Note: This figure shows the synthetic control weights calculated for each comparison country for each primary outcome variable. As described in the text, the regression weight on each individual unit is given by  .
.
Appendix Figure A.3. Heterogeneity of Results by Gender
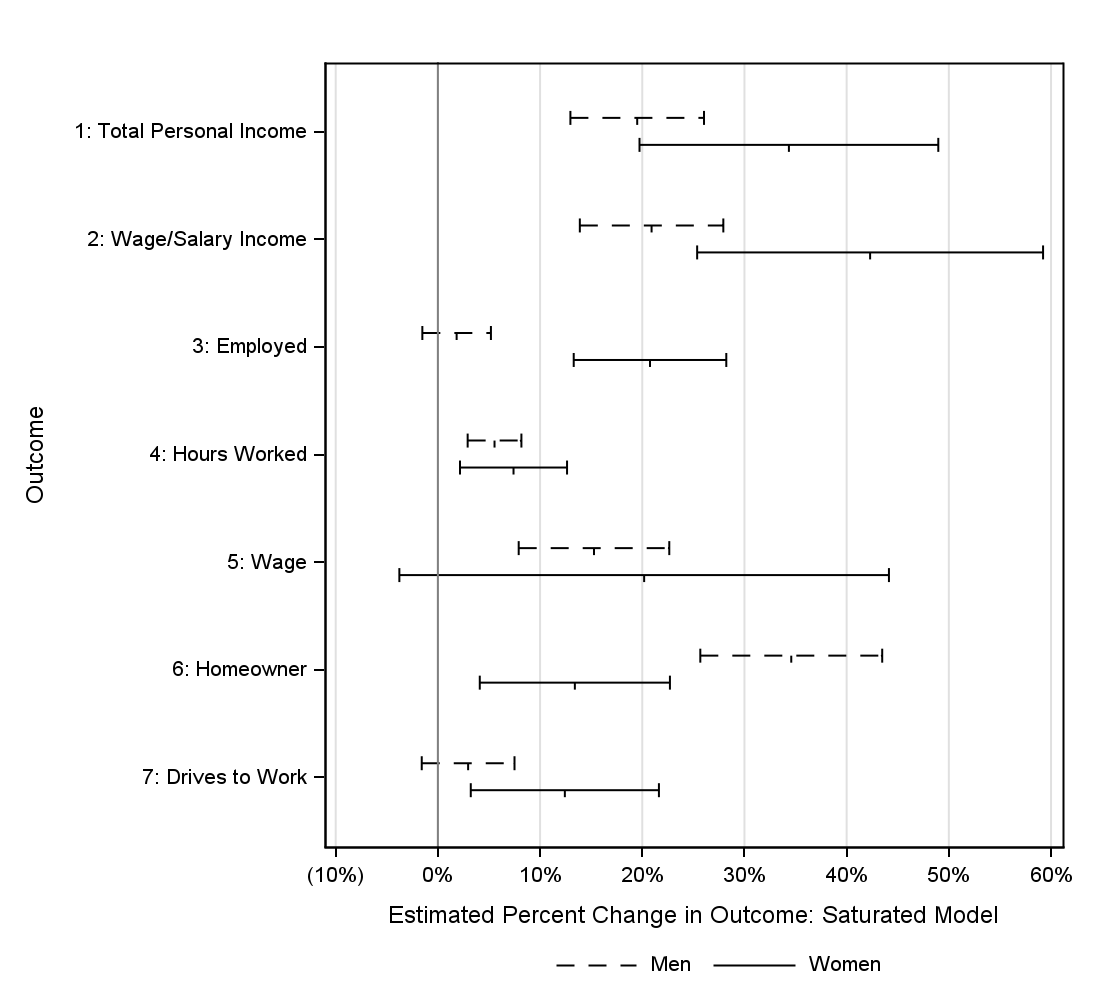
Notes: This figure plots difference-in-differences estimates and 95% confidence intervals from equa-tion (2) in the text as a percentage of control-group mean outcomes. The dashed lines show estimat-ed effect sizes for men, while the solid lines show estimated effect sizes for women.
References
Abadie, Alberto, Diamond, Alexis, & Hainmueller, Jens (2010). Synthetic Control Methods for Comparative Case Studies: Estimating the Effect of California’s Tobacco Control Program. Journal of the American Statistical Association, 105:490, 493–505, https://doi.org/10.1198/jasa.2009.ap08746.
Abadie, Alberto, Athey, Susan, Imbens, Guido, & Wooldridge, Jeffrey (2020). Sampling-Based versus Design-Based Uncertainty in Regression Analysis. Econometrica, 88: 265–296. https://doi.org/10.3982/ECTA12675.
Abel, G. J., Brottrager, M., Cuaresma, J. C., & Muttarak, R. (2019). Climate, conflict and forced migration. Global Environmental Change, 54, 239–249.
Albright, Alex, et al. (2021). After he Burning: The Economic Effects of the 1921 Tulsa Race Massacre. No. 28985. National Bureau of Economic Research. https://doi.org/10.3386/w28985.
Amuedo-Dorantes, C., & Antman, F. (2017). Schooling and labor market effects of temporary
authorization: Evidence from DACA. Journal of Population Economics, 30:339–373.
Amuedo‐Dorantes, C., & Bansak, C. (2011). The impact of amnesty on labor market outcomes: A panel study using the legalized population survey. Industrial Relations: A Journal of Economy and Society, 50(3), 443–471.
Amuedo-Dorantes, C., & Bansak, C. (2014). Employment Verification Mandates and the Labor Market Outcomes of Likely Unauthorized and Native Workers. Contemporary Economic Policy, 32(3), 671–680. https://doi.org/10.1111/coep.12043.
Amuedo-Dorantes, C., Lofstrom, M., & Wang, C. (2021). Immigration Policy and the Rise of Self-Employment among Mexican Immigrants. ILR Review. https://doi.org/10.1177/00197939211057765.
Amuedo-Dorantes, C, & Pozo, S. (2019). The Aftermath of Tougher Immigration Enforcement: E-Verify and Perceptions of Discrimination among Hispanic Citizens. American Behavioral Scientist 63(9), 1299–1330. https://doi.org/10.1177/0002764219835270.
Benetton, Matteo, Kudlyak, Marianna, & Mondragon, John (2022). Dynastic Home Equity. Federal Reserve Bank of San Francisco Working Paper 2022–13. https://doi.org/10.24148/wp2022-13.
Borjas, G. J. (1989). Economic Theory and International Migration. International Migration Review, 23(3), 457–485. https://doi.org/10.1177/019791838902300304.
Borjas G. J. (2017). The Labor Supply of Undocumented Immigrants. Labour Economics, 46, 1–13. https://doi.org/10.1016/j.labeco.2017.02.004.
Borjas and Cassidy (2019). The Wage Penalty to Undocumented Immigration. Labour Economics, 61. https://doi.org/10.1016/j.labeco.2019.101757.
Boustan, L. P., Kahn, M. E., Rhode, P. W., & Yanguas, M. L. (2020). The effect of natural disasters on economic activity in US counties: A century of data. Journal of Urban Economics, 118, 103257.
Cohn, D’Vera, Passel, Jeffrey, & Gonzalez-Barerra, Ana (2017). Rise in U.S. Immigrants From El Salvador, Guatemala and Honduras Outpaces Growth from Elsewhere. Pew Research Center. https://www.pewresearch.org/hispanic/wp-content/uploads/sites/5/2017/12/Pew-Research-Center_Central_American-migration-to-U.S._12.7.17.pdf.
Congressional Research Service (2021). Temporary Protected Status and Deferred Enforced Departure. Report RS20844. https://sgp.fas.org/crs/homesec/RS20844.pdf.
Donato, Katharine M., Massey, Douglas S. (1993). Effect of the Immigration Reform and Control Act on the Wages of Mexican Migrants. Social Science Quarterly, 74:523–541.
Department of Health and Human Services (2012). Overview of Immigrants’ Eligibility for SNAP, TANF, Medicaid, and CHIP. Office of the Assistant Secretary for Planning and Evaluation (ASPE). https://aspe.hhs.gov/reports/overview-immigrants-eligibility-snap-tanf-medicaid-chip-0.
Department of the Treasury Office of Economic Policy, Council of Economic Advisers, and the Department of Labor (2015). Occupational Licensing: A Framework for Policymakers. https://obamawhitehouse.archives.gov/sites/default/files/docs/licensing_report_final_nonembargo.pdf.
Farooq, Ammar, & Kugler, Adriana (2022). Impacts of Public Health Insurance on Occupational Upgrading. ILR Review 75.1: 225–250.
Gibson, C., & Jung, K. (2006). The Foreign-Born Population of the United States: 1850 to 2000. Washington, DC : Population Division, U.S. Census Bureau.
Gröger, A., & Zylberberg, Y. (2016). Internal labor migration as a shock coping strategy: Evidence from a typhoon. American Economic Journal: Applied Economics, 8(2), 123–53.
Hall, Matthew; Greenman, Emily; Farkas, George. (2010). Legal Status and Wage Disparities for Mexican Immigrants. Social Forces. 89:491–514.
Healthcare.gov (n.d.). Immigration Status and the Marketplace. https://www.healthcare.gov/immigrants/immigration-status/.
Hernandez, Ester E. (2006) Relief Dollars: U.S. Policies toward Central Americans, 1980s to Present. Journal of American Ethnic History, 25, no. 2/3: 225–42. http://www.jstor.org/stable/27501697.
Hersch, Joni, and W. Kip Viscusi. (2010). Immigrant status and the value of statistical life. Journal of Human Resources, 45.3: 749–771.
Ibañez, A. M., Moya, A., Ortega, M.A., Rozo, S., and Maria José Urbina. (2022). Life Out of the Shadows: Impacts of Amnesties in the Lives of Migrants. IZA Discussion Paper No. 15049.
Kaushal, N. (2006). Amnesty programs and the labor market outcomes of undocumented workers. Journal of Human Resources, 41(3), 631–647.
Kossoudji, S. A., & Cobb-Clark, D. A. (2002). Coming out of the shadows: Learning about legal status and wages from the legalized population. Journal of Labor Economics, 20(3), 598–628.
Kuhmerker, Kathryn (2003). Temporary Protected Status (TPS). New York State Department of Health, letter dated 4/10/2003 from the Office of Medicaid Management to Medicaid Directors https://www.health.ny.gov/health_care/medicaid/publications/docs/gis/03ma011.pdf.
Logan, Trevon D., and John M. Parman. (2017). Segregation and homeownership in the early twentieth century. American Economic Review, 107.5: 410–14.
Lomnitz, C., & Elizarrarás, S. R. (2001). El Salvador 2001: Earthquake disaster and disaster preparedness in a tropical volcanic environment. Seismological Research Letters, 72(3), 346–351.
Lozano, Fernando A. and Sorensen, Todd. (2011). The Labor Market Value to Legal Status. IZA Discussion Paper No. 5492. https://ssrn.com/abstract=1765657 or http://dx.doi.org/10.2139/ssrn.1765657.
MassLegalHelp (2010). TPS and Social Security Number. https://www.masslegalhelp.org/immigration/haiti/tps-and-social-security-number.
Menjívar, Cecilia (2017). Temporary Protected Status in the United States: The Experiences of Honduran and Salvadoran Immigrants. Center for Migration Research, University of Kansas.
Menjívar, Cecilia. (2006). Liminal legality: Salvadoran and Guatemalan immigrants’ lives in the United States. American Journal of Sociology 111.4 999–1037.
Meyer, Peter (2022). Central American Migration: Root Causes and U.S. Policy. Congressional Research Service IF11151. https://sgp.fas.org/crs/row/IF11151.pdf.
Migration Policy Institute (2013). Major US Immigration Laws, 1790–Present. https://www.migrationpolicy.org/sites/default/files/publications/CIR-1790Timeline.pdf.
Migration Policy Institute (2019). Unauthorized Immigrant Population. https://www.migrationpolicy.org/data/unauthorized-immigrant-population/state/US.
Miyares, I. M., Wright, R., Mountz, A., Bailey, A. J., & Jonak, J. (2003). The Interrupted Circle: Truncated Transnationalism and the Salvadoran Experience. Journal of Latin American Geography, 2(1), 74–86. http://www.jstor.org/stable/25765047.
Monràs, J., and Javier Vázquez-Grenno (2018). Understanding the Effects of Legalizing Undocumented immigrants. Upjohn Institute Working paper, 18–283.
Oliver, Melvin L., and Thomas M. Shapiro (1995). “A sociology of wealth and racial inequality” in Redress for Historical Injustices in the United States: On Reparations for Slavery, Jim Crow, and Their Legacies. Durham N.C.: Duke University Press, 2007.
Orrenius, Pia M., and Madeline Zavodny. (2015). The Impact of Temporary Protected Status on Immigrants’ Labor Market Outcomes. American Economic Review, 105(5): 576–80.
PennDOT 2022. “Real ID Info: Non-US Citizens. https://www.dmv.pa.gov/REALID/Pages/REAL-ID-Non-U.S.Citizens.aspx.
Pew Research Center. (2022). Key facts about U.S. immigration policies and Biden’s proposed changes. Washington DC. https://www.pewresearch.org/fact-tank/2022/01/11/key-facts-about-u-s-immigration-policies-and-bidens-proposed-changes/.
Rho, D. & Sanders, S. (2021). Immigrant Earnings Assimilation in the United States: A Panel Analysis. Journal of Labor Economics, 39(1): 37-78. DOI: 10.1086/708615.
Rosenblum, Marc D. (2011). US Immigration Policy Since 9/11: Understanding the Stalemate over Comprehensive Immigration Reform. Washington DC: Migration Policy Institute. https://www.migrationpolicy.org/sites/default/files/publications/RMSG-post-9-11policy.pdf.
Ruggles, Steven, Flood, Sarah, Foster, Sophia, Goeken, Ronald, Pacas, José, Schouweiler, Megan, and Sobek, Matthew (2001). IPUMS USA: Version 11.0 [dataset]. Minneapolis, MN: IPUMS. https://doi.org/10.18128/D010.V11.0.
US Department of Justice. (2018). Workers with Temporary Protected Status Protect Your Right to Work. October Issue. https://www.justice.gov/crt/page/file/1106681/download.
Van Hook, J., Bean, F. D., Bachmeier, J. D., & Tucker, C. (2014). Recent trends in coverage of the Mexican-born population of the United States: Results from applying multiple methods across time. Demography, 51, 699–726.
Vigdor, J. (2008). The economic aftermath of Hurricane Katrina. Journal of Economic Perspectives, 22(4), 135–54.