


 USA Today
 The Business Journal
 Washington Examiner
 Econlib
Introduction
Studies have long maintained that a large regulatory burden can restrict business growth, though the total number of regulations for a value chain have largely been understudied (Dawson & Seater, 2013; Coffey, McLaughlin, & Peretto, 2016; Coffey, McLaughlin, & Peretto, forthcoming). This is especially the case for food and beverage products; regulations are often put in place to protect the consumer but have the potential to increase prices along the supply chain, leading to regressive outcomes (Chambers, Collins, & Krause, 2019). These regulations are particularly onerous when they are not clearly defined and vary considerably in enforcement (Vogel, 1998).
The influence of regulations on economic outcomes has been studied since at least Stigler (1971), though fewer studies have focused on the economic geography of regulatory burdens in supply chains.1While some indices and rankings seek to measure economic freedom (Stansel & McMahon, 2018), occupational licensing (Summers, 2007), and entrepreneurial constraints (Teague, 2016), to the best of our knowledge, none have focused explicitly on tracking regulatory burdens within a specific supply chain. The regulations confronting any supply chain vary dramatically across legislative jurisdictions, as U.S. policy is enforced by overlapping federal, state, and local governments (Tarko & Farrant, 2019). This jurisdictional overlap is especially important in nascent industries and in small businesses where entrepreneurs must spend significant cognitive capacity on understanding how regulations influence their ability to grow their firms (Teague, 2016). Indeed, places with similar geographic characteristics can have significantly different entrepreneurial outcomes due to geographic variation in regulatory constraints (Crum & Gohmann, 2016; Malone, Koumpias, & Bylund, 2019).
This article uses RegData, a unique database to explore state-by-state regulatory variation in U.S. supply and value chains. We focus on the U.S. beer industry as an example of this variation as the institutions governing the U.S. beer value chain were generally left to state and local policymakers following the 1933 repeal of the 18th Amendment and the end of prohibition. Prior research suggests certain specific brewing regulations restrict economic activity within the sector (Burgdorf, 2019; Gohmann, 2016; Malone & Lusk, 2016; Malone & Hall, 2017), though no prior work has attempted to quantify the total number of state and federal restrictions on the beer supply and value chains.
Throughout most of the 20th century, industry concentration led to fewer and fewer breweries producing more and more beer. This trend reversed in the early 1980s, with entrepreneurs opening thousands of breweries between 1985 and 2020. In fact, though there were fewer than 100 breweries in the United States in the 1980s, over 8,300 breweries operated across the country in 2019 (Brewers Association, 2020). This growth in entrepreneurial activity has provided a significant boost to their local economies through increases in factors like agricultural production and employment (Dobis et al., 2019; Malone & Stack, 2017; Miller et al., 2019).2 According to the U.S. Bureau of Labor Statistics, employment in breweries was stagnant at 25,000 employees from 2001 to 2010. From 2011 to 2016, employment in breweries more than doubled, with 58,580 employees working in breweries in 2016 (Delaney & Haines, 2017), corresponding to the influx of craft brewery openings. Also, the hop industry in the United States has flourished since the arrival of thousands of craft beer brewers. In 2019, the Pacific Northwest harvested a record 56,544 acres, up from 31,289 in 2010 (Hop Growers of America, 2011, 2020). Additionally, hopyards have now emerged in 29 states throughout the country, and cultivation outside of the Pacific Northwest is directly tied to craft beer presence (Dobis et al., 2019). The economic potential of this nascent industry has become so enticing that state and federal governments have increasingly passed legislation in an effort to promote growth of the burgeoning craft beer sector (Malone & Hall, 2017; Malone & Lusk, 2016). Despite its potential to promote economic growth, the U.S. beer sector is often considered one of the most heavily regulated industries (Madsen, Gammelgaard, & Hobdari, 2020), though few studies have evaluated precisely how regulated the U.S. beer industry has become.3The only exception to this gap is Malone and Chambers (2017), which match 1997–2012 data from the Code of Federal Regulations with two-digit NAICS codes to explore federal regulatory constraints on the beer value chain. The authors find that 94,212 federal constraints directly and indirectly influenced the beer value chain.
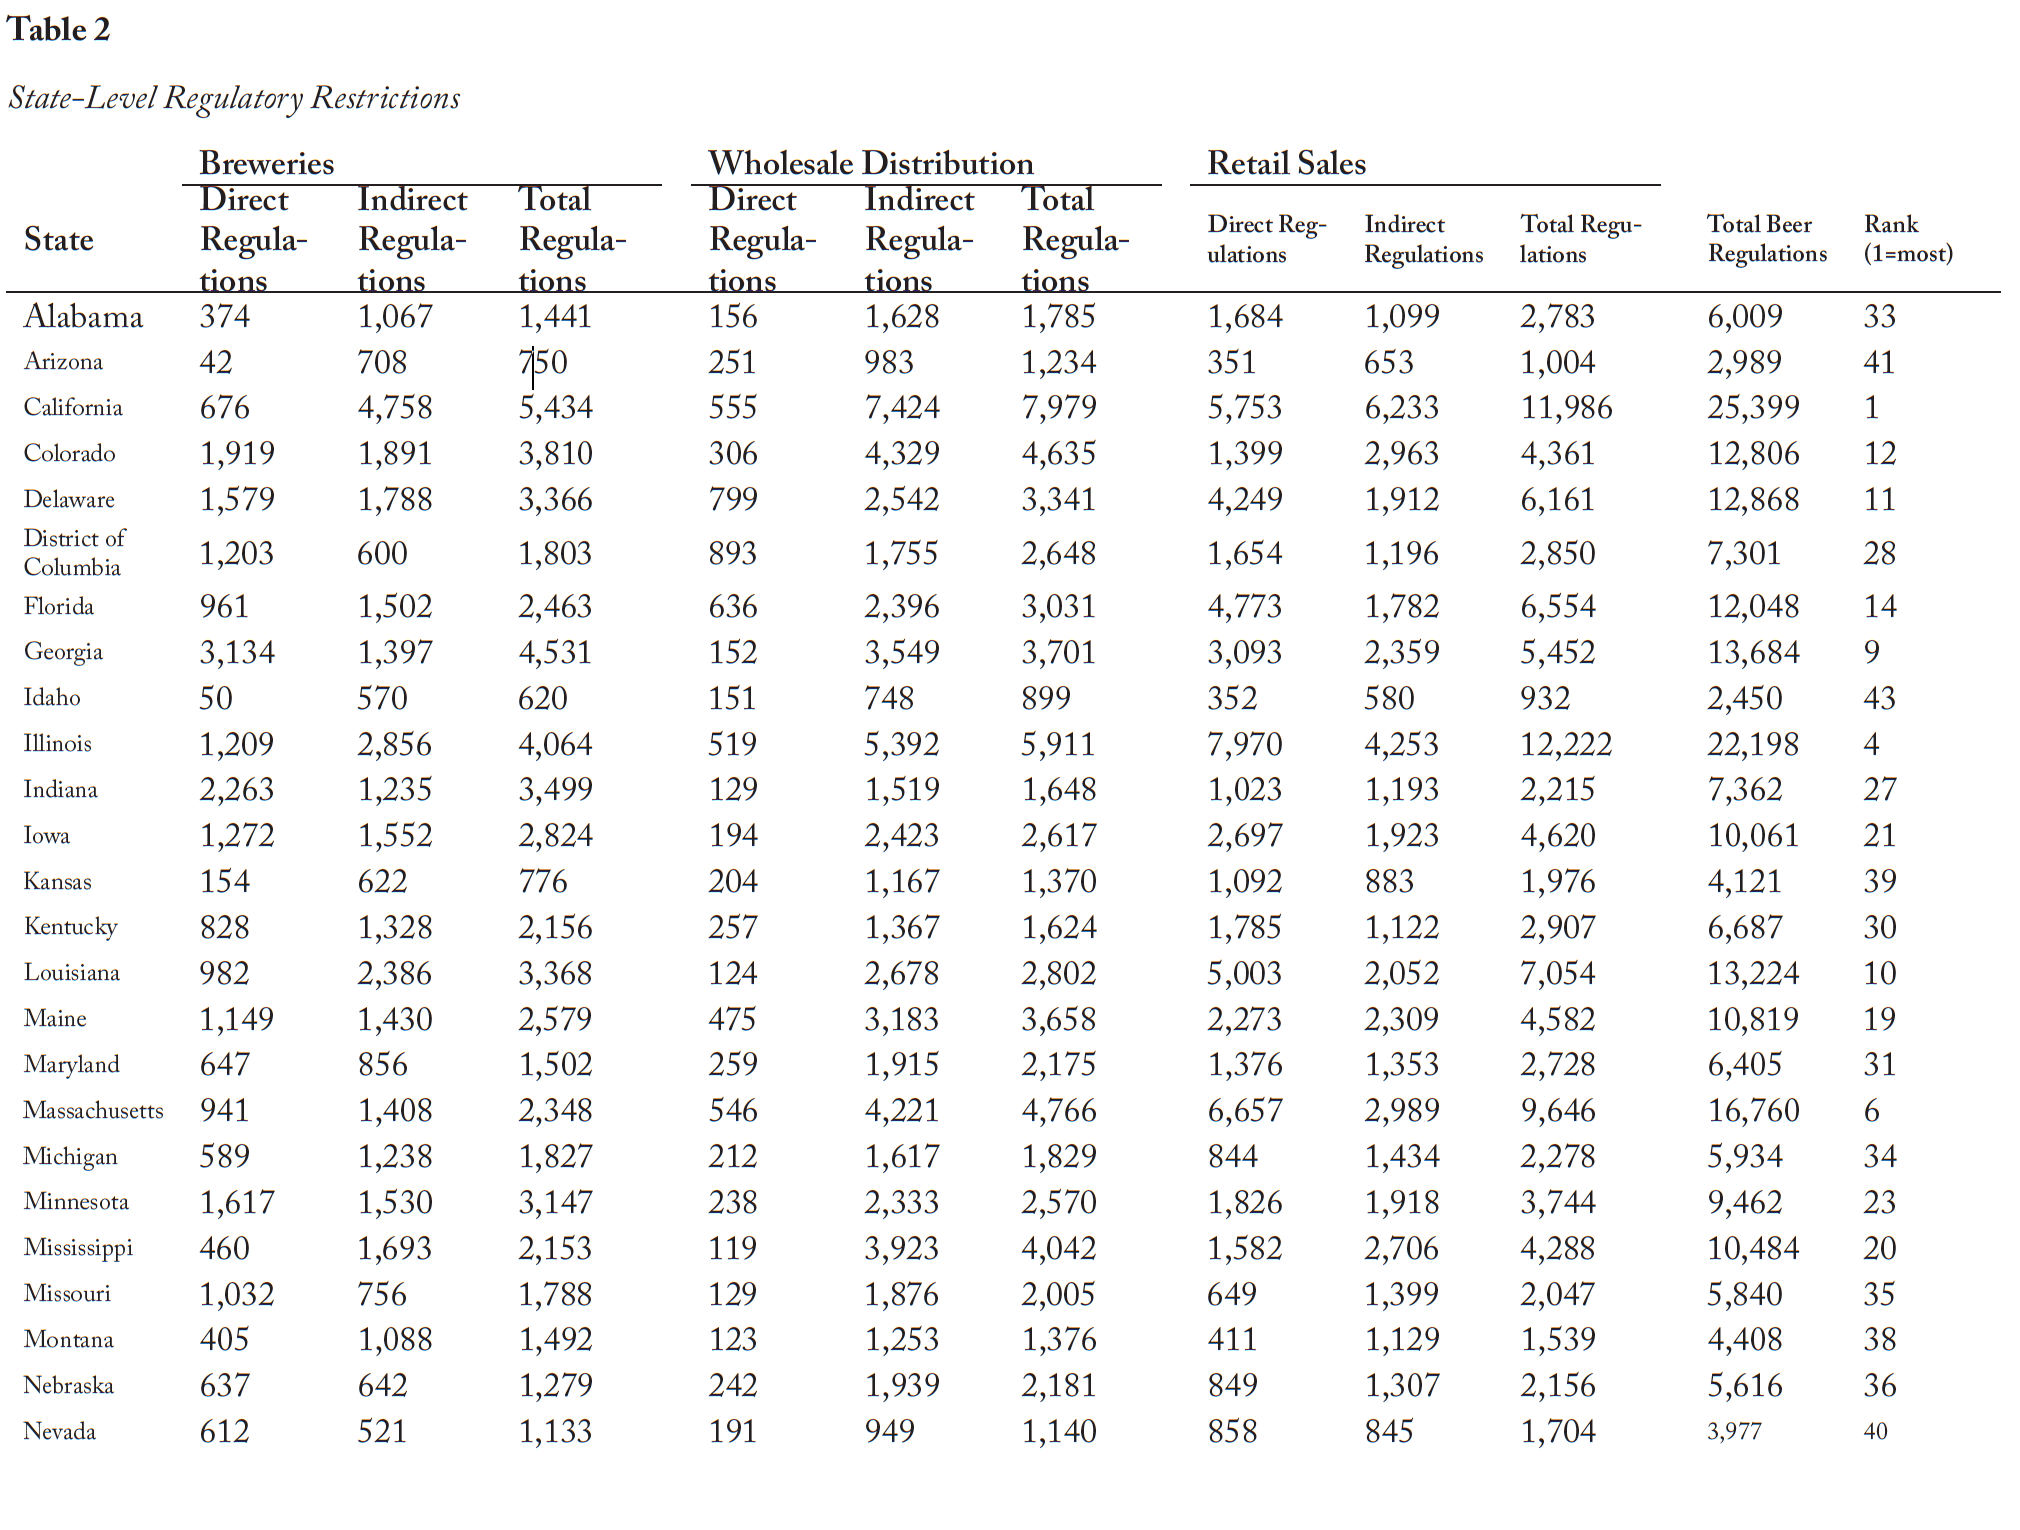
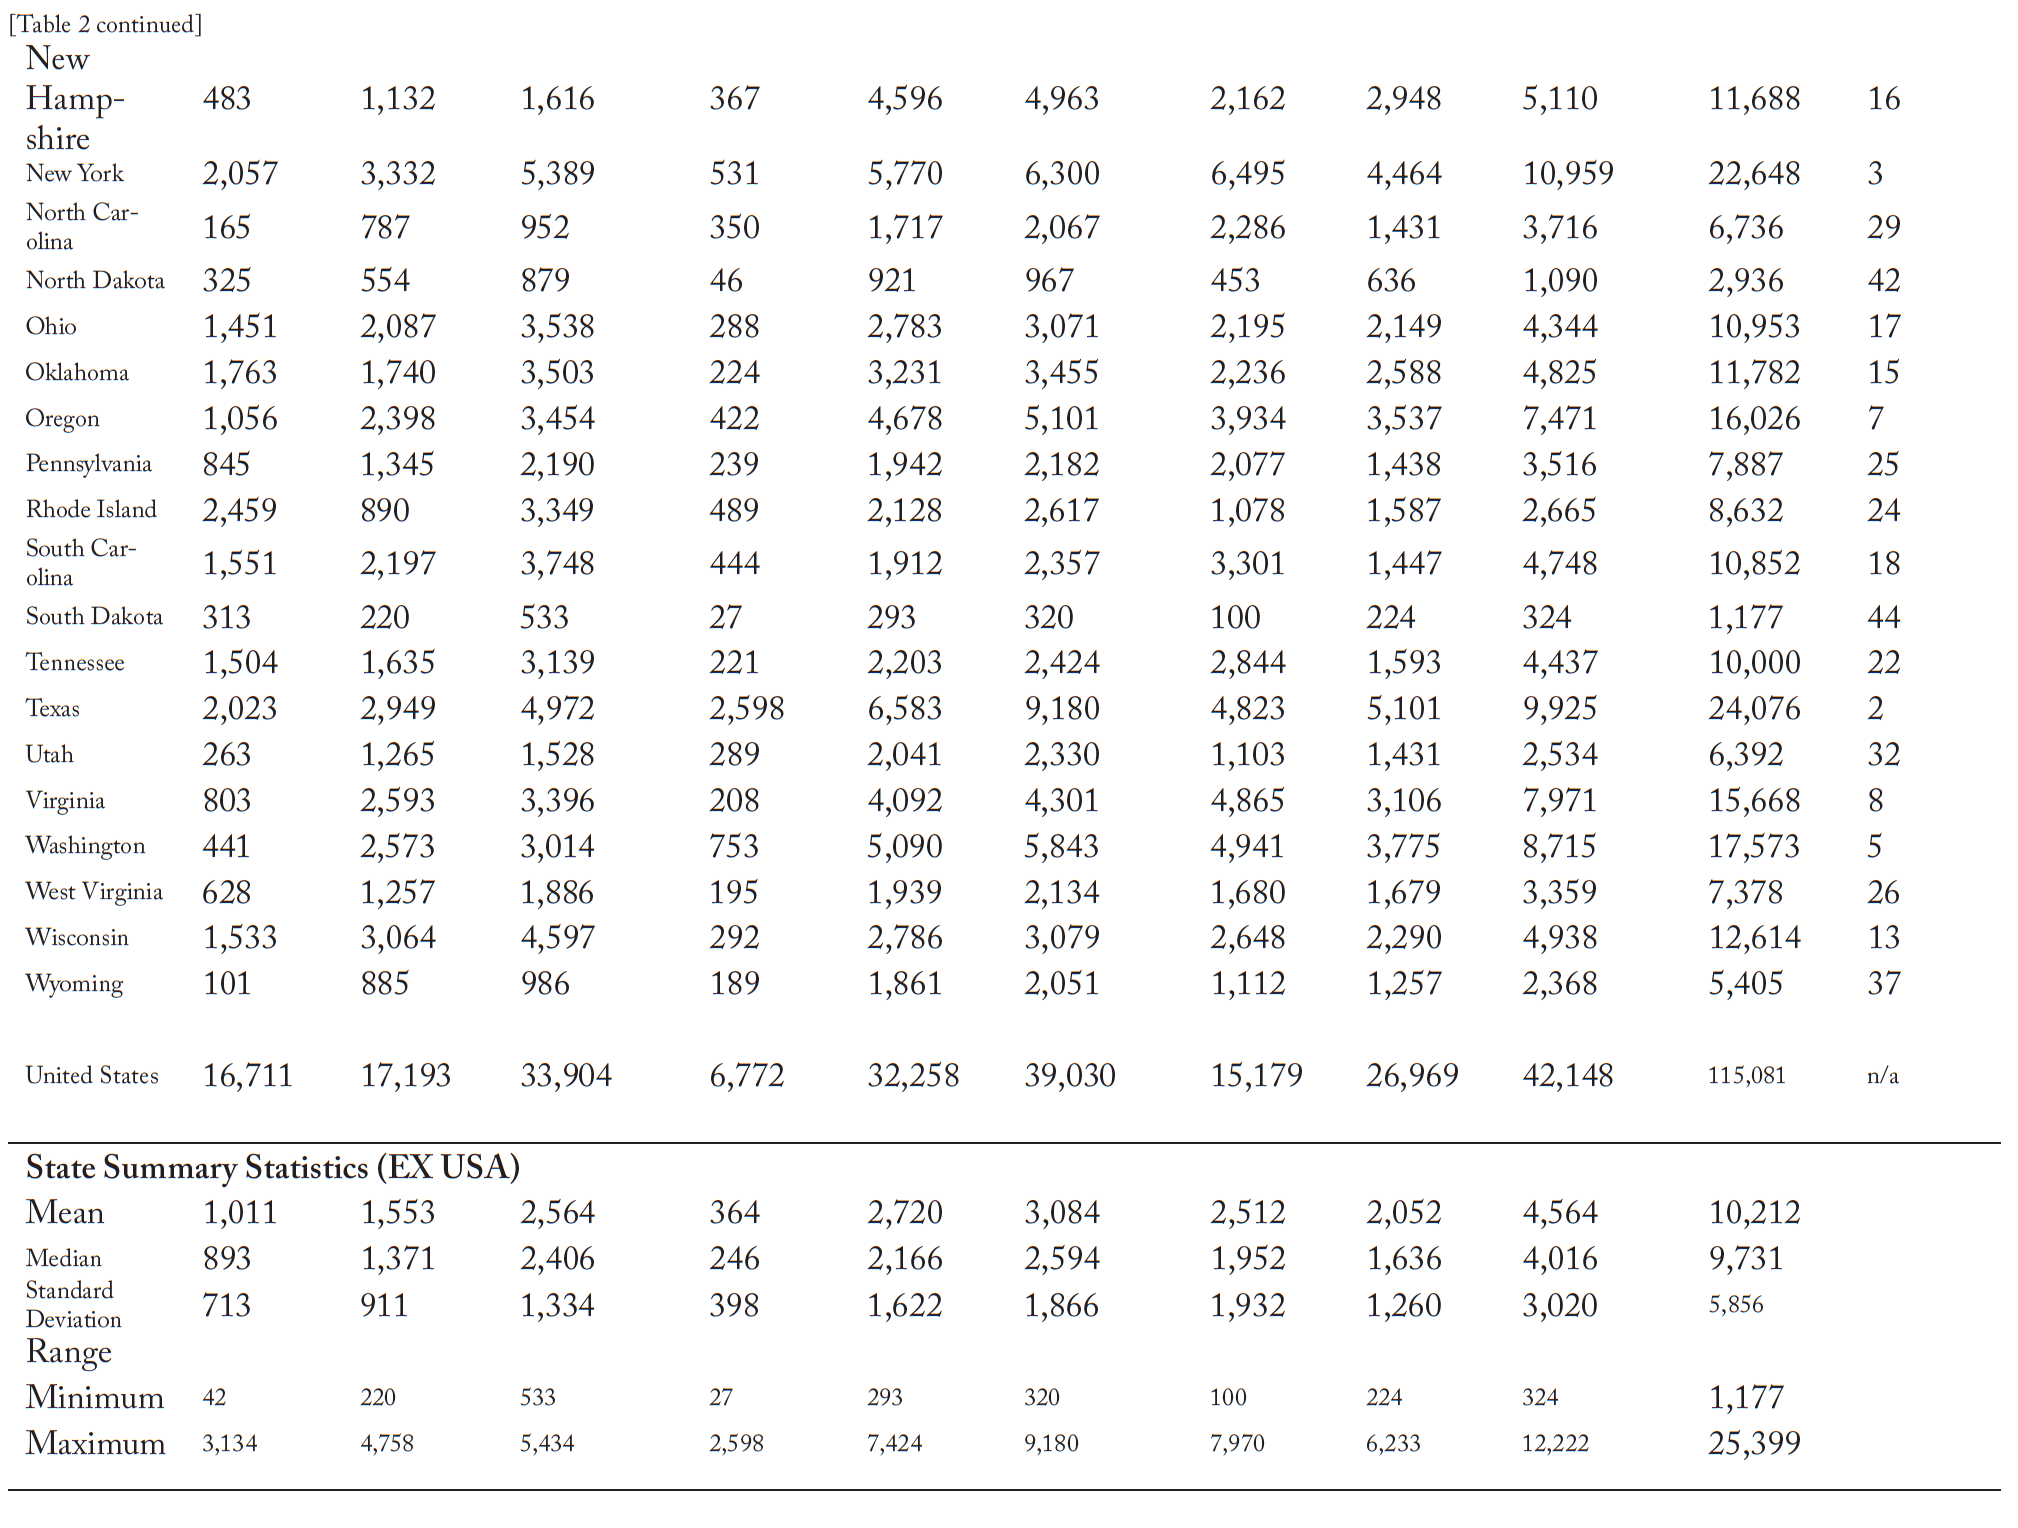
We utilize the Mercatus Center’s State RegData 2.0 database, which counts the number of industry-level regulatory restrictions contained in each state’s body of administrative law, to assess the impact on both the supply chain of industries that produce the inputs needed to produce beer, as well as the downstream value-added industries that distribute beer to the end consumer (which we refer to as the value chain). Our findings suggest that the formal regulatory constraints vary dramatically across states, with South Dakota having the fewest restrictions (1,177) and California having the most (25,399).4State RegData are available via the QuantGov website: https://www.quantgov.org/state-regdata
The remainder of this article is organized as follows. First, we describe the beer supply chain in the United States, paying special attention to the ways that regulations impact decision-making throughout the supply chain. Second, we present our data and methods, which involve data collected via machine learn- ing to quantify differences in the number of regulatory restrictions each state government imposes on the beer supply and value chains within their jurisdiction. We then present our results, which suggest that the state-level regulatory restrictions targeted at the beer supply and value chains vary between 1,177 and 25,399, with the average state implementing 10,212 formal restrictions. We finally conclude with a discussion of our findings about the direct and indirect regulations imposed on supply chains.
U.S. Beer Supply Chain
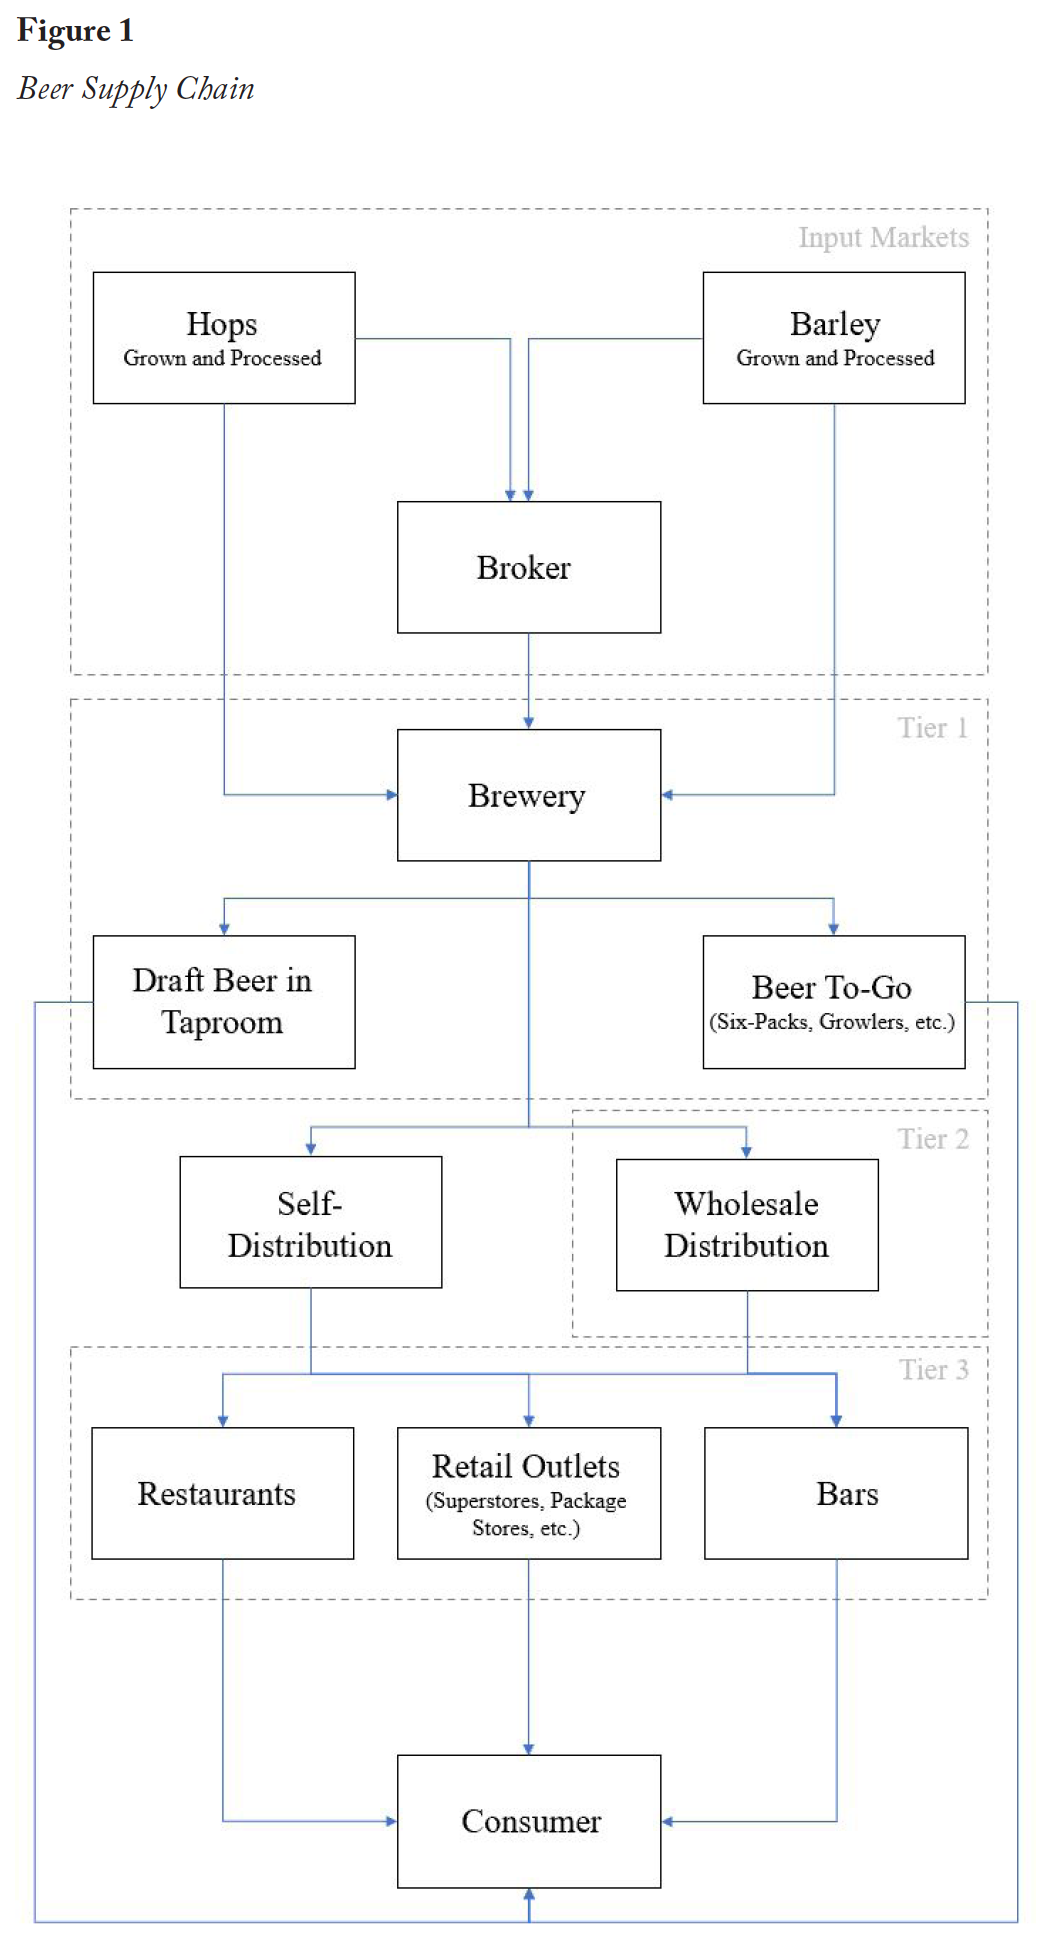
The economic production, transport, and regulatory structure for any six-pack starts at the farm, enters the three-tier distribution system, and inevitably reaches the final consumer through an array of distribution channels (Figure 1).
Hops and barley are the two primary agricultural inputs in beer, but there are many other adjuncts used by brewers, such as rice, corn, wheat, oats, and rye, to achieve a wide array of sensory profiles. These commodities are grown across the country but are predominantly produced in regions that provide ideal growing conditions and benefit from scale economies (e.g., Pacific Northwest for hops; Montana, North Dakota, and Idaho for barley). Once the agricultural commodity is harvested, it is transported to a processor. For hops, the product is sent to a processing facility that converts the hop cones into pellets; for barley, the commodity is transported to a malt house where it is converted into malted barley. The pelletized hops and malted barley are the desired ingredients of the brewer, and the brewer can reach them either directly or through a third-party broker. The direct connection between a brewer and a grower or processor is often limited as agricultural inputs needed for brewing may not be grown in the brewer’s region. Thus, brewers commonly seek a third-party broker whose role is to bridge the connection from farm to brewhouse. Once the inputs reach the brewery, the products enter the three-tier system that regulates the U.S. alcohol industry’s distribution.
The first tier of the three-tier system starts with the brewery, where—depending on their business model—the company brews the beer, packages the product in various forms (e.g., six-packs, kegs, etc.), and sells their beer through multiple distribution channels. Figure 1 presents four potential distribution avenues: (i) draft beer sold in the brewery’s taproom; (ii) beer-to-go orders; (iii) self-distribution; and (iv) distribution through a wholesaler. Smaller and medium-size craft breweries rely predominantly on taproom sales, while regional (craft) breweries and macro brewers have more diverse revenue streams. In fact, it is not uncommon for 80% or more of a craft brewery’s revenue to come from taproom sales (Staples, Malone, & Sirrine, 2020). Taproom sales include draft beer in the taproom that is sold for on-premise consumption (e.g., pints) and beer for off-premise consumption (e.g., to-go orders such as six-packs). The remaining distribution outlets involve moving the product from the brewery to retail outlets. However, there is not necessarily a direct link between the brewery and the retailer.
The second tier of the beer distribution is the wholesaler, or the distributor, who serves as a middleman between the brewery and retailer. Their role is to handle sales and marketing for the beer producer, finding various outlets for the product, which include bars, restaurants, superstores, and local liquor stores. The role of the distributor has been called into question recently, as it can impose high costs on smaller breweries and ultimately limit entry into the market (Malone & Lusk, 2016). Consequently, states have pursued self-distribution legislation allowing breweries to transport their beer directly to retail outlets, bypassing the second tier of the distribution system altogether. As of 2017, 35 states allowed some form of self-distribution (Shumway, 2017), but this regulatory privilege is often capped at a given production threshold, measured in barrels (bbls) per year. For example, Michigan allows breweries who produce fewer than 2,000 bbls of beer per year to self-distribute; prior to July 1, 2020, self-distribution was limited to breweries producing under 1,000 bbls per year (Michigan House Bill 5343).
Whether distributed through a wholesaler or by the brewery themselves, the product reaches the final tier of the beer distribution system: the retailer. Different regulatory structures surround each retail outlet depending on whether the alcohol is purchased for on-premise or off-premise consumption. At the most extreme, some states only allow government stores to make certain alcohol sales. In addition, on-premise retailers like restaurants and bars are subject to restrictions on serving times. Similarly, retailers who sell for off-premise consumption have regulatory restrictions on purchasing hours; many states limit or even ban alcohol sales on Sundays.
While each state government is unique in the way it regulates its alcohol supply chain, some semblance of the three-tier distribution system has been in place for most jurisdictions since the passing of the 21st Amendment. In summary, though the general structure of the beer supply chain is similar across the country (Figure 1), it is a complex system riddled with regulatory restrictions that vary from state to state.
Data and Methods
Because the meaning of the term “regulation” can be rather ambiguous, it is important that we define the term precisely. Within the scope of our empirical analysis, “regulation” measures come from State RegData 2.0, the Mercatus Center’s unique database of industry-specific state regulatory restrictions. State RegDa- ta analyzes rules and guidelines published in each state’s consolidated body of administrative law, counting each instance of a binding restriction that appears in the regulatory text. Each time a word indicating an obligation (i.e., shall, must, may not, prohibited, or required) is encountered, that word is counted as a regulatory restriction. These restrictions are probability-weighted by their industry relevance (as determined by a machine learning algorithm trained on the lexigraphy of industry-specific texts) and summed by industry.5 For details on the methodology of calculating measures of regulation, see QuantGov (2020). Regulatory index values are reported by industry for each state. All empirical calculations and estimates of “regulations” refer to this regulatory restriction index from State RegData.
Total Regulations Within the Beer Value Chain and Supply Chain
To better quantify the entire impact of federal regulations on the beer industry, Malone and Chambers (2017) measured federal regulatory restrictions that apply to both the three-tier beer distribution system (i.e., brewing, wholesale distribution, and retail distribution) and the inputs needed to produce these goods and services (e.g., hops, grain, energy, labor). Malone and Chambers used the Mercatus Center’s RegData database, which was constructed using methods similar to those used to build State RegData, except that the regulatory text being analyzed by RegData is the U.S. Code of Federal Regulations (CFR). Because we are interested in state regulations and not federal regulations, this paper adopts the methodology of Malone and Chambers, except we use State RegData to measure state regulatory restrictions that apply to both the beer value chain and the inputs needed to produce these goods and services.
The value chain industries are “downstream” in the sense that manufactured beer is an intermediate input that increases in value (as measured by wholesale and retail margins) as it moves through the value chain from the brewer to the consumer. The regulations that apply to these activities are labeled “direct regulations.” By contrast, each of these value chain industries (brewing and wholesale or retail distribution) relies on a complex supply chain of inputs to produce their respective goods and services, with each input industry subject to regulation. These “upstream” supply-chain-related regulations are labeled “indirect regulations.” The sum of the direct and indirect regulations represents the totality of all regulations that impact beer production and distribution.
To estimate the “upstream” regulations that apply to an industry’s supply chain, Malone and Chambers (2017) follow the approach of Chambers, Collins, and Krause (2016, 2019) by using input-output (I-O) commodity weights from the Bureau of Economic Analysis (BEA) to weight the regulatory restrictions that apply to each industry that produces the inputs required by that industry’s supply chain:
(1) 
where  are the total indirect (i.e., supply-chain-related) state regulations that apply to industry
  (i.e., brewing and wholesale or retail distribution) in state
  ;
;  is the index of supply chain industries that supply inputs to industry ;
  are I-O commodity weights from the BEA renormalized to sum to one; and
  are the direct state regulations for industry in state as reported by State RegData.
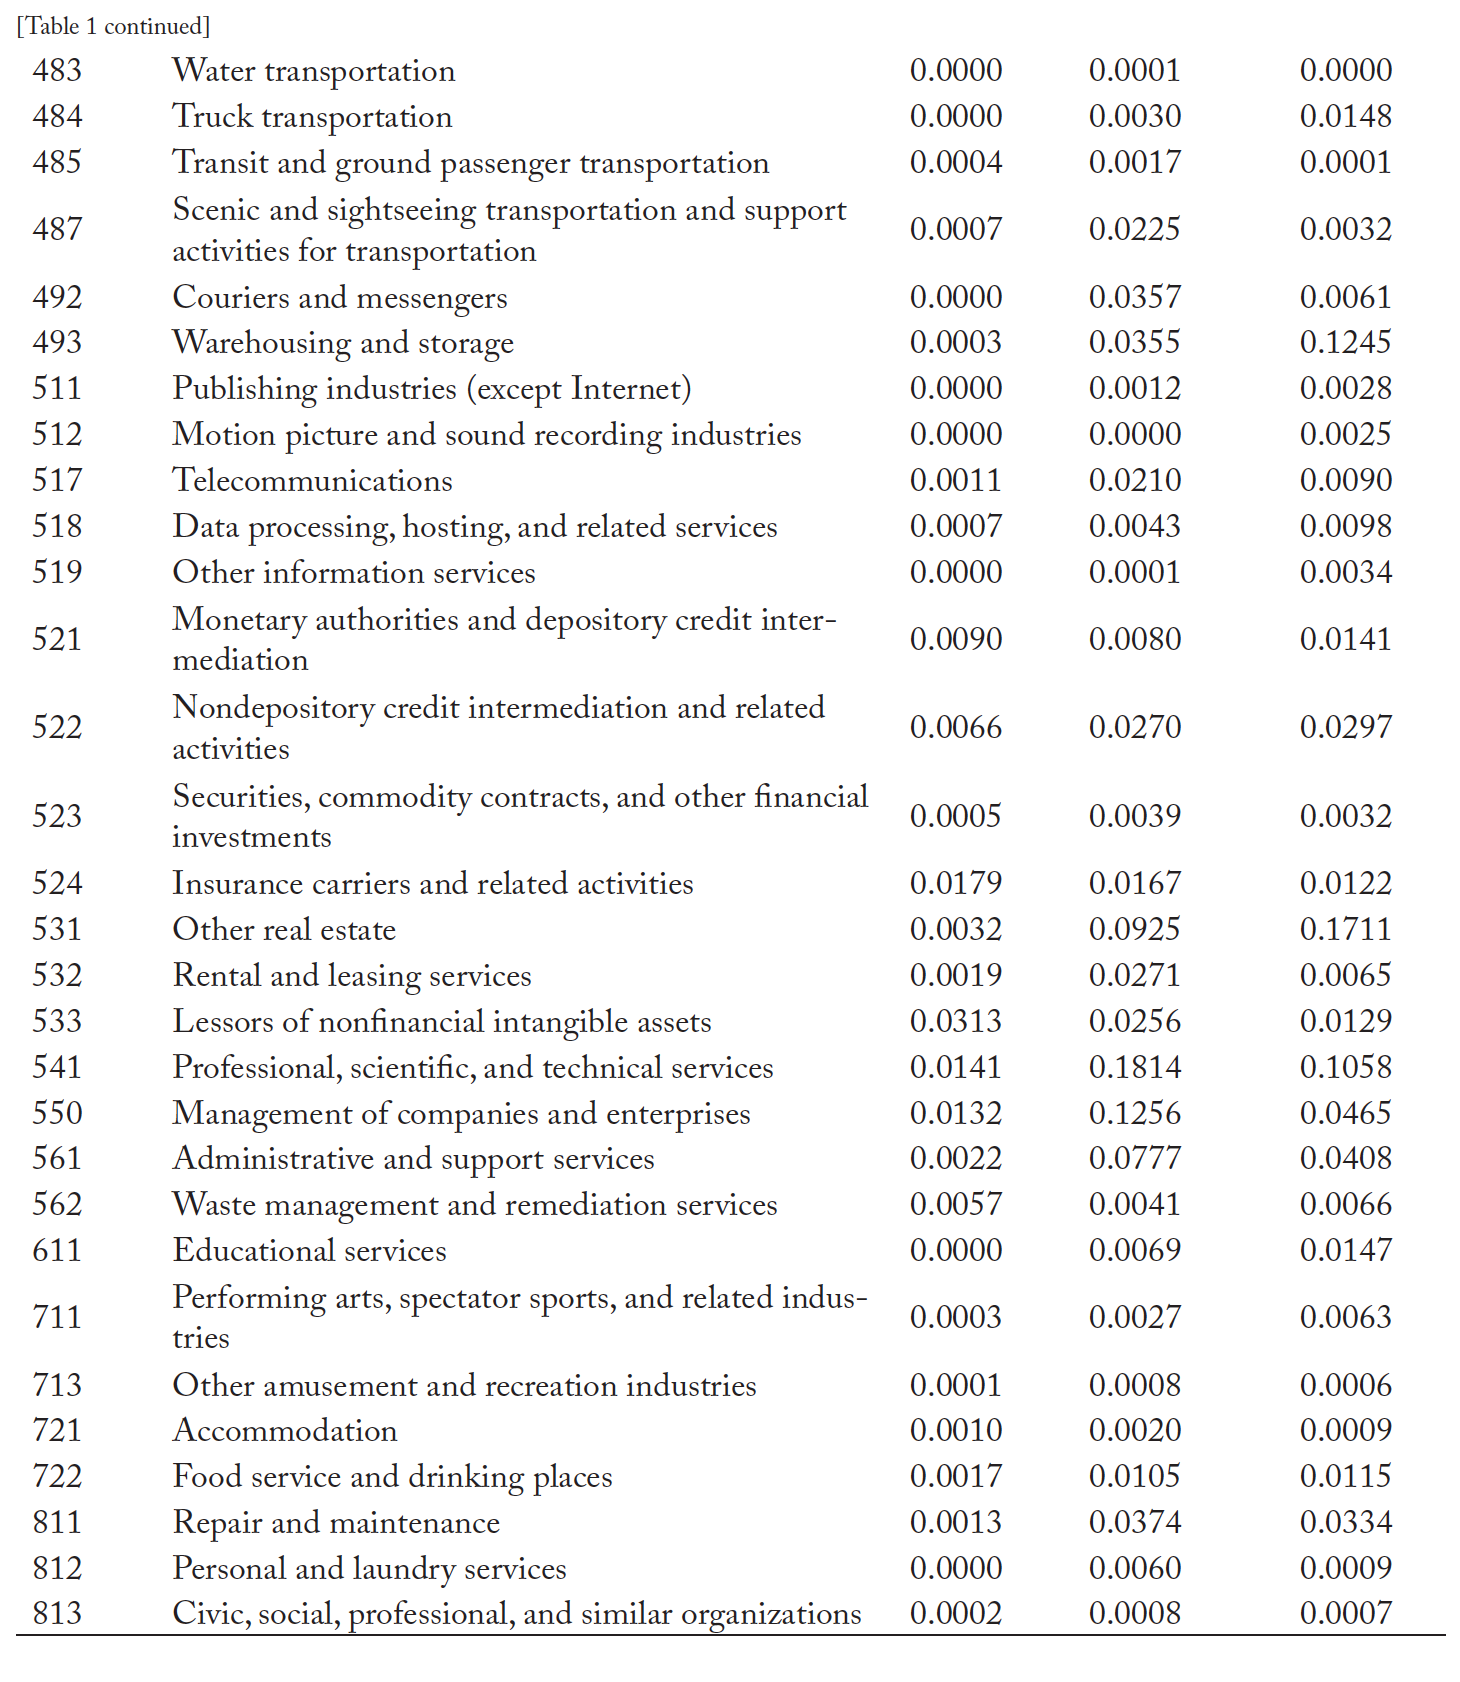
The BEA data are derived from the economic census (latest data are from 2012; see BEA, 2019) and are reported as “The Use Table (Supply-Use Framework), 2012,” which records the dollar value of inputs from private and public entities and industries used as intermediate inputs to produce the output of an industry.6The data can be obtained from https://www.bea.gov/industry/input-output-accounts-data#tab-02 by clicking on Use Tables (Use of commodities by industry) for 2007, 2012 detailed (405) industries (https://apps.bea.gov/industry/xls/io-annual/Use_SUT_Framework_2007_2012_DET.xlsx). The dollar value of inputs from private and public entities and industries used as intermediate inputs to produce the output of an industry are reflected in the columns of the table. Removing inputs from all non-private sector industries (i.e., federal, state, and local government enterprises),7The BEA defines government enterprises as “Government agencies that cover a substantial portion of their operating costs by selling goods and services to the public and that maintain their own separate accounts” (Bureau of Economic Analysis, n.d.). which provided less than 1.27% of all inputs, the remaining inputs are renormalized to add to one (i.e., expressed as value-weighted inputs).8RegData does not estimate regulations that pertain to public sector entities, so the scope of input activity is restricted to non-public sector entities. Moreover, the only government input sectors providing inputs to our three industries were the U.S. Postal Service and “other state and local government enterprises.” In 2012, these public input sectors represented 0.25% of the intermediate inputs for breweries, 2.57% of the intermediate inputs for wholesale distribution, and 0.98% of the intermediate inputs for retail sales. The input weights for each industry used to construct the input models for breweries (NAICS code 312), wholesale distribution (424), and retail sales (445) are provided in Table 1.9Because of differences in RegData coverage across states, the following industries were dropped when calculating Indirect (Input) Regulations because they were not included in 12 state cross-sections: 425, 511, 518, 519, and 521. Fortunately, these obscure industries accounted for approximately one weighted regulation per state, so the overall rankings are not affected by their omission. Combining these input regulations () with the aforementioned direct regulations () yields a comprehensive measure of the regulatory burden faced by the beer value and supply chains, from the upstream, raw commodities used to brew beer to the downstream distribution networks that enable the final sale to the customer:
(2) 
Unfortunately, the granularity of the industry regulation data provided by State RegData is limited to the NAICS three-digit level, while Malone and Chambers (2017) were able to exploit RegData’s five-digit NAICS level of resolution. Specifically, Malone and Chambers approximated sector 31212 (Breweries) by subtracting sector 3122 (Tobacco Manufacturing) from sector 312, yielding a measure of regulations that directly apply to all beverage manufacturing but not tobacco manufacturing.10Detailed descriptions of each NAICS-coded industry are available at the U.S. Census Bureau’s website. Because of State RegDa- ta’s limitations, our measure of the direct regulations for the Breweries industry is proxied using NAICS code 312 (Beverage and Tobacco Product Manufacturing). While we acknowledge this limitation, most states contain neither tobacco farms nor cigarette manufacturers, suggesting that the subset of regulations in NAICS sector 312 pertaining to tobacco is likely small. We proxy direct regulations for wholesale distribution using NAICS code 424 (Merchant Wholesalers, Nondurable Goods). This actually marks an improvement over the methodology utilized in Malone and Chambers (2017), wherein they use the two-digit NAICS code 42 (Wholesale Trade) as a proxy for sector 42481 (Beer Merchant Wholesalers).11As RegData has evolved, the precision of its industry classifier has steadily improved. Therefore, subsequent vintages of RegData have provided more data granularity. Moreover, there are examples of industries (especially in older versions of RegData) in which the level of regulation detail is limited. Finally, we proxy direct regulations for retail stores (NAICS sector 44531) using NAICS code 445 (Food and Beverage Stores), which is the same approach utilized in Malone and Chambers.12NAICS sector 445 includes government-owned alcoholic beverage stores and dispensaries (see https://www.bls.gov/iag/tgs/iag445.htm).
Table 2 provides a list of the direct, input, and total regulations applicable to the beer supply and value chains. To demonstrate that the minor differences in modeling assumptions noted above between Malone and Chambers (2017) and the model presented in this paper likely produce similar results, we re-estimate the level of federal regulations reported in Malone and Chambers (2017) using the model presented in this paper (see Table 2). Comparing regulations pertaining to Breweries, Malone and Chambers report total regulatory restrictions for 2012 (the last year that estimates are available) of 94,212. Our model produces an estimate of 115,081 total federal regulations in 2017, which is 22% greater than the 2012 estimate. This is likely due to the comparison periods differing by five years, during which time federal regulations have likely grown as the beer industry experienced its most rapid expansion. If federal beer industry regulation grew at the average pace of all industries, then we would expect just over 20% growth in total regulation over a five-year period.13Chambers, Collins, and Krause (2019) report that federal regulations (measured at the industry level) grew by an average 3.78% per year between 1999 and 2015. Therefore, when compared to Malone and Chambers, the model presented in this paper produces federal regulatory estimates that appear to be sound and, by extension, should also produce reasonably accurate measures of state regulatory restrictions.
Results
On average, each state imposes 10,212 additional regulations on the production and distribution of beer, but the state-level regulatory burden varies drastically by state, with a minimum of 1,177 additional restrictions (South Dakota) and a maximum of 25,399 regulations (California). As the federal regulations serve as a baseline standard that each jurisdiction must abide by, it takes an average of 125,293 regulations to get a beer (i.e., the sum of federal regulations and the average state’s regulations).
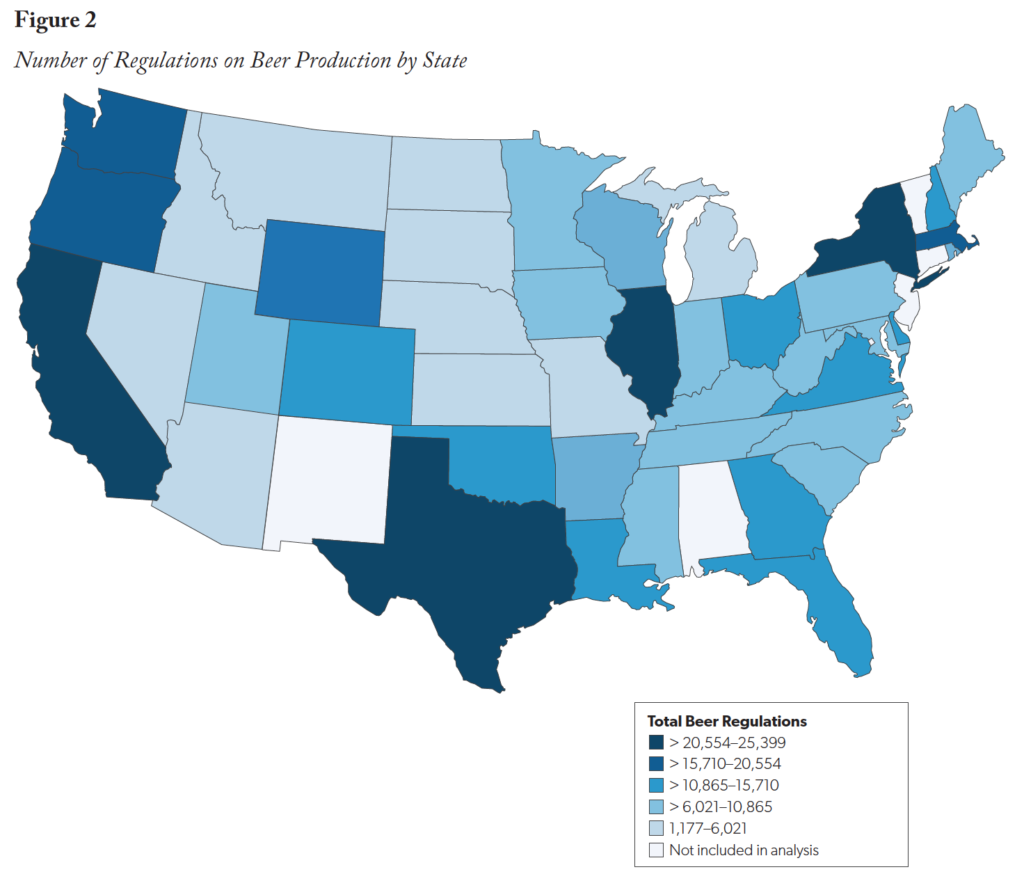
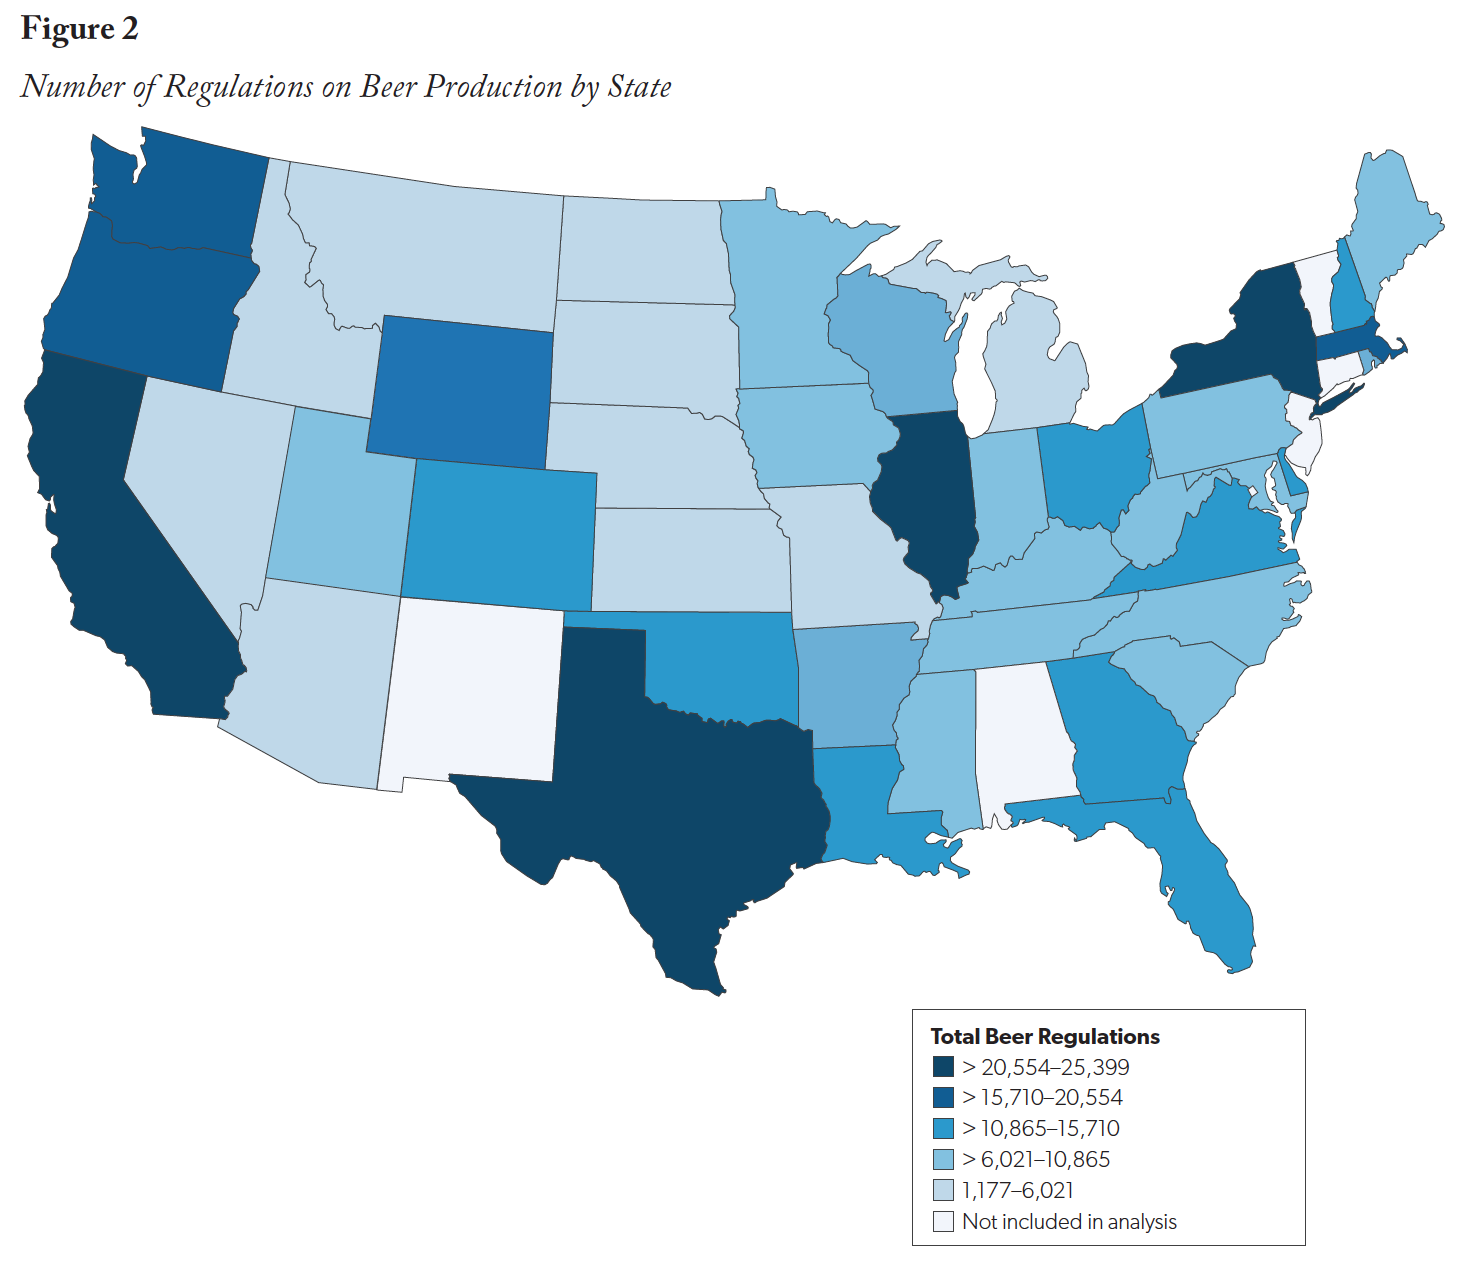
Figure 2 provides a distribution of state-by-state regulations. The five least-regulated states are South Da- kota (1,177 regulations), Idaho (2,450), North Dakota (2,936), Arizona (2,989), and Nevada (3,977). The five most-regulated states are California (25,870 regulations), Texas (24,076), New York (22,648), Illinois (22,198), and Washington (17,573).
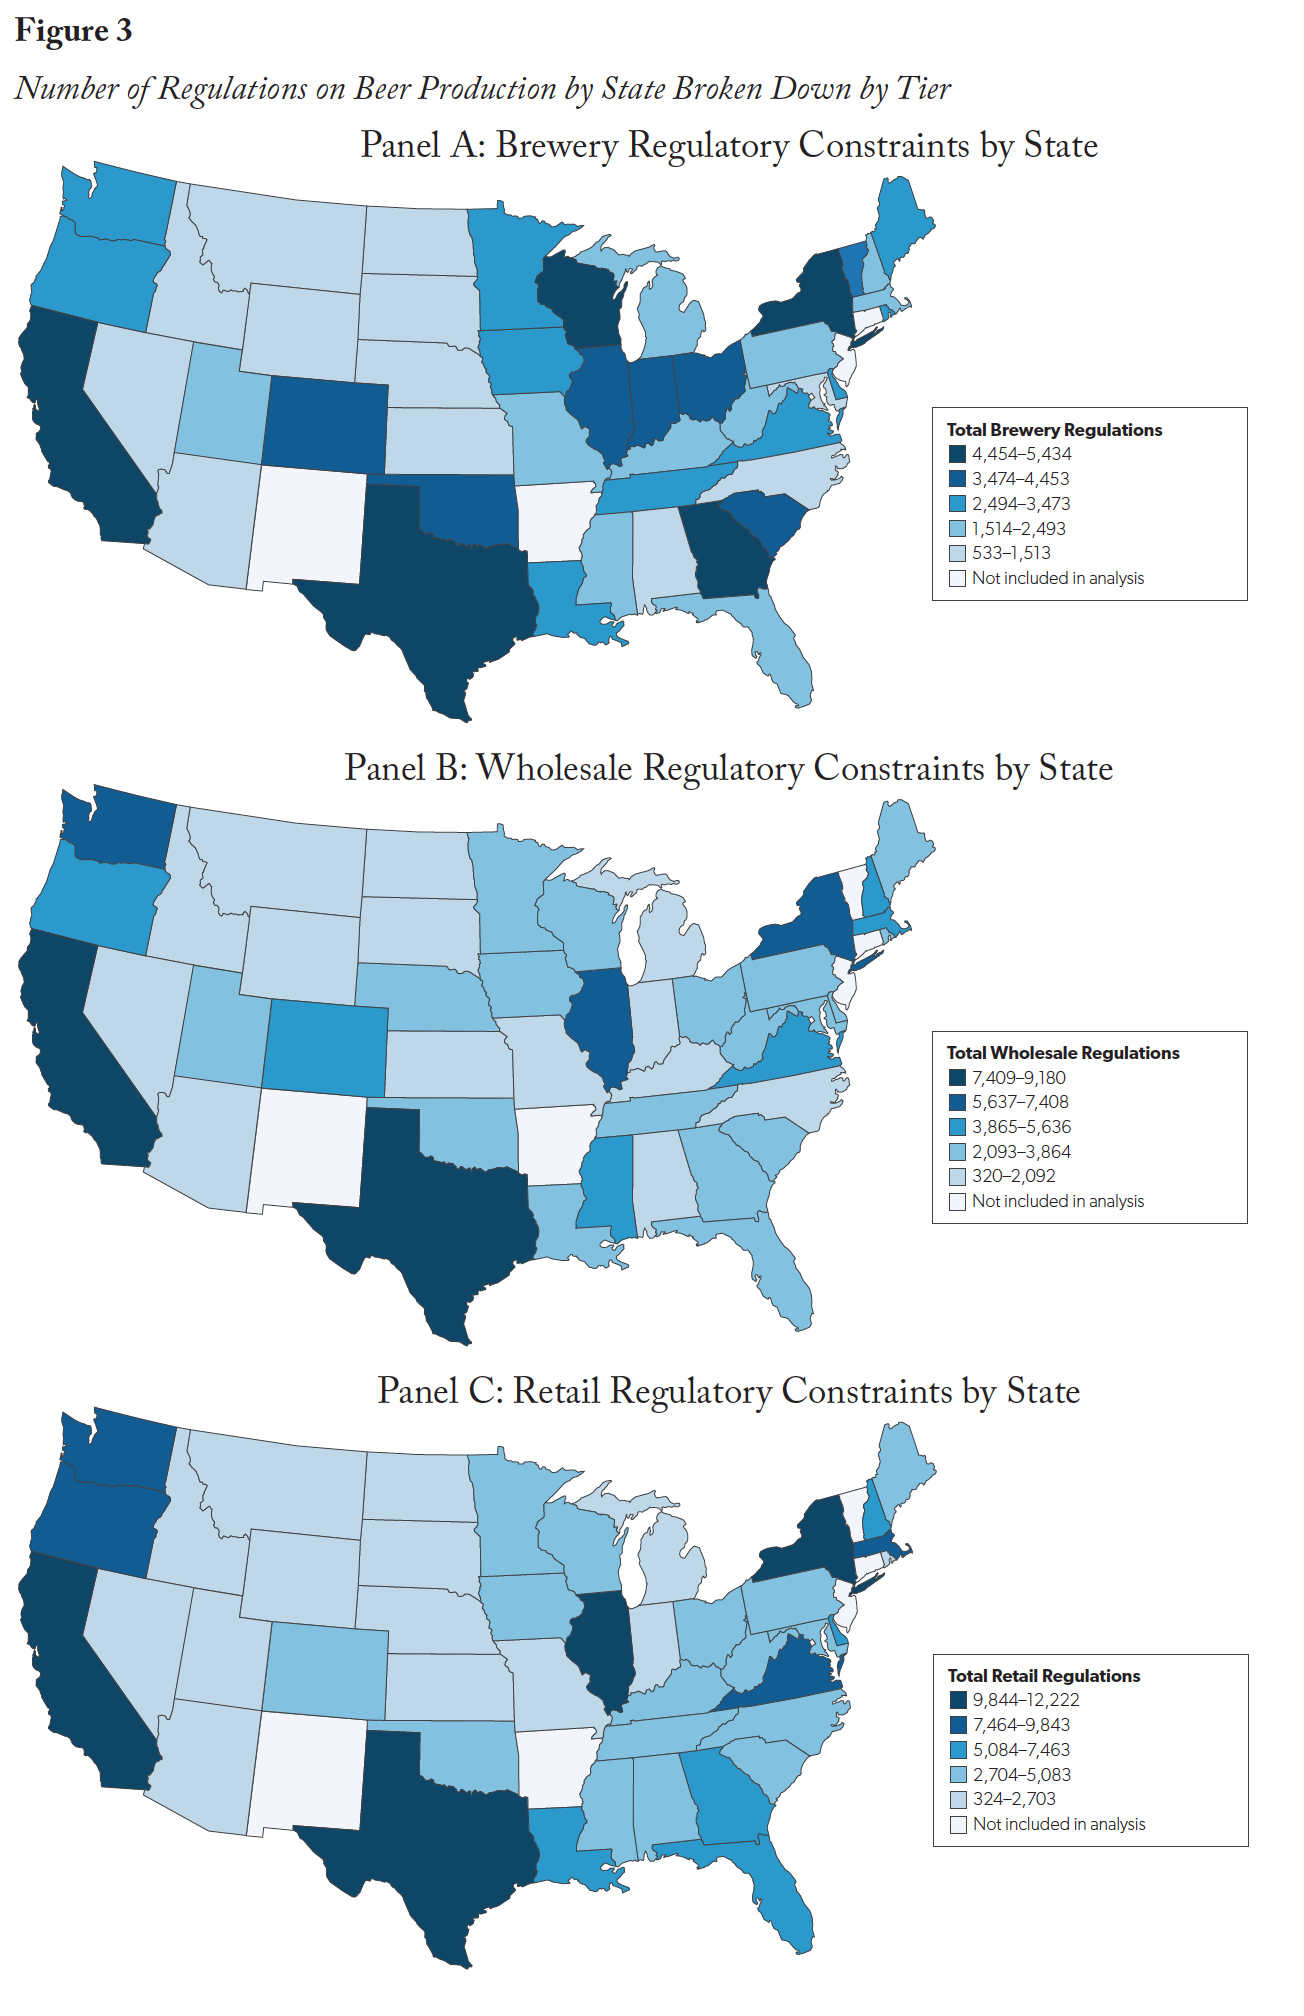
The variation in regulatory constraints is not distributed explicitly across the value chain. Instead, each tier of the supply chain experiences unique concentrations in brewery regulations. The regulatory constraints for each state are broken down by tier in Table 2 and presented in Figure 3. On average, 26% of regulatory constraints are imposed on the breweries, 31% on the wholesale distributor, and 43% on retail outlets.
As seen in the map, the substantial regulatory variation emphasizes the need for each brewery to invest in a deeper institutional understanding of the governing constraints of each state. Many commercial and large craft regional breweries now operate in second locations outside their state of origin. For example, Sierra Nevada Brewing Company opened its first brewery location in Chico, California, in 1993 (the state with most regulations); in 2015 it opened a second location in Mills River, North Carolina (which ranks 29th in total regulations) (Sierra Nevada Brewing Company, 2020). It could be that a brewery compliant with regulations in one state is already compliant with most laws in another, though the regional differences in distribution laws make this unlikely (Gohmann, 2016). Thus, a legal background is critical for understanding regional differences in beer distribution laws.
Equally important is the impact of trade and the origin of beer inputs. Our indirect regulations capture regulatory restrictions that fall outside of the three-tier beer distribution system (brewer to wholesale distributor to retail outlet) but within the beer value chain (e.g., labor, agricultural inputs, etc.). The indirect regulations on the agricultural inputs to beer—primarily hops and (malted) barley—have disproportionate effects on certain regions.14Again, brewers use many other agricultural inputs in the brewing process. For example, large commercial brewers use corn or rice instead of malted barley, and quantities of hops per barrel can vary widely. Other agricultural commodities found in certain beer styles include wheat, rye, oats, spices, and others. Approximately 96% of domestic hops are grown in Washington, Idaho, or Oregon (Hop Growers of America, 2020), while roughly 74% of barley is produced in Montana, North Dakota, or Idaho (USDA 2019a). Thus, if our methods of capturing indirect regulations are accurate, we expect to see greater indirect regulatory restrictions in the states producing the agricultural commodities for beer, thus driving up the total number of restrictions for that state. There is preliminary evidence of this, where Washington and Oregon rank 5th and 6th in total indirect regulations, respectively; 73% of Montana’s regulations are indirect regulations (highest percentage overall); and 62% of Idaho’s regulations are indirect regulations (8th overall). However, given the current framework, we cannot explicitly parcel out the indirect regulations attributed to the agricultural production of beer inputs, as indirect regulations also come from other sources, such as brewery labor.
Conclusion
Regulations can restrict economic activity, though little is known about the full extent of the regulatory burden on an entire supply chain. Supply chains have become more geographically integrated, making geographic variation in regulatory restrictions increasingly important for business growth. This article uses the beer industry as a case study to fill that gap in the literature. Using state and federal data, we find that the U.S. beer supply chain industry is constrained by more than 115,000 regulations from the federal government alone. In addition, state governments impose an average of 10,212 additional regulatory restrictions across the beer supply and value chains. The variation in the number of regulations across states is substantial, ranging from 1,177 to 25,399 state regulatory restrictions. All told, in the United States, an average of more than 125,000 restrictions stand in between each consumer and a six-pack at a retail outlet.
Some limitations remain. While the focus of this article is the total number of regulatory restrictions in the beer supply chain, we take no qualitative aspects of regulations into account. In other words, we make no reference to the objective or the quality of the regulations. Our “regulations” are assumed to be of equal quality and carry equal compliance costs. However, real-world regulations can vary substantially in their costs and benefits to the supply chain. For example, regulations may be put in place to expand local value chains. According to our analysis, New York is the third most regulated beer state, but the New York state government has also developed an advanced farm brewery law. The methodological framework of this article presents this legislation as adding regulatory restrictions, yet the legislation is meant to incentivize a more localized beer value chain through relaxed permit restrictions related to the purchase of state-grown inputs, onsite distribution, and the sale of other alcoholic beverages such as cider (New York State Brewers Association, 2020).
Despite these shortcomings, this article has important implications for future research. At a minimum, the results from this study suggest that there is considerable variation between how states choose to regulate the beer value chain. From an industry with 92 producers in 1980 to an industry with 8,386 producers in 2019 (Brewers Association, 2020), the U.S. beer industry has evolved dramatically over the past few decades. This study lays a foundation of the current regulatory variation across state lines, but future research is needed to determine the evolution of the quantity and quality of regulations. A study incorporating the regulations over time, while controlling for cross-sectional heterogeneity (e.g., number of breweries, population, etc.), could tell a causal story on the driving forces behind regulatory changes. However, this lies outside the scope of our analysis and might be an area for future research.
Our primary purpose is to highlight the complex geographic nature of regulations across interstate value chains. Poorly designed and inefficient regulations can generate many unintended consequences, and although eliminating overlapping and redundant regulations represents one potential means by which total regulations might be reduced, the negative impact of a given regulation can also be reduced through improved regulatory design (i.e., more clarity and simplicity). A growing body of research chronicles the unintended consequences of regulations—especially cost of compliance (see Bailey, Thomas, & Anderson, 2019; Crain & Crain, 2010). Thus, not surprisingly, Vogel (1998) finds that well-written, straightforward regulations are likely to have lower compliance costs, all else equal, while Béland, Rocco, and Waddan (2016) find that ambiguous regulations can induce substantial policy drift, which, if not corrected, can lead to significant negative economic outcomes. Moreover, the regulatory landscape is not static, and the same regulation might be enforced differently over time.15For example, state-level alcohol distribution regulations became more flexible during the COVID-19 outbreak. This is especially likely when new markets are developing, as is the case in many agricultural and food markets. For example, deregulation of hemp production in the United States has also prompted hemp interest groups to ask for more regulatory clarification (Malone & Gomez, 2019; Galloway, 2020).
An additional point often made with consumer product safety regulations is that instead of micromanaging production by way of regulations, it might be preferable to codify “goals” or “outcomes” in regulations. For instance, rather than imposing a larger number of regulations on the manufacturing process itself (e.g., how a product is to be made, what must or must not be added, etc.), policymakers might instead focus on regulating outcomes (e.g., a finished product must not be toxic, cannot cause skin irritation, etc.). In other words, future regulations might focus on goals, not processes ( Jones, 2015).
Appendix
References
Al‐Ubaydli, O., & McLaughlin, P. A. (2017). RegData: A numerical database on industry‐specific regulations for all United States industries and federal regulations, 1997–2012. Regulation & Governance, 11(1), 109–123.
Bailey, J., Thomas, D. W., & Anderson, J. (2019). Regressive effects of regulation on wages. Public Choice, 180(1), 91–103
Béland, D., Rocco, P., & Waddan, A. (2016). Reassessing policy drift: Social policy change in the United States. Social Policy & Administration, 50(2), 201–218.
Brewers Association. (2020). National beer sales & production data. https://www.brewersassociation.org/statistics-and-data/national-beer-stats/
Bureau of Economic Analysis. (2019, October 29). Input-output accounts data. https://www.bea.gov/indus-try/input-output-accounts-data
Bureau of Economic Analysis. (n.d.). Government enterprises. In BEA.gov Glossary. Retrieved October 29, 2019, from https://www.bea.gov/help/glossary/government-enterprises
Burgdorf, J. (2019). Impact of mandated exclusive territories in the U.S. brewing industry: Evidence from scanner level data. International Journal of Industrial Organization, 63(C), 376–416.
Chambers, D., Collins, C. A., & Krause, A. (2019). How do federal regulations affect consumer prices? An analysis of the regressive effects of regulation. Mercatus Center Working Paper, February 2016: https://www.mercatus.org/system/files/Chambers-How-Regs-Affect-Prices-v2.pdf
Chambers, D., Collins, C. A., & Krause, A. (2019). How do federal regulations affect consumer prices? An analysis of the regressive effects of regulation. Public Choice, 180(1-2), 57–90.
Coffey, B., McLaughlin, P.A. & Peretto, P. (2016) The Cumulative Cost of Regulations. Mercatus Center Working Paper, April 2016: https://www.mercatus.org/system/files/Coffey-Cumula-tive-Cost-Regs-v3.pdf
Coffey, B., McLaughlin, P.A. & Peretto, P. The Cumulative Cost of Regulation. Forthcoming in Review of Economic Dynamics.
Crain, N. V., & Crain, W. M. (2010, September). The impact of regulatory costs on small firms. Small Business Administration, Office of Advocacy, Washington, D.C.
Crum, M., & Gohmann, S. F. (2016). The impact of taxes and regulations on firm births and deaths in state border counties. Journal of Entrepreneurship and Public Policy, 5(1), 25–37.
Dawson, J.W., & Seater, J.J. (2013). Federal regulation and aggregate economic growth. Journal of Economic Growth, 18, 137–177.
Delaney, E., & Haines, M. (2017, December). Industry on tap: Breweries. U.S. Bureau of Labor Statistics. https://www.bls.gov/spotlight/2017/industry-on-tap-breweries/home.htm
Dobis, E. A., Reid, N., Schmidt, C., & Goetz, S. J. (2019). The role of craft breweries in expanding (local) hop production. Journal of Wine Economics, 14(4), 374–382.
Galloway, M. (2020). Hemp in 2020: Still worth the risk? Michigan Farm News. https://www.michigan- farmnews.com/hemp-in-2020-still-worth-the-risk
Gohmann, S. F. (2016). Why are there so few breweries in the South? Entrepreneurship Theory and Practice. 40(5), 1071–1092.
Hop Growers of America. (2011, January). 2010 Statistical Report. https://www.usahops.org/img/blog_ pdf/12.pdf
Hop Growers of America. (2020, January). 2019 Statistical Report. https://www.usahops.org/img/blog_ pdf/273.pdf
Jones, L. (2015, November). Cutting red tape in Canada: A regulatory reform model for the United States? Mercatus Research, Mercatus Center at George Mason University, Arlington, VA. https://www.mercatus.org/system/files/Jones-Reg-Reform-British-Columbia.pdf
Malone, T., & Chambers, D. (2017). Quantifying federal regulatory burdens in the beer value chain. Agribusiness, 33(3), 466–471.
Malone, T., & Gomez, K. (2019). Hemp in the United States: A case study of regulatory path dependence. Applied Economic Perspectives and Policy, 41(2), 199–214.
Malone, T., Koumpias, A. M., & Bylund, P. L. (2019). Entrepreneurial response to interstate regulatory competition: Evidence from a behavioral discrete choice experiment. Journal of Regulatory Economics, 55(2), 172–192.
Malone, T., & Lusk, J. L. (2016). Brewing up entrepreneurship: Government intervention in beer. Journal of Entrepreneurship and Public Policy, 5(3), 325–342.
Malone, T., & Stack, M. (2017). What do beer laws mean for economic growth? Choices, 32(3), 1–7. Madsen, E. S., Gammelgaard, J., & Hobdari, B. (Eds.). (2020). New developments in the brewing industry: The role of institutions and ownership. Oxford University Press.
Michigan House Bill 5343, 100th Cong., Reg. sess. (2020) (enacted). http://www.legislature.mi.gov/docu-ments/2019-2020/billintroduced/House/pdf/2020-HIB-5343.pdf
Miller, S. R., Sirrine, J. R., McFarland, A., Howard, P. H., & Malone, T. (2019). Craft beer as a means of economic development: An economic impact analysis of the Michigan value chain. Beverages, 5(2), 35.
New York State Brewers Association. (2020). Farm brewery. https://newyorkcraftbeer.com/farm-brewery/
QuantGov. (2020, July 8). State RegData Technical Documentation. https://www.quantgov.org/state-regda-ta-documentation
Shumway, K. (2017). Brewbound voices: Deconstructing self-distribution (part I). Brewbound. https://www.brewbound.com/news/brewbound-voices-deconstructing-self-distribution-part
Sierra Nevada Brewing Co. (2020). Our story. https://sierranevada.com/about/our-story/ Stansel, D., & McMahon, F. (2018). Economic freedom of North America 2013. Fraser Institute.
Staples, A. J., Malone, T., & Sirrine, J. R. (2020). Hopping on the localness craze: What brewers want from state-grown hops [Manuscript submitted for publication].
Stigler, G. J. (1971). The theory of economic regulation. The Bell Journal of Economics and Management Science, 2(1), 3–21.
Summers, A. B. (2007). Occupational licensing: Ranking the states and exploring alternatives. Reason Foundation.
Tarko, V., & Farrant, A. (2019). The efficiency of regulatory arbitrage. Public Choice, 181(1-2), 141–166.
Teague, M. (2016). Barriers to entry index: A ranking of starting a business difficulties for the United States. Journal of Entrepreneurship and Public Policy, 5(3), 285–307.
U.S. Census Bureau. (n.d.). 2017 NAICS definition. North American Industry Classification System. Retrieved July 13, 2020, from https://www.census.gov/cgi-bin/sssd/naics/naicsrch?input=312&-search=2017+NAICS+Search&search=2017
USDA, National Agricultural Statistics Service. (2019a, June 30). Acreage. https://usda.library.cornell.edu/concern/publications/j098zb09z
USDA, National Agricultural Statistics Service. (2019b, December 18). National hop report. https://www.nass.usda.gov/Statistics_by_State/Regional_Office/Northwest/includes/Publications/Hops/Nation-al%20hop_2019.pdf
Vogel, Steven K. (1998). Freer markets, more rules: Regulatory reform in advanced industrial countries. Cornell University Press.