
 MDPI
MDPIIntroduction
Since Becker (1968), crime has been viewed as the outcome of rational individuals weighing costs and benefits of legal and illegal forms of employment. Thus, if individuals face improved labor markets, the returns to legal activity increase and individuals should substitute away from illegal activities. Yet, local economic booms are often associated with increases in crime (Grinols and Mustard, 2006; Freedman and Owens, 2016; James and Smith, 2017). Several theories can rationalize this phenomenon including increases in criminal opportunities, access to disposable income for activities that complement crime, and population changes. However, the extent to which each of these theories explains this puzzle is unclear, especially since changes in crime are typically observed at an aggregate level.
The purpose of this paper is to address this puzzle by estimating the effect of local economic opportunity on the criminal behavior of residents who already lived in the area prior to the economic boom. By focusing on the criminal behavior of existing residents, I disentangle the effect of economic opportunity from the effect of the compositional changes in the population caused by in-migration during the boom. This is important, because people tend to leave as labor market conditions worsen and migrate to areas during economic expansions. I use the recent boom in hydraulic fracturing in North Dakota as a large, exogenous shock to an individual’s relative returns to legal versus illegal behavior. This approach, combined with the focus on the behavior of residents already living there prior to the start of hydraulic fracturing, enables me to identify the effect of economic opportunity on individual criminal behavior.
I identify effects using a difference-in-differences framework, comparing counties located in the shale play, a geological area with oil and natural gas, to counties not located in the shale play over time. Importantly, I measure the impact on residents, separating out migration effects, by using information on local residents prior to the economic shock. The sharp increase in hydraulic fracturing activity in the United States is an ideal economic shock for several reasons. First, areas were affected based on the formation of the shale play beneath the Earth’s surface. Second, the shock was largely unforeseen, as fracking suddenly became a viable method due to a combination of technological innovations (Wang and Krupnick, 2015; Crooks, 2015). Together, these support the assumption that fracking affected local labor markets for reasons unrelated to prior local conditions and household behaviors, overcoming common critiques of the difference-in-differences research design.1For example, see Besley and Case (2000) for discussion about policy endogeneity in difference-in-differences frameworks. Third, hydraulic fracturing was large enough to affect the entire local economy in many areas. Finally, the shock affected predominately low-skill jobs, a population of policy interest.
Studying the effects at the individual level requires detailed data on hydraulic fracturing activities, criminal behavior, and local residents in North Dakota.2North Dakota is well suited for this analysis as it was the third-slowest-growing state in 2000, and increased its real gross domestic product 115% by the end of the fracking boom in 2016 (U.S. Bureau of Economic Analysis, 2018). Also, it is the second largest crude oil producing state in the United States. I obtained detailed administrative data on the universe of criminal cases filed in the state from 2000 to 2017. I identify residents in each county from printed directories in the early 2000s before the in-migration associated with production activities. I also observe which residents signed a mineral lease and received royalty payments during this period. This enables me to not only identify the effect of improved labor market opportunities, but also isolate differential effects on residents who received large, non-labor income shocks and those who did not. Matching these datasets makes it possible to study the effect of local economic shocks on the criminal behavior of local residents. This is an important advantage given the large migration effects that have been documented in response to economic conditions in general, and to fracking in particular (Wilson, 2017).
Results indicate that the start of the economic expansion — defined as the period when companies began leasing mineral rights and investing in the area — led to a statistically significant 0.44 percentage point (22%) reduction in criminal behavior by local residents. The effects are largest for drug-related crimes, though I also see some less precisely estimated declines in other crimes. The effect after production began is smaller and not consistently statistically significant, with a 0.27 percentage point decrease in the likelihood of committing a crime. This suggests that changes during the production period, such as increased income or changes in peer composition, offset some of the effect of improved job opportunities. These results do not appear to be driven by changes in the police force, addressing concerns about detection and deterrence.
In addition, I exploit variation in mineral rights ownership and royalty income to assess the extent to which the effects are driven by labor market opportunities versus non-labor income shocks. Results indicate that the reduction in crime seems to be driven by non-leaseholders. This is consistent with the hypothesis that those not receiving income through alternative means are more responsive to increased job opportunities. However, I note that the effect sizes are not statistically distinguishable.
To my knowledge, this is the first paper to identify effects of economic shocks on individuals’ criminal behavior separate from the effect of migration. In doing so, it contributes to two bodies of literature. First, it contributes to the literature showing how aggregate crime changes in response to plausibly exogenous shocks to economic conditions (e.g., Dix-Carneiro, Soares and Ulyssea, forthcoming; Axbard, 2016; Grinols and Mustard, 2006; Gould, Weinberg and Mustard, 2002; Raphael and Winter-Ebmer, 2001; Evans and Topoleski, 2002; Montolio, 2018; Grieco, 2017). These studies generally show aggregate crime is inversely related with economic conditions, with some exceptions.
In particular, this paper complements a subset of this literature that has documented the role of criminal opportunity and income inequality in explaining the observed increases in aggregate crime that arise during economic expansions (e.g., Mejia and Restrepo, 2016; Cook, 1986). For example, Freedman and Owens (2016) study the effect of BRAC funding in San Antonio on crime using individual-level data. They find an increase in property-related crime in neighborhoods with a high composition of construction workers, those most likely to benefit from the economic shock. They also find that crime is more likely to be committed by individuals with a prior criminal record, who are unable to be employed by the project. In a similar way, this paper documents that once one accounts for population changes that accompany economic expansions, one observes the expected relationship between improved job opportunity and individual crime. Together, the findings of those papers and this paper suggest that both criminal opportunity and shifts in population can explain the puzzling finding that aggregate crime often rises during economic expansions.
Second, this study contributes to the growing literature on the effects of fracking, which has transformed many regions in the United States. Specifically, crime has generally been shown to increase in areas with fracking activities (James and Smith, 2017; Andrews and Deza, 2018; Komarek, 2017; Bartik, Currie, Greenstone and Knittel, 2016).3Alternatively, Feyrer, Mansur and Sacerdote (2017) do not find statistically significant evidence of an increase in crime across all counties with fracking. However, the increase could be driven by changes in the population of workers moving to the area or an individual’s response to the changing economic conditions. I measure a similar increase in aggregate cases filed in fracking counties, but find that local residents in the county are actually less likely to commit crime when exposed to relatively stronger labor market conditions. This is consistent with predictions of the economic theory of crime when the returns to legal employment increase, and indicates that fracking has reduced individuals’ propensity to commit crime.4This is also consistent with empirical evidence documenting a similar inverse relationship between recidivism and economic conditions (e.g., Agan and Makowsky, 2018; Yang, 2017; Galbiati, Ouss and Philippe, 2018; Schnepel, 2017) and in the fracking context specifically (Eren and Owens, 2019), as well as increased lifetime criminal behavior for cohorts graduating high school in harsher economic conditions (Bell, Bindler and Machin, forthcoming)
Finally, while the primary purpose of this study is to examine the impact of economic expansions on the criminal behavior of local residents, this study’s findings on aggregate crime also speak to the literature on (im)migration and crime. Immigration to the United States and Western Europe typically increases in response to improved relative economic opportunity in those countries. Many worry that the immigration to high-income countries could increase crime rates, though some recent empirical evidence suggests this fear may be misplaced (Bell, Fasani and Machin, 2013; Chalfin, 2015; Spenkuch, 2013; Miles and Cox, 2014; Butcher and Piehl, 2007).5While the overall evidence on this question is mixed, Bell, Fasani and Machin (2013) finds no effect on violent crime and mixed effects on property crime, Chalfin (2015) shows an increase in aggravated assaults, but decreases in other crimes, and Spenkuch (2013) reports small increases in crime, particularly financial crime. Relatedly, Miles and Cox (2014) finds no effect of a deportation policy on local crime. Moreover, Butcher and Piehl (2007) shows that immigrants typically have lower crime rates than do native-born residents potentially due to a combination of heavy screening of would-be migrants, and self-selection of those migrants. Results on aggregate crime presented here indicate that the migration of mostly young, American men does lead to increased crime overall. Thus, changing the composition of a local population can be an important driver of criminal activity, although the effects may depend heavily on who the migrants are. Since young men are a particularly crime-prone population, economic booms that attract this group may be more likely to lead to higher crime rates.
Background
Advances in hydraulic fracturing contributed greatly to the recent oil boom in the United States. From 2000 to 2015, oil produced from fractured wells increased from 2% to over 50% of domestic production, increasing total oil production faster than at any other point in time (Energy Information Administration, 2016). Fracking suddenly became more profitable due to a breakthrough in directional drilling, hydraulic fracturing technologies, and seismic imaging (Wang and Krupnick, 2015; Crooks, 2015). Hydraulic fracturing involves injecting fluids at a high pressure into a shale play in order to crack the rock formation and extract tight oil and shale gas.6The Energy Information Administration defines a shale play as a “fine-grained sedimentary rock that forms when silt and clay-size mineral particles are compacted, and it is easily broken into thin, parallel layers. Black shale contains organic material that can generate oil and natural gas, which is trapped within the rock’s pores” (2018). I focus on oil production as North Dakota’s production is typically only 10-20% gas, with the rest being oil. This process allowed mineral resources to be extracted from shale plays that were previously not economically viable.
One such area is the Bakken formation in North Dakota. It is smaller only than the Permian and Eagle Ford formations in Texas in crude oil production. Figure 1 shows the 17 counties that produce oil and gas in North Dakota, each classified by production levels as either a core (major) or balance (minor) county. Four counties make up the major fracking counties producing 80% of North Dakota’s oil from 2000–2017, with the remaining 13 producing 20%.
Figure 1. Fracking counties in North Dakota
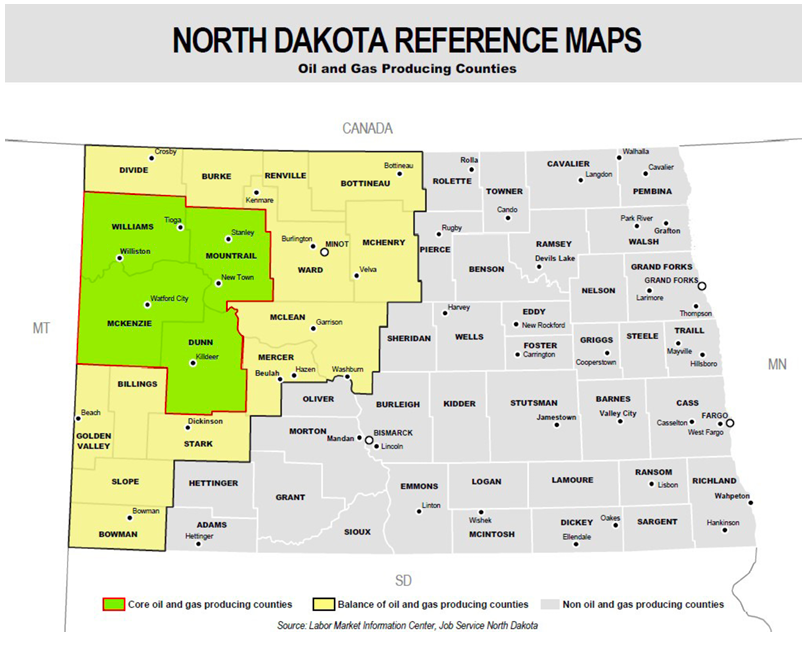
Source: Labor Market Information Center, Job Service North Dakota
Companies leased the mineral rights required for production from individuals or agencies in exchange for a portion of total revenue. Figure 2a plots the number of leases signed by households in North Dakota each year from 2000 to 2017. It is clear that lease signing first spiked in 2004 signaling when companies first began investing in hydraulic fracturing in North Dakota. Similarly, Figure 2b graphs total oil production in North Dakota showing that production lagged leasing by a few years, starting to increase in 2008. From 2008 to 2017, North Dakota produced oil valued at an estimated $2,904,191 million.7This estimate is calculated based on total monthly oil production in North Dakota (Department of Mineral Resources, 2018) and the monthly North Dakota oil first purchase price (Energy Information Administration, 2018a).
Figure 2. Leasing and production
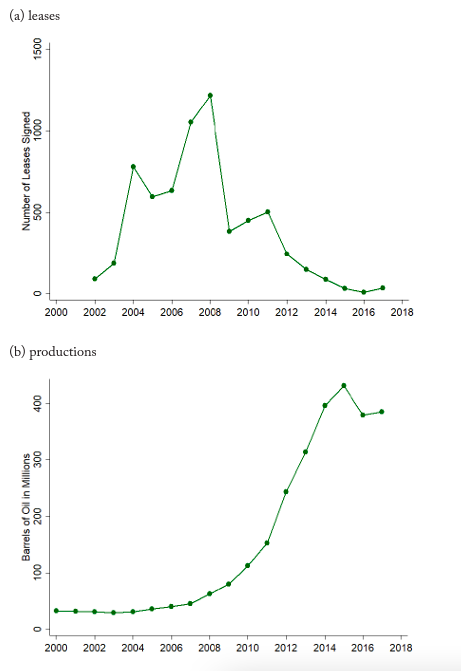
Notes: All leases in North Dakota are collected from Drilling Info for 2000–2017. Only leases matched to rural residents in the early 2000s are depicted in the figure above, as this is the sample of leases used in the analysis. Monthly county production data are from North Dakota Department of Mineral Resources.
Perhaps unsurprisingly, the presence of hydraulic fracturing activities has had a substantial impact on local labor markets. Feyrer, Mansur and Sacerdote (2017) estimate that every one million dollars of new production generates 0.85 jobs and $80,000 in wages in counties with a shale play across the United States.8Other papers estimating increases in wages and employment from fracking activities include Bartik, Currie, Greenstone and Knittel (2016); Allcott and Keniston (2017); Fetzer (2014); Maniloff and Mastromonaco (2014); Weber (2014) and Gittings and Roach (2018) to name a few. Similarly, in response to the stronger labor markets, Wilson (2017) estimates that the in-migration of workers increased the baseline population in fracking counties by 12% on average in North Dakota. Additionally, individuals who also owned mineral rights received 10–20% of production revenues through royalty payments. As I show in the next section, I estimate that the average leaseholder earned a royalty of $7,500 per month, which is a substantial non-labor income shock.
Figure 3 shows that prior to the fracking boom, counties in North Dakota were relatively similar in terms of per capita income, total jobs, population, and total police officers.9County-level data on income and total jobs are obtained from the Bureau of Economic Analysis. Population is calculated using the number of migrant and non-migrant tax exemptions from the Internal Revenue Service. The number of personal exemptions provides a year to year estimate of the population for counties based on the address listed on an individual’s income tax return. Police employment data are from the Uniform Crime Reporting Program: Police Employee (LEOKA) data. The leasing period, when residents first knew of the fracking boom, was characterized by slight increases in per capita income, total jobs, and population (2004 to 2008). Oil production began ramping up in 2008 and is the more labor-intensive period. This is when companies began offering high paying jobs and moving in a large number of workers, often into camps due to housing shortages. It is also the period when the majority of households that had signed a lease received royalty payments and increases in overall crime were reported. This is reflected in the data, as Figure 3 shows fracking counties experienced large increases in income, jobs, population, and police officers during the post-2008 production period. While the economic opportunities continued through this period, counties changed in several other ways as well. As a result, in my analysis I will estimate the effect of expected economic opportunity that occurs after signing but before drilling, as well as the effect of drilling. I expect the former will pick up the effect of job opportunities both expected and realized, while the latter will measure the effect of job opportunities along with large population and income changes.
Figure 3. County demographics by fracking region
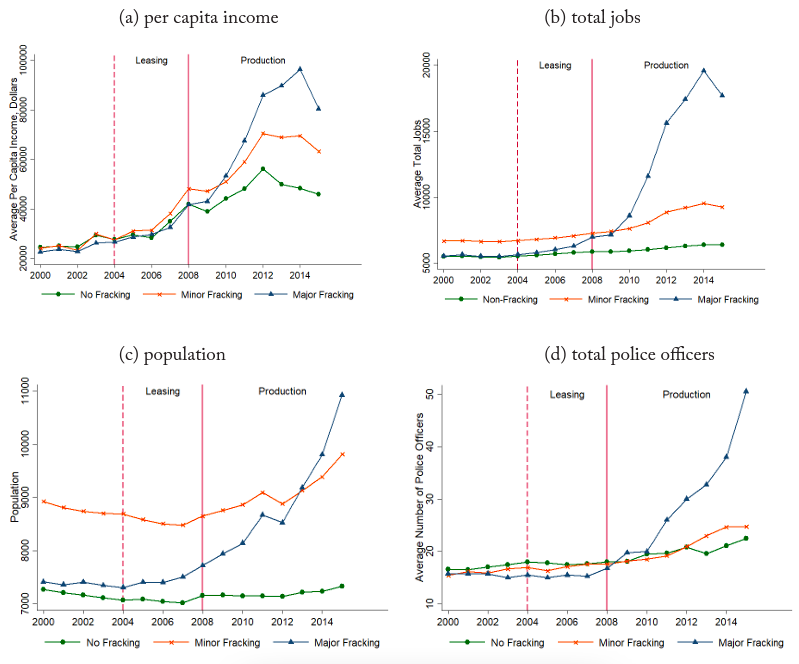
Notes: Data on income and jobs are from Bureau of Economic Analysis. Population is calculated using the number of migrant and non-migrant tax exemptions from the Internal Revenue Service. Police employment data are from the Uniform Crime Reporting Program: Police Employee (LEOKA) Data.
Economic theory predicts that the labor market changes from fracking activities may affect crime in several ways. First, the additional jobs and higher wages should induce individuals to substitute away from illegal activities now that the returns to legal activities are higher. Alternatively, the large cash transfers—via royalty payments—to some households may lead to more crime through increased income inequality and opportunity of crime. Additionally, the increased income through either royalties or higher wages could affect crime by easing financial constraints or providing more disposable income to consume goods that may complement crime (e.g. alcohol). Finally, the large migration effects observed in the production period are likely to affect crime both through population increases and compositional changes.
There are three main advantages of studying the effect of positive economic shocks on crime in this context. First, the sudden increase in hydraulic fracturing activities creates plausibly exogenous variation in exposure to improved labor market conditions. Second, I am able to distinguish the effect on crime by the existing population from aggregate effects which include individual changes in behavior as well as compositional changes. Specifically, I am able to focus my analysis on households already living in the area using directory files in each county to identify residents. Finally, I can study how these residents respond to changes in economic opportunity as well as the economic opportunity plus the subsequent influx of people and income by examining both the earlier leasing period and the more labor-intensive production period.
Data
For this analysis, it is necessary to identify residents in years prior to the fracking boom to account for migration. To do this, I collected a list of all rural residents for each county in North Dakota prior to 2008 from the Great Plains Directory Service.10The Great Plains Directory Service obtains their information from property tax records reported by each county and reports who resides at the property for areas outside the city. Residents living within city limits are not included in the directories and thus are not considered in this analysis.11Notably, the directories are created for a county every few years and directories for all counties were not created in the same year. All counties are included except Cass, Grand Forks, Pembina, and Traill, which were not covered by the Great Plains Directory Service. Households listed in these directories represent roughly 20% of all households in North Dakota during this time. The directory information includes the name, address, and city of all rural residents. In total, there are 31,168 households defined by resident last name, street number, city, and zip code. I consider this to be the universe of households, which I match to lease and crime data using a Levenshtein Index.12I allow matches with a string distance of two or less. In practice, this means two strings are matched across datasets if there are only two changes that need to be made to the concatenated string of last name, street number, city, and zip code in order for them to be exact matches. In Table A.2, I show that main results are robust to this index.
One potential concern with identifying residents is that some people may have moved into fracking counties prior to the large in-migration associated with the production period. For example, strategic households may move in advance to have first access to housing or jobs. However, to be recorded in the resident directories, any movers would have to move into the rural areas. If this were the case, we would expect to see an increase in property sales prior to the production period. I show in Figure A.1 that property sales in fracking counties remain similar to sales in non-fracking counties throughout the leasing period. Thus, the residents in directory files are likely all long-time residents of the county.
A second concern is that household composition could be changing over time. Even if households are not moving into fracking counties, it is possible that some members of the household move in response to the local economic shock. Specifically, younger men may move either to or from a resident household address as jobs enter the county. In this case, if they officially change their address, their criminal behavior may be assigned to a household differentially during treatment periods. Thus, the results could be picking up a change in household composition, rather than a change in criminal behavior. If this were the case, I should not see the same effects when limiting the analysis to the criminal behavior of older, more stable household members. However, in Section 5.1, I show results are robust to this sample restriction, suggesting that it is changes in criminal behavior that are driving my results.
I identify which households also have a mineral lease by collecting all leases signed from 2000 to 2017 in North Dakota from Drilling Info, a private company designed to aid companies participating in all steps of mineral production. Data include name and address of the grantor, company listed as grantee, number of acres leased, royalty rate, and date of record. Production data at the county- and well-level are collected from the North Dakota Department of Mineral Resources. I use these datasets to approximate the amount of monthly oil production from a given well that is attributed to an individual leaseholder. This amount is dollarized using the North Dakota Crude Oil First Purchase Price to estimate the amount leaseholders receive in the form of royalty payments.13Each well in North Dakota is assigned a spacing unit which defines the area of land surrounding the well with rights to production. These boundaries are determined in court hearings at the request of the proposed well operator and based on the recommendations of geologists. By matching leaseholders to spacing units, I define the proportional interest in monthly production for each leaseholder based on acres leased. The dollar value is calculated using the monthly North Dakota Crude Oil First Purchase Price. I subtract $10/barrel to account for post production costs, namely, transportation. I deduct 10% for severance tax, since North Dakota collects 5% for gross production in lieu of property tax on mineral rights and 5% for oil extraction. Leaseholders then get a fraction depending on their negotiated royalty rate, typically 12–18%.
The State of North Dakota Judicial Branch provided restricted administrative data on all criminal cases filed in North Dakota from 2000 to 2017. Importantly, data contain identifying information including the name, date of birth, and address of individuals charged with a crime. This allows me to link to residential files and identify crime committed by local residents. I also observe the file date, specific charges filed, disposition of each charge, sentence received, and county of filing for every case.
There are two main advantages to using cases filed as a measure of criminal behavior. First, cases filed are considerably more serious than 911 calls or arrests, as an individual has officially been charged with a crime. As a result, charges filed are arguably a less noisy measure of criminality than the other possible alternatives. This is reflected by the fact that only 61% of all arrest charges in North Dakota were filed by the prosecutor’s office over the last five years.14This estimate is based on numbers produced by the North Dakota Attorney General’s Office, received September 2018 Additionally, the State of North Dakota specifically advises employers not to ask about prior arrests as “an arrest does not mean that someone actually committed a crime” North Dakota Department of Labor and Human Rights (2018). Second, since cases filed are recorded in an administrative database, they do not suffer from voluntary reporting practices or a lack of coverage, particularly in areas that are sparsely populated. Additionally, these data report information on all charges, including offenses which are often not tracked in other commonly used datasets, such as drug charges or driving while under the influence.
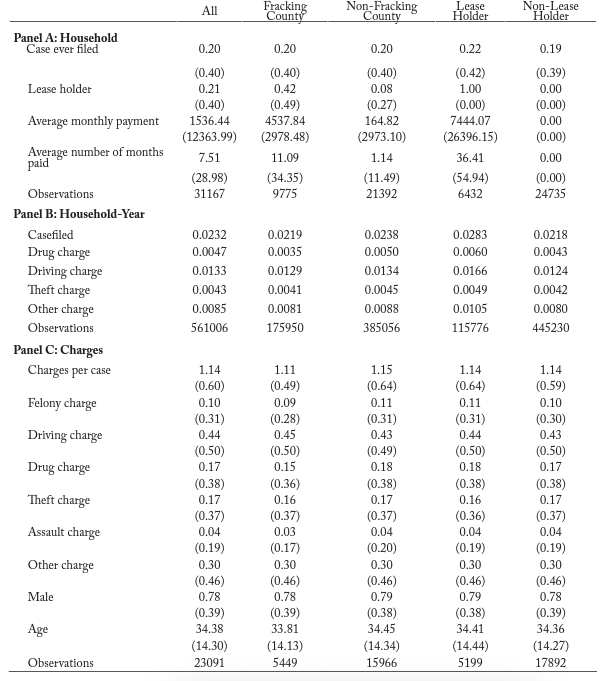
Summary statistics are shown in Table 1. Close to 20% of households are ever charged with a crime from 2000 to 2017 (Table 1, Panel A). The types of charges filed for this population, namely rural residents, are summarized in Panel C. The majority of crimes are misdemeanors (∼90%), with driving-, drug-, and property-related charges making up roughly 44%, 17%, and 17% of all charges, respectively. Smaller crime categories representing less than 10% of all charges, such as assault (4%), are grouped together in other charges. Of the households in my sample, roughly 20% sign a lease and may receive royalty payments during this period (Table 1, Panel A). Close to 40% of leaseholders in my sample actually receive payments during this period, with the average leaseholder receiving $7,500 per month. These royalty payments can be thought of as an additional treatment over the local economic shock, as some residents in fracking counties receive large, additional lump sums of money while others do not.
Table 1. Summary statistics
Methodology
Main analysis
The unexpected rise in fracturing activities coupled with spatial variation in the shale play provide a plausibly exogenous shock to local economic conditions. Using a generalized difference-in-differences framework, I compare the criminal behavior of residents in counties within the shale play to residents in counties outside the shale play, before and after the fracking boom.15I also report aggregate county-level estimates of equation 1 in Figure A.4 for comparison. Given the timing of fracking activities and subsequent changes in affected counties, I consider the effects separately in each period: leasing (2004 to 2008) and production (2008 to 2017). Formally, I estimate the effects of local economic shocks on criminal behavior using the following linear probability model:
(1) 
where criminal behavior is a binary indicator for whether a case was filed for household  in year
  .16Since the dependent variable is binary, I additionally show results using a logistic regression in Table A.3. I also show results for the intensive margin using both the number of individual cases filed and the total number of charges in a given year using the Inverse Hyperbolic Sine (IHS) transformation and Poisson models. Criminal behavior is also separated into the four largest crime categories: property, driving, drug and other. Household fixed effects,
  , account for any static differences in the propensity to commit crime across households. Year fixed effects,
  , control for factors that affect criminal behavior of all households in a given year, such as the Great Recession.
  and
and  and
and  , measure the difference in criminal behavior of residents in fracking counties relative to residents in non-fracking counties in each of the treatment periods.
The assumption behind this approach is that, absent hydraulic fracturing activities, residents’ criminal behavior in fracking counties would have changed similarly over time with residents’ criminal behavior in non-fracking counties. I check this assumption in several ways. First, I provide visual evidence that treated and control counties are tracking prior to any treatment. Relatedly, I formally test for pre-divergence using the above regression model with an indicator for the treated group one year before treatment. Additionally, I allow counties to trend differently over time by including county-specific linear time trends. I also include interactions between pre-treatment controls and year effects. In doing this, I allow for counties with different levels of observable characteristics, such as per capita income, to respond differentially to year-to-year shocks.
In all models, robust standard errors are clustered at the county level, allowing errors to be correlated within a county over time. I also report permutation-based inference for the primary specification when considering all crime, similar in spirit to Abadie, Diamond and Hainmueller (2010) for inference when using the synthetic control method. To do this, I randomly assign treatment to 17 counties and compare the estimated coefficient to 1000 placebo estimates to compute two-sided p-values. In addition, I report Adjusted False Discovery Rate (FDR) Q-values when estimating effects separately by crime type (property, driving, drug, and other) following Anderson (2008). Adjusted FDR Q-values correct for the increased likelihood of rejecting the null hypothesis when making multiple comparisons, and are interpreted similar to p-values.
Given that some counties experience larger shocks than others, detected effects could be driven solely by counties with more extreme local shocks. However, it is beneficial to know if smaller economic shocks also affect criminal behavior. Therefore, I also consider heterogeneous effects by the amount of fracking activity experienced by a county. Specifically, I estimate the treatment effect for the four major oil and gas producing counties as defined by the Labor Market Information Center, namely Dunn, McKenzie, Mountrail, and Williams, separate from the effect in the thirteen minor fracking counties.
Effects by leaseholder status
Finally, I examine the potentially differential effects of fracking on leaseholders and non-leaseholders. As previously discussed, some households receive large sums of money in the form of royalty payments while others do not. This creates the potential for increased crime due to changes in both income inequality and criminal opportunities. I consider leaseholders and non-leaseholders within fracking counties as separate treated groups, comparing each of them to residents in non-fracking counties. To the extent that signing or not signing a lease and receiving royalty payments is also a form of treatment, this strategy separates the effect on the two groups living in fracking areas. Formally, I estimate the following regression model:
(2) 
where variables are defined as in equation 1. Now,  and
and  measure the change in criminal activity by leaseholders in fracking counties compared to residents in non-fracking counties during fracking activities. They capture both the effect of job opportunities and the additional income received by leaseholders in the form of royalty payments. Similarly,
  and
and  measure changes in criminal activity by non-leaseholders in fracking counties to residents in non-fracking counties. Alternatively, they capture the effect of higher wages and job opportunities, along with any potential effect of not receiving royalty payments for non-leaseholders. As in the previous models, equation 2 is estimated using two mutually exclusive periods: leasing starting in 2004 and production beginning in 2008. Notably, leaseholders receive a small signing bonus upfront, with royalty payments closely following production.
Results
Main Results
I begin by estimating the overall effect of local economic shocks on crimes committed by residents. As noted above, I consider only the population of residents prior to the fracking boom in North Dakota. In doing so, I am able to exclude all crimes committed in the county by new workers who migrated to the relatively stronger labor markets. In this way, I can distinguish the effect of the economic shock from the impact of the changing demographics on overall crime rates.
First, I graph the estimated divergence over time in crimes committed by residents in fracking and non-fracking counties, relative to the difference between the two sets of counties in 2000 and 2001. Figure 4 plots the dynamic difference-in-differences estimates for all crimes, controlling for household and year fixed effects. Importantly, there is no evidence of divergence prior to the start of the fracking boom in 2004. This supports the identifying assumption that absent hydraulic fracturing activities, residents in fracking counties would have experienced similar changes in criminal behavior as residents not in fracking counties. Additionally, the figure indicates that the probability of being charged with a crime falls in fracking counties when leasing starts, then rises some during the production process. This suggests economic opportunity is reducing crime, but the effect seems to be offset at least somewhat by the indirect effects that accompany oil production. For example, the production period also includes interactions with new workers and increases in disposable income from royalty payments or high-paying drilling jobs. I report the average treatment effects for each period in Table 2.
Figure 4. Dynamic difference-in-difference estimates of the effect of fracking on crime
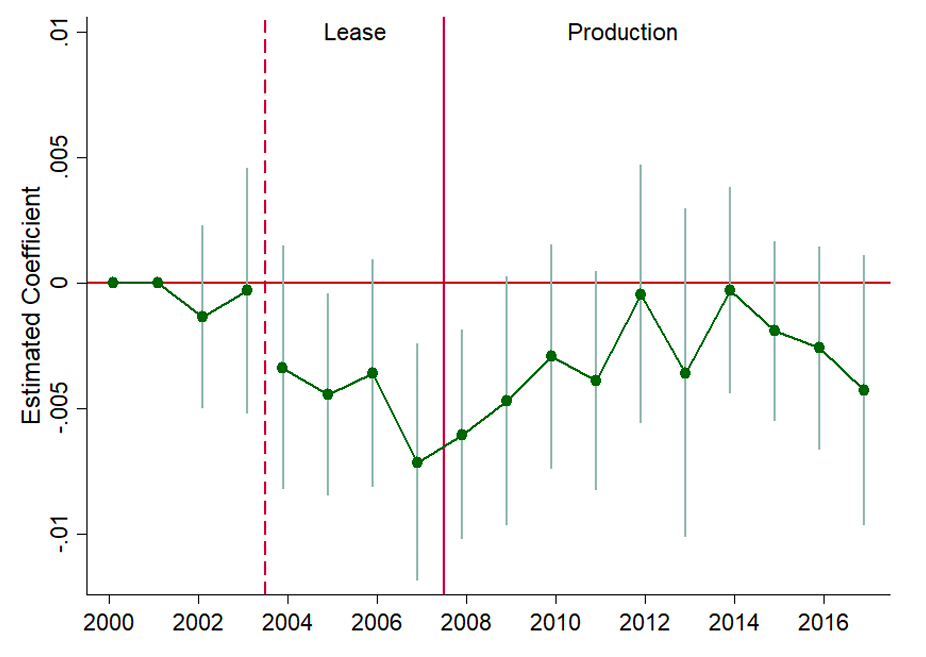
Notes: Dynamic difference-in-differences estimates from equation 1. Standard errors are clustered at the county-level and 95% confidence intervals are shown. Data are from the State of North Dakota Judicial Branch from 2000–2017.
Table 2. Estimates of the effect of fracking on crime
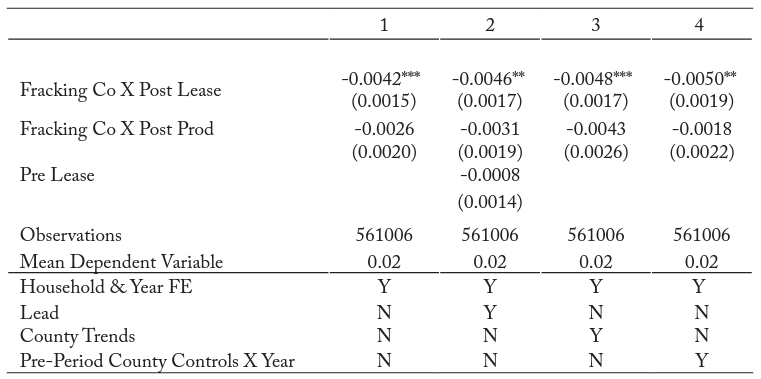
Notes: *, **, and *** indicate statistical significance at the 10%, 5%, and 1% level, respectively. Standard errors are in parentheses and clustered at the county level. County controls include per capita income, total jobs, population, total officers, and production in 2000. Data are from the State of North Dakota Judicial Branch from 2000–2017.
Starting with the leasing period, Column 1 indicates an initial drop of 0.42 percentage points in overall crime by residents in fracking counties relative to residents in non-fracking counties. This translates to a 22% drop in cases filed and is statistically significant at the 1% level. Moreover, the permutation-based p-value is less that 1%, with 4 out of 1,000 placebo estimates less than -0.0042, shown graphically in Figure A.5. In Column 2, I formally test for pre-divergence and find no evidence of it, with the coefficient on the lead indicator being close to zero, -0.0008, and statistically insignificant. In Column 3, I allow for county-specific linear trends. This allows for both observable and unobservable county characteristics to change linearly over time. If results are driven by fracking counties being on a different path than non-fracking areas, then adding a county-specific linear trend should absorb the treatment effect. However, results indicate the coefficient increases slightly to -0.48 percentage points. Finally, counties with different baseline populations, total jobs, police officers, per capita income, and production may respond differentially to year-to-year shocks. For example, if fracking counties also tend to be smaller in population then detected effects could be a result of small counties differentially responding to yearly shocks. In Column 4, I allow these baseline characteristics, observed in 2000, to differentially affect criminal behavior each year. The magnitude remains stable at -0.50 percentage points. Notably, all coefficients are statistically significant at the 1% level, and the estimated effect is robust to the inclusion of various controls and a lead term.
Overall, estimates in Table 2 are consistent with Figure 4 in showing that while there is a significant drop in criminality initially, the drop is somewhat diminished in the production period. Column 1 indicates a 0.26 percentage point reduction in cases filed for residents in fracking counties compared to residents in non-fracking counties, although not statistically significant at conventional levels. The permutation-based p-value is marginally significant at 10.2%, with 102 of the 1000 placebo estimates less than or equal to the estimated coefficient. Moving across Columns 2 through 4, coefficients remain negative ranging from -0.18 to -0.43 percentage points. It appears as though the reduction in criminal behavior from the boost in economic activity may be at least somewhat offset by additional effects on criminal behavior during the production period. This could be due to the effects of in-migration, such as peer effects and increased social interaction (Glaeser, Sacerdote and Scheinkman, 1996; Ludwig and Kling, 2007; Bernasco, de Graaff, Rouwendal and Steenbeek, 2017), or to an increase in the number of bars and illegal markets.17This is graphically depicted in Figure A.3 with a large increase in the average total number of liquor licenses per county in counties with major fracking activity
Given that estimates are at the household level, a potential concern is that effects are being driven by changes in household composition rather than changes in criminal behavior. For example, the results could be driven by composition if young men, a more crime-prone demographic, were more likely to move out during the leasing period and then move back during the height of the production period in fracking counties.18Importantly, even if some household members move, they would have to officially change their address for their crime to no longer be attributed to the household. I examine this concern by restricting the sample to crime committed by household members that are older than 25 years at the start of my period in January 2000. The results for the older, more stable sample are shown in Figure A.2 and Table A.2. They are the same as the results in Figure 4 and Table 2, respectively, suggesting that it is changes in criminal behavior rather than household composition that are driving this pattern of results.
To better understand the type of crime affected by local economic shocks, I present treatment effects separately for financial-related crimes (e.g. theft, criminal mischief, fraudulent checks), driving-related crimes (e.g. DUIs, reckless driving), drug-related crimes (e.g. possession), and other crimes (e.g. assault, resisting arrest, criminal conspiracy). The dynamic difference-in-differences estimates, controlling for household and year fixed effects, are plotted for each crime type in Figure 5. Notably, the figures show that residents in fracking and non-fracking counties do not diverge prior to the fracking boom in these types of crime. However, residents exposed to fracking activities change their criminal behavior relative to residents in non-fracking counties in response to the economic shock. Results show relatively large reductions in driving, drug, and other offenses in the leasing period. However, this reduction is diminished once production starts.
Figure 5. Dynamic difference-in-difference estimates of the effect of fracking on crime, by crime type
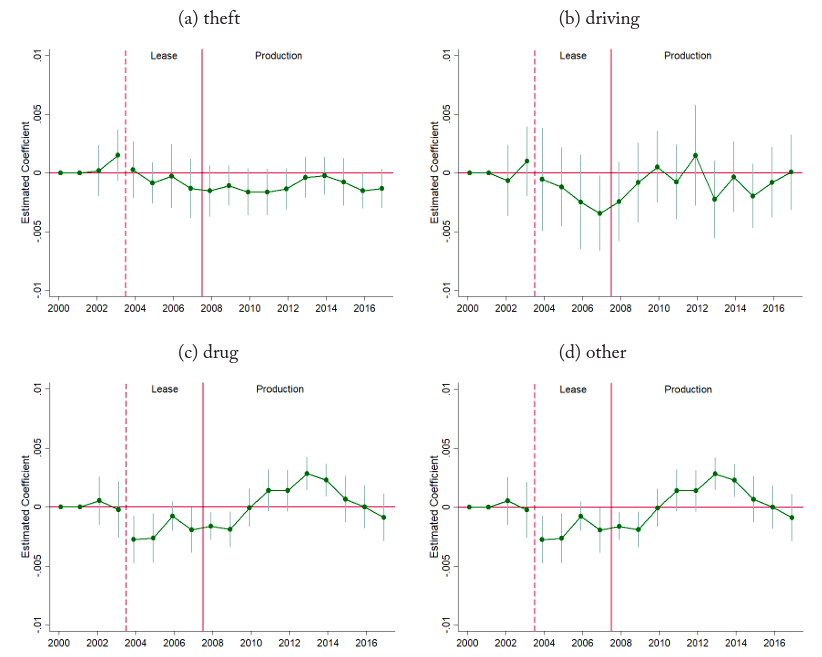
Notes: Dynamic difference-in-differences estimates from equation 1 with household and year fixed effects. Standard errors are clustered at the county-level and 95% confidence intervals are shown. Data are from the State of North Dakota Judicial Branch from 2000–2017.
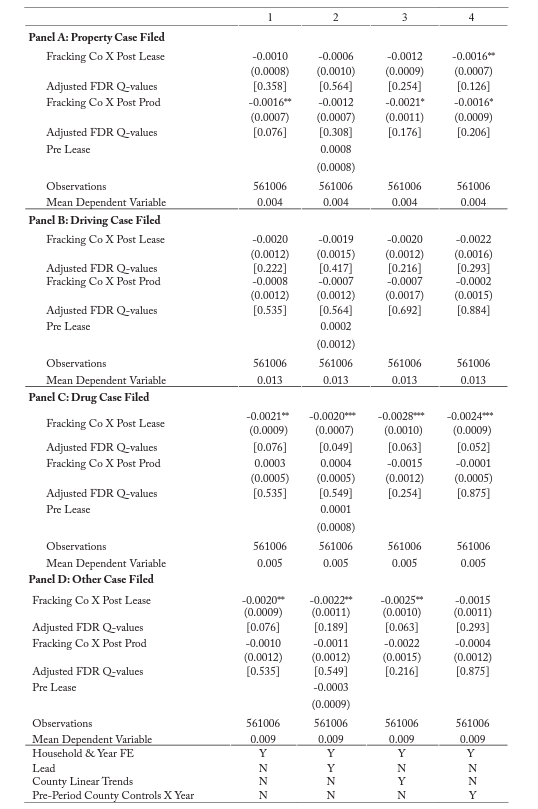
Similar to Table 2, Table 3 reports average treatment effects for each period, with panels for each crime type and adjusted FDR Q-values for statistical inference. Panel A indicates a -0.06 to -0.16 percentage point decrease in property cases filed during the leasing period, and a -0.12 to -0.21 percentage point decrease during the production period. Similarly, estimates are negative for driving-related cases during the leasing (-0.19 to -0.22 percentage points) and production period (-0.02 to -0.08 percentage points). Panel C shows a decrease in drug cases filed of -0.20 to -0.28 percentage points during the leasing period, and a reduction of 0.04 to -0.15 percentage points during the production period. Finally, all other crimes have a similar negative effect during the leasing period ranging from -0.15 to -0.25, with a smaller effect once production begins ranging from -0.04 to -0.22 percentage points. All coefficients are fairly robust to the inclusion of controls and a lead term.
Table 3. Estimates of the effect of fracking on crime, by crime type
Notes: *, **, and *** indicate statistical significance at the 10%, 5%, and 1% level, respectively. Standard errors are in parentheses and clustered at the county level. County controls include per capita income, total jobs, population, total officers, and production in 2000. Data are from the State of North Dakota Judicial Branch from 2000–2017.
Because I consider four types of crime, I also report statistical significance of these estimates using the Adjusted False Discovery Rate Q-values proposed in Anderson (2008). These values correct for the increased chance of rejecting the null hypothesis when making multiple comparisons for two treatments across four groups (eight categories). The negative effects on driving and property cases are generally not statistically significant once corrected for multiple comparisons. However, the effect on drug cases filed during the leasing period is sufficiently large across all specifications in Column 1 through 4 as to not have occurred by chance with Q-values of 0.076, 0.049, 0.063, and 0.052, respectively. There is no statistical effect on drug cases during the production period. The effect on all other cases is less robust with two of the four Adjusted FDR Q-values less than 0.10 during the leasing period, again with no estimated effect once production began.
For comparison, I also report the effect of hydraulic fracturing activities on aggregate changes in cases filed per 1000 persons. Figure A.4 plots the dynamic coefficients from the county level model of equation 1, with county and year fixed effects, for all cases and by case type. Again, counties do not diverge prior to fracking activities. However, estimates indicate increases in total cases filed, as well as drug, driving, assault, and all other cases during the fracking periods, specifically during production, which is consistent with prior literature.
Finally, I test whether the migrants entering the fracking counties were committing crimes at higher rates than the native population. This enables me to speak directly to a question of interest in the immigration literature of whether those moving into an area are more criminogenic in general. I measure the propensity to commit crime for a subset of those moving into the county. Specifically, I calculate the crime rate using the number of cases filed with an out-of-state address over the number of migrant tax exemptions filed in the county. I do the same for all crime committed by those with an address in North Dakota and the number of non-migrant tax exemptions in the county, fixing the total as of 2000. I find that the crime rate from 2004–2015 is higher for those moving into the county at 17%, as measured by crime committed by out-of-state individuals, compared to a rate of 7% for in-state individuals.19This can be thought of as a conservative estimate. First, the crime rate for people moving into the county only considers crime from out-of-state individuals, even though there is some in-migration to fracking counties from other areas in North Dakota. This also means that any additional crimes committed by those that move into the county from within the state are being considered as crimes committed by non-migrants for this exercise. Second, migrant and non-migrant tax exemptions are based on whether there is a change in filing county and state. To be conservative, the denominator for the out-of-state crime rate is the total of all inflows from 2000 through 2015. Similarly, I fix the total number of non-migrants in each county at the total in 2000 for each year as migrants that move into the area will be counted as non-migrants in their second year residing in the county
Taken together, findings provide strong evidence of a reduction in residents’ criminal behavior during the leasing period; these effects seem to be partially reduced by other effects during the production period. While I observe reductions in all crime types, results are primarily driven by drug-related crimes. This is in contrast to the county-level results, suggesting that compositional changes play an important role in the criminal response to economic conditions. Put differently, this suggests that the aggregate increases seen are due largely to additional crimes committed by those who move into the area. In contrast, the effect of the economic opportunity itself seems to have a negative effect on crime.
Results by intensity
Results thus far have treated all counties on the shale play as receiving the same economic shock. However, some counties, particularly the four major oil and gas producing counties, experience much larger economic shocks than others. The oil production in each of these four counties was greater than the amount produced in the other 13 counties combined over this time period. To estimate the differential effect by treatment intensity, I report estimates from equation 1 separately for major and minor fracking counties in Table 4. For the leasing period, 2004 to 2008, estimates in Column 1 indicate a 0.38 percentage point decrease in cases filed by residents in counties with minor fracking activity and a 0.53 percentage point decrease in the major fracking counties, significant at the 5% and 10% level respectively. This represents a 19.5% reduction in cases filed in counties with minor fracking activity and a 27.5% reduction in the major fracking counties. The estimated effect is stable to the inclusion of a lead indicator, county specific trends, and allowing for time-shocks that vary with levels of pre-period observables. Estimates in Columns 2 to 4 range from a 0.38 to 0.43 percentage point decline in minor fracking counties and 0.57 to 0.73 in major fracking counties. All estimates are significant at conventional levels.
Table 4. Estimates of the effect of fracking on crime, by intensity
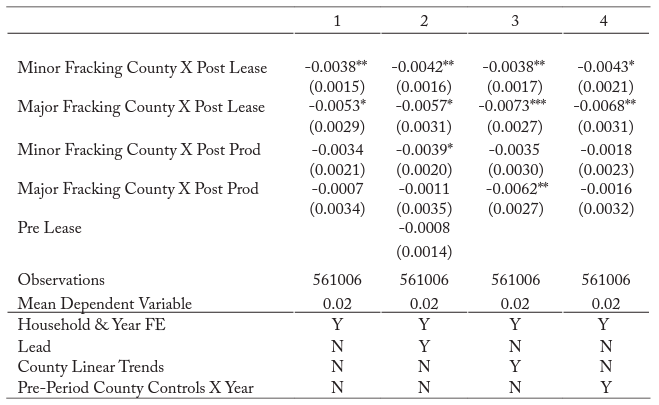
Notes: *, **, and *** indicate statistical significance at the 10%, 5%, and 1% level, respectively. Standard errors are in parentheses and clustered at the county level. County controls include per capita income, total jobs, population, total officers, and production in 2000. Data are from the State of North Dakota Judicial Branch from 2000–2017.
During the production period, estimates for minor fracking counties are similar in magnitude to the leasing period, ranging from a 0.18 to 0.39 percentage point reduction in cases filed, although the effect is only marginally significant. Estimates for major fracking counties are smaller in magnitude during the production period relative to the leasing period (-0.07 to -0.62 percentage points), and not consistently significant at conventional levels.
As expected, the effect is larger in magnitude for the major fracking counties than the minor fracking counties initially, although coefficients are not statistically different. Importantly, this demonstrates that the effect is not driven solely by the four large fracking counties, as counties experiencing more modest economic shocks also see a significant reduction in crime. Additionally, the effect seems to fade more dramatically in the major fracking counties which also experience larger population and income changes during the production period. This is consistent with the interpretation that it is the other consequences of the in-migration, such as peer effects, and income that lead to a diminished reduction in crime for residents.
Results by lease-holder status
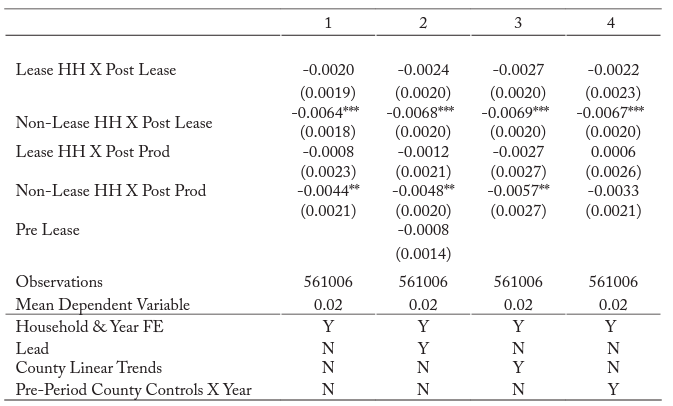
In addition to the local economic shock, some residents in fracking counties also receive a large positive income shock in the form of oil royalties during the production period. Recall that the average household that signs a lease receives over $7,500 per month from royalty payments. These payments may affect the decision to commit crime both for the leaseholder and the non-leaseholder as payments increase disposable income for illegal activities by leaseholders while increasing the income inequality and criminal opportunities for non-leaseholders. In Table 5, I estimate the extent to which the fracking activities may differentially affect residents using equation 2.
Table 5. Estimates of the effect of fracking on crime, by lease status
Notes: *, **, and *** indicate statistical significance at the 10%, 5%, and 1% level, respectively. Standard errors are in parentheses and clustered at the county level. County controls include per capita income, total jobs, population, total officers, and production in 2000. Data are from the State of North Dakota Judicial Branch from 2000–2017.
Estimates for lease-holders are mostly negative during leasing (-0.20 to -0.27 percentage points) and production (0.06 to -0.27 percentage points), although none are significant at conventional levels. Estimates for non-lease-holders range from -0.64 to -0.69 percentage points during the leasing period and are all significant at the 1% level. During the production period, estimates range from -0.33 to -0.57 for non-lease holders, with three of the four estimates significant at the 5% level. Estimates by lease-holder status are statistically different from each other at the 5% level, indicating that the overall reductions in crime shown in Table 2 are primarily driven by those who do not receive royalty payments. This suggests that it is the increase in job opportunities that reduces crime, rather than income per se. Moreover, the effect of job opportunities seems to be stronger than the effect of increased criminal opportunities.
Discussion
In summary, I find that crime decreases during the leasing period in response to improved job opportunities (0.42 percentage point reduction), and that the effect is partially reduced once drilling activities escalate throughout the production period (0.26 percentage point reduction). Effects are largest and most consistent for drug-related crimes with a decrease of 0.21 percentage points in drug-related cases filed, although estimates are negative for all other crime categories as well. Importantly, the effect is not solely driven by the four largest oil producing counties. During the leasing period, there is a 0.53 percentage point crime reduction in the four major fracking counties, as compared to a 0.38 percentage point reduction in the minor fracking counties. The effects diminish more in the major fracking counties, which suggests that other factors related to production contribute to offsetting the effect of improved labor market conditions. Additionally, I find that effects are strongest for non-leaseholders (0.64 percentage point reduction during the leasing period), and persist into the production period (0.44 percentage point reduction). This is consistent with those not receiving alternative income streams being most sensitive to the job opportunities.
One concern in interpreting the results described above is that the differences over time may be due to changes in the number of police officers. Becker (1968) and others highlight that the probability of detection factors into an individual’s decision to commit crime, which is also echoed in the lab (Harbaugh, Mocan and Visser, 2013). Moreover, empirical evidence has shown that crime decreases in response to increased police presence (di Tella, 2004; Machin and Marie, 2011). To test for changes in the police force, I estimate the main model at the county level with total police officers as the outcome of interest. Figure 6a, indicates that the change in the number of police officers was negligible during the leasing period. As a result, changes in police are unlikely to be driving the significant reduction in crime observed during the leasing period. However, changes in police are potentially part of the treatment during the production period, although this is difficult to disentangle from other factors that changed during that period. Similarly, reductions in police resources from population increases may lead to fewer reported cases filed (Vollaard and Hamed, 2012). Figure 6b shows little evidence of changes in the population from 2004 to 2008, with large increases during the more labor-intensive production period. Again, population changes are less of a concern during the leasing period, but are likely to be a part of the treatment effects after 2008 as previously discussed.
Relatedly, a concern may be that individuals identified as residents may have moved out of the county or, more importantly, the State of North Dakota during the fracking periods. This could be an issue if changes in crime are simply from not observing the criminal behavior of an individual that moved out of the state. Anecdotally, it seems improbable that residents would disproportionately move out of fracking counties as economic conditions improved. I empirically check for evidence of out-migration using the number of tax exemptions that move out of a county each year. I find no evidence of differential out-migration during the initial leasing period. I find signs of out-migration only toward the end of the production period when those who had moved into the county begin leaving as shown in Figure 7
Figure 7. Estimates of the effect of fracking on out-migration
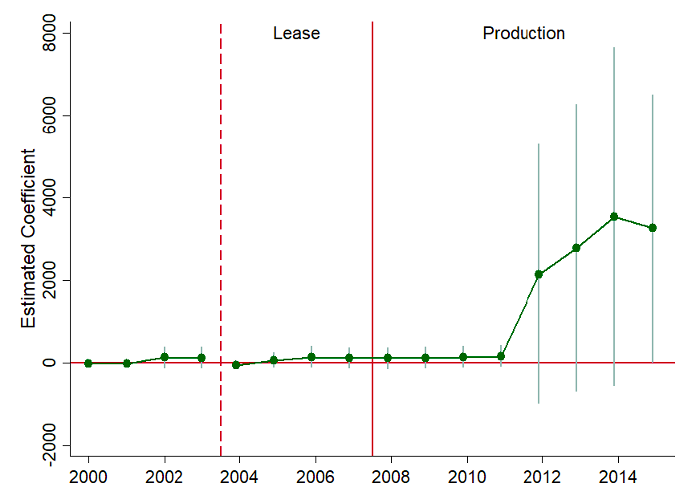
Notes: Dynamic difference-in-differences estimates from equation 1 with county and year fixed effects. Standard errors are clustered at the county-level and 95% confidence intervals are shown. Outcome is defined as total number of out-migration exemptions. An exemption is classified as a migrant if it is filed in a different county than in the previous year. The exemption would be an out-migrant for the county of filing in the previous year and an in-migrant for the county of filing in the current year. Data on all exemptions is from the Internal Revenue Service.
While I am not able to directly test for the mechanism underlying the decrease in crime from improved economic opportunities, I suggest two potential pathways. First, it is possible that decreases in crime are the result of an incapacitation effect, as individuals become occupied with legal work and thus have less time for criminal activities. This is similar to the incapacitation effect of school on juvenile crime (Jacob and Lefgren, 2003). A second explanation is that residents may no longer feel the need to engage in activities related to crime, such as drug use, given their improved economic outlook. This is consistent with work by Case and Deaton (2015; 2017) and Autor, Dorn and Gordon (forthcoming), who document an increasing number of deaths from drugs, alcohol and suicide associated with deteriorating economic conditions. This is also consistent with Becker (1968) which predicts individuals are less likely to engage in criminal activity if they have more to lose if apprehended. As a result, a more positive outlook on economic conditions, whether expected or realized, may also lower crime.
Conclusion
This paper studies the effect of local economic shocks on individuals’ decisions to commit crime. Specifically, I exploit the recent boom in hydraulic fracturing activities as a plausibly exogenous shock to local economic conditions. Using detailed administrative data on all criminal cases filed in North Dakota from 2000 to 2017, I estimate the effect of increased job opportunities on criminal behavior. An important strength of this study is that by focusing the analysis on all rural residents already living in the area prior to fracking, I can distinguish the effect of improved economic opportunity from the effect of population inflows on aggregate crime.
Results indicate that, consistent with the existing literature, aggregate crime increased in fracking counties relative to non-fracking counties. This was particularly true during the more labor-intensive fracking activities. However, local residents engage in less criminal activity at the start of the boom with a smaller effect in later years. Effects are largest and most robust for drug offenses, and are observed across all counties with fracking activity. Additionally, I show that effects are most pronounced for residents that do not also receive royalty payments. Taken together, results suggest that residents reduce their criminal activity in response to improved job opportunities, but that other changes from local economic shocks, such as peer composition, seems to offset this effect. This is consistent with economic opportunities reducing crime and highlights the role of compositional changes on the aggregate effects on crime.
References
Abadie, Alberto, Alexis Diamond, and Jens Hainmueller, “Synthetic Control Methods for Comparative Case Studies: Estimating the Effect of California’s Tobacco Control Program,” Journal of the American Statistical Association, 2010, 105 (490), 493–505.
Agan, Amanda and Michael Makowsky, “The Minimum Wage, EITC, and Criminal Recidivism,” 2018. NBER Working Paper No. 25116.
Allcott, Hunt and Daniel Keniston, “Dutch Disease or Agglomeration? The Local economic Effects of Natural Resource Booms in Modern America,” The Review of Economic Studies, 2017, 85 (2), 695–731.
Anderson, Michael L, “Multiple Inference and Gender Differences in the Effects of Early Intervention: A Reevaluation of the Abecedarian, Perry Preschool, and Early Training Projects,” Journal of the American Statistical Association, 2008, 103 (484), 1481–1495.
Andrews, Rodney J and Monica Deza, “Local Natural Resources and Crime: Evidence from Oil Price Fluctuations in Texas,” Journal of Economic Behavior & Organization, 2018, 151, 123–142.
Autor, David, David Dorn, and Hanson Gordon, “When Work Disappers: Manufacturing Decline and the Falling Marriage Market Value of Young Men,” American Economic Review: Insights, forthcoming.
Axbard, Sebastian, “Income Opportunities and Sea Piracy in Indonesia: Evidence from Satellite Data,” American Economic Journal: Applied Economics, 2016, 8 (2), 154–194.
Bartik, Alexander, Janet Currie, Michael Greenstone, and Christopher Knittel, “The Local Economic and Welfare Consequences of Hydraulic Fracturing,” 2016. NBER Working Paper No. 23060.
Becker, Gary S, “Crime and Punishment: An Economic Approach,” Journal of Political Economy, 1968, 76 (2), 169–217.
Bell, Brian, Anna Bindler, and Stephen Machin, “Crime Scars: Recessions and the Making of Career Criminals,” Review of Economics and Statistics, forthcoming. Bell, Brian, Francesco Fasani, and Stephen Machin, “Crime and Immigration: Evidence from Large Immigrant Waves,” Review of Economics and Statistics, 2013, 21 (3), 1278–1290.
Bernasco, Wim, Thomas de Graaff, Jan Rouwendal, and Wouter Steenbeek, “Social Interactions and Crime Revisited: An Investigation using Individual Offender Data in Dutch Neighborhoods,” Review of Economics and Statistics, 2017, 99 (4), 622–636.
Besley, Timothy and Anne Case, “Unnatural Experiments? Estimating the Incidence of Endogenous Policies,” The Economic Journal, 2000, 110 (467), 672–694.
Butcher, Kristin F and Anne Morrison Piehl, “Why Are Immigrants’ Incarceration Rates so Low? Evidence on Selective Immigration, Deterrence, and Deportation,” 2007. NBER Working Paper No. 13229.
Card, David and Laura Giulliano, “Peer Effects and Multiple Equilibria in the Risky Behavior of Friends,” Review of Economics and Statistics, 2013, 95 (4), 1130–1149.
Case, Ann and Angus Deaton, “Rising Morbidity and Mortality in Midlife among White Non-Hispanic Americans in the 21st Century,” PNAS, 2015, 112 (49), 15078–15083.
Case, Ann and Angus Deaton, “Mortality and Morbidity in the 21st Century,” Brookings Papers on Economic Activity, 2017, pp. 397–476.
Chalfin, Aaron, “The Long-Run Effect of Mexican Immigration on Crime in US Cities: Evidence from Variation in Mexican Fertility Rates,” American Economic Review Papers & Proceedings, 2015, 105 (5), 220–225.
Cook, Philip, The Supply and Demand of Criminal Opportunities, Vol. 7, University of Chicago Press, 1986.
Crooks, Ed, “The US Shale Revolution,” 2015. Financial Times Accessed 1-August-2018 https://www.ft.com/content/2ded7416-e930-11e4-a71a-00144feab7de.
Department of Mineral Resources, “ND Historical Barrels of Oil Produced by County,” 2018. Accessed 17-July-2019 at https://www.dmr.nd.gov/oilgas/stats/countymot.pdf.
di Tella, Rafael, “Do Police Reduce Crime? Estimates Using the Allocation of Police Forces After a Terrorist Attack,” American Economic Review, 2004, 39 (1), 65–73.
Dix-Carneiro, Rafeal, Rodrigo Soares, and Gabriel Ulyssea, “Economic Shocks and Crime: Evidence from the Brazilian Trade Liberalization,” American Economic Journal: Applied Economics, forthcoming.
Energy Information Administration, “Hydraulic Fracturing Accounts for about Half of Current U.S. Crude Oil Production,” 2016. Accessed 17-July-2019 at https://www.eia.gov/todayinenergy/detail.php?id=25372.
Energy Information Administration, “North Dakota Crude Oil First Purchase Price,” 2018. Accessed 17-July-2019 at https://www.eia.gov/dnav/pet/hist/LeafHandler.ashx?n=pet&s=f002038__3&f=m.
Energy Information Administration, “Where Our Natural Gas Comes from – Basics,” 2018. Accessed 17-July-2019 at https://www.eia.gov/energyexplained/print.php?page=natural_gas_where.
Eren, Ozkan and Emily Owens, “Fracking, Recidivism and Crime,” 2019. Working Paper.
Evans, William N and Julie H Topoleski, “The Social and Economic Impact of Native American Casinos,” 2002. NBER Working Paper No. 9198.
Fetzer, Thiemo, “Fracking Growth,” 2014. CEP Discussion Papers dp1278.
Feyrer, James, Erin Mansur, and Bruce Sacerdote, “Geographic Dispersion of Economic Shocks: Evidence from the Fracking Revolution,” American Economic Review, 2017, 107 (4), 1313–34.
Freedman, Matthew and Emily Owens, “Your Friends and Neighbors: Localized Economics Development and Criminal Activity,” Review of Economics and Statistics, 2016, 98 (2), 233–253.
Galbiati, Roberto, Aurelie Ouss, and Arnaud Philippe, “Jobs, News and Re-offending after Incarceration,” 2018. Working Paper.
Gittings, R. Kaj and Travis Roach, “Who Really Benefits from a Resource Boom? Evidence from the Marcellus and Utica Shale Plays,” 2018. Working Paper.
Glaeser, Edward, Bruce Sacerdote, and Jose Scheinkman, “Crime and Social Interactions,” Quarterly Journal of Economics, 1996, 11 (2), 507–548.
Gould, Eric, Bruce Weinberg, and David Mustard, “Crime Rates and Local Labor Market Opportunities in the United States: 1979–1997,” Review of Economics and Statistics, 2002, 84 (1), 45–61.
Grieco, Justin, “BRAC and Crime: Examining the Effects of an Installation’s Closure on Local Crime,” 2017. Working Paper.
Grinols, Earl and David Mustard, “Casinos, Crime, and Community Costs,” Review of Economics and Statistics, 2006, 88 (1), 28–45.
Harbaugh, William T, Naci Mocan, and Michael S Visser, “Theft and Deterrence,” Journal of Labor Research, 2013, 34 (4), 389–407.
Jacob, Brian and Lars Lefgren, “Are Idle Hands the Devil’s Workshop? Incapacitation, Concentration, and Juvenile Crime,” American Economic Review, 2003, 93 (5), 1560–1577.
James, Alexander and Brock Smith, “There Will be Blood: Crime Rates in Shale-Rich US Counties,” Journal of Environmental Economics and Management, 2017, 84, 125–152.
Komarek, Timothy, “Crime and Natural Resource Booms: Evidence from Unconventional Natural Gas Production,” 2017. Working Paper.
Ludwig, Jens and Jeffrey Kling, “Is Crime Contagious?,” The Journal of Law and Economics, 2007, 50 (3), 491–518.
Machin, Stephen and Oliver Marie, “Crime and Police Resources: The Street Crime Initiative,” Journal of the European Economic Association, 2011, 9 (4), 678–701.
Maniloff, Peter and Ralph Mastromonaco, “The Local Economic Impacts of Hydraulic Fracturing and Determinants of Dutch Disease,” 2014. Colorado School of Mines, Division of Economics and Business Working Paper No.2014-08.
Mejia, Daniel and Pascual Restrepo, “Crime and Conspicuous Consumption,” Journal of Public Economics, 2016, 135, 1–14.
Miles, Thomas J and Adam B Cox, “Does Immigration Enforcement Reduce Crime? Evidence from Secure Communities,” The Journal of Law and Economics, 2014, 57 (4), 937–973.
Montolio, Daniel, “The Unintended Consequences on Crime of ‘Pennies from Heaven’,” 2018. IDB Working Paper No. IDB-WP-666.
North Dakota Department of Labor and Human Rights, “Employment Applications and Interviews: Important information for Employers & Employees,” 2018. Accessed 21-September-2018 https://www.nd.gov/labor/sites/www/files/documents/Brochures/Employment%20Applications%20%26%20Interviews%20-%20color.pdf.
Raphael, Steven and Rudolf Winter-Ebmer, “Identifying the Effect of Unemployment on Crime,” The Journal of Law and Economics, 2001, 44 (1), 259–283. Schnepel, Kevin T, “Good Jobs and Recidivism,” The Economic Journal, 2017, 128 (608), 447–469.
Spenkuch, Jörg L, “Understanding the Impact of Immigration on Crime,” American Law and Economics Review, 2013, 16 (1), 177–219.
U.S. Bureau of Economic Analysis, “Real Total Gross Domestic Product for North Dakota,” 2018. Accessed 18-September-2018 https://fred.stlouisfed.org/series/NDRGSP.
U.S. Bureau of the Census, “Median Household Income in North Dakota,” 2018. Accessed 18-September-2018 https://fred.stlouisfed.org/series/MEHOINUSNDA646N.
Vollaard, Ben and Joseph Hamed, “Why the Police have and Effect on Violent Crime After All: Evidence from the British Crime Survey,” The Journal of Law and Economics, 2012, 55 (4), 901–924.
Wang, Zhongmin and Alan Krupnick, “A Retrospective Review of Shale Gas Development in the United States: What Led to the Boom?,” Economics of Energy & Environmental Policy, 2015, 4.
Weber, Jeremy G, “A Decade of Natural Gas Development: The Makings of a Resource Curse?,” Resource and Energy Economics, 2014, 37, 168–183.
Wilson, Riley, “Moving to Economic Opportunity: The Migration Response to the Fracking Boom,” 2017. Working Paper.
Yang, Crystal, “Local Labor Markets and Criminal Recidivism,” Journal of Public Economics, 2017, 147, 16–29.