

Introduction
With nearly one-third of US jobs now requiring a government-granted license (Kleiner and Krueger 2010), it is not surprising that research has increasingly focused on the effects of licensing requirements. Occupations examined include barbers (Timmons and Thornton 2010; Hall and Pokharel 2016), radiologic technologists (Timmons and Thornton 2008), nurse practitioners (Kleiner et al. 2016), dentists (Kleiner and Kudrle 2000), security guards (Meehan 2015), and certified public accountants (Carpenter and Stephenson 2006; Jackson 2006), the topic of this paper.
The economics of occupational licensing are straightforward. Licensure may be justified as a means to ensure that providers have appropriate knowledge, skills, or experience for their jobs, thereby improving the quality of goods or services produced by the licensed occupation. On the other hand, licensing requirements such as additional education or fees may act as barriers to entry, thereby reducing the number of licensed providers and raising provider remuneration. Because licensure requirements can have both quality effects and barrier-to-entry effects, more stringent licensing requirements can be proposed out of genuine concern for quality assurance or out of cynical motives of reducing competition for incumbent providers.1For more on the possible use of licensing as a way for incumbent providers to generate monopoly rents, see Friedman (1962) and Meehan and Benson (2015).
A complete review of occupational licensing research is beyond the scope of this paper, but it is worth noting that existing research on occupational licensure and quality assurance is mixed. Leland (1979) demonstrates that minimum quality standards (licensing standards) may improve welfare in some circum- stances but notes that standards set by a profession itself will likely be too high. Papers such as Law and Kim (2005), Hotz and Xiao (2011), and Anderson et al. (2016) find that licensure enhances output quality, while papers such as Carroll and Gaston (1981), Kleiner and Kudrle (2000), and Kleiner and Todd (2009) find no evidence that more stringent licensure enhances quality. The evidence on licensure as a barrier to entry is less mixed. Many papers, including Kleiner and Kudrle (2000), Carpenter and Stephenson (2006), and Blair and Chung (2019), Thornton and Timmons (2013), find that more stringent licensure reduces entry, though Thornton and Timmons (2013) present mixed evidence of licensing effects on massage therapists and Law and Marks (2009) find that Progressive Era physician and teacher licensing laws did not reduce minority representation in those professions.. Farronato et al. (2020) examine both quality and provider supply simultaneously in an online market for residential services. They find that whether a provider is licensed is less important than reviews and prices, and they find that licensing is associated with higher prices and less competition.
In the occupational licensing literature, one of the most-studied occupations is certified public accounting (CPA). More than a dozen papers including Boone and Coe (2002), Allen and Woodland (2006), Carpenter and Stephenson (2006), Jackson (2006), and Jacob and Murray (2006), examine increased educational requirements for CPA licensure. Several factors likely contribute to the high level of research interest in CPA licensure. One is that CPA licensure requires passing an exam that is uniform across all 50 states. A second is that data from that exam, including the number of candidates and their pass rate, are published by the National Association of State Boards of Accountancy (NASBA), thereby making useful data readily available for analysis. A third is that educational requirements for accounting licensure vary across states. Yet another is the existence of accounting faculty members, many of whom are licensed CPAs, who do research on their profession as part of their scholarly activities at colleges and universities.
Because of ongoing changes in state educational requirements, this paper returns to the topic of CPA licensure. In recent years, many states have moved to a bifurcated regime in which aspiring CPAs must have 120 credit hours of college education to sit for the CPA exam but 150 credit hours to be licensed as a CPA. This paper uses panel data and synthetic control methods and 2006–2016 data on first-time CPA exam candidates, CPA exam pass rates, and average CPA exams scores to examine the effects of states moving to the 120/150 requirement. The results indicate that moving from 150 hours to 120 hours to sit for the exam increases the number of first-time candidates, suggesting that requiring 150 hours to sit for the exam acts as a barrier to entry. The paper finds no relationship between moving to 120/150 and first-time CPA exam candidates’ pass rates or average scores, which implies that requiring candidates to complete 150 hours before attempting the exam does not improve candidates’ performance.
Overview of the CPA Exam
CPA licensure requires passing the Uniform CPA Exam, which is written by the American Institute of Certified Public Accountants and administered by NASBA. The exam consists of four parts: Auditing and Attestation, Business Environment and Concepts (BEC), Financial Accounting and Reporting, and Regulation. The content is occasionally updated; for example, the names of sections and the time allowed to take the exam have changed over time. Likewise, all sections of the exam used to contain written communication elements, but since 2011, only BEC has a graded written communication component.
Prior to 2004, the exam was given using pencil and paper over two days. Since 2004, the exam has been administered via computer in designated testing centers. Candidates failing sections may retake those sections without losing credit for any sections they passed; however, all sections must be passed within an 18-month window following the initial passage of one or more sections, or credit for those sections is lost.
Other aspects of licensure vary by state. In 1983, Florida became the first state to increase CPA licensure requirements from a bachelor’s degree (roughly 120 credit hours at most colleges) to 150 credit hours of college education. Over the subsequent two decades, more than 30 additional states adopted the 150-hour rule. As noted by Carpenter and Stephenson (2006), requiring 150 hours for licensure could serve as a substantial barrier to becoming a CPA because it requires the equivalent of an additional year of college education. Four-year colleges typically do not provide financial aid for a fifth year, so potential CPAs would incur increased costs of entering the profession unless they are able to obtain an employer reimbursement. Moreover, earning the additional 30 hours of college credit on a full-time basis would probably entail a substantial opportunity cost from forgone earnings. Indeed, Boone and Coe (2002), Allen and Woodland (2006), Carpenter and Stephenson (2006), Jackson (2006), and Jacob and Murray (2006) all find that the increased educational requirement reduced the number of people entering the accounting profession, though the estimated magnitudes vary somewhat because of different sample periods and empirical approaches. Some of the works cited above also identified a temporary spike in candidates sitting for the CPA exam just before the 150-hour rule’s effective date since candidates who had initially attempted the exam before the increased education requirement were “grandfathered in” under the old bachelor’s degree requirement.
In a more recent paper, Barrios (2019) examines the 150-hour rule’s impact on first-time candidates, pass rates, and labor market outcomes post exam in the 1984–2014 period. This analysis finds that the 150- hour rule is associated with a 9 percent increase in the wage premium for CPAs, relative to CPAs in states that had not adopted the 150-hour rule. The 150-hour rule was also associated with a 15 percent reduction in the number of first-time test takers, but it did not have an impact on the quality of service; the latter is measured by examining detailed data of the career paths of CPAs in states with these different rules, while also comparing these career trajectories to those of accountants grandfathered into the new rule. Barrios (2019) uses data on states transitioning from a 120-hour requirement to a 150-hour requirement for both licensing and sitting for the CPA exam. The present paper examines the impact of states changing to a bi- furcated requirement, which allows students to sit for the exam at 120 credit hours and obtain the license at 150 credit hours.
The quality assurance aspects of the 150-hour requirement are less clear. Thirty hours of additional training in accounting or closely related subjects should produce accountants with more expertise. However, in some, if not all states, the additional 30 hours need not consist of much additional coursework in accounting or other related subjects (Carpenter and Stephenson 2006). The additional 30 hours need not lead to an additional degree, though many candidates choose to obtain Master of Accountancy degrees. To the extent that the additional hours do not consist of courses that are useful to CPA careers, the quality-improvement aspect of the increased educational requirement is diminished. In practice, empirical research on quality improvements associated with the 150-hour rule has examined the pass rate on the CPA exam as an indicator of candidate quality. This approach would give a clear reading on candidate quality if individual-level data were being analyzed. However, to our knowledge, all analyses of pass rates use data aggregated at the state level. Analyzing aggregated data can suggest that candidate quality increased after the 150-hour rule was implemented. However, aggregate data may also be misleading if the barrier-to-entry effect disproportionately deters would-be CPAs with a low probability of passing the exam. In other words, aggregate data on pass rates could indicate improvements in candidate quality but are also vulnerable to changes in candidate composition.2Consider a simple example. Suppose initially there are ten candidates for the CPA exam, six of whom pass, two who do not pass but come close, and two who do not pass and do not come close to passing. The pass rate is 60 percent. Now suppose the additional educational requirement is added and the two people who think they are unlikely to pass the exam decide not to obtain the additional 30 hours of education. In this case, the pass rate would increase to 75 percent even if the eight people who still take the exam are no better prepared for it after obtaining the additional 30 hours of schooling.
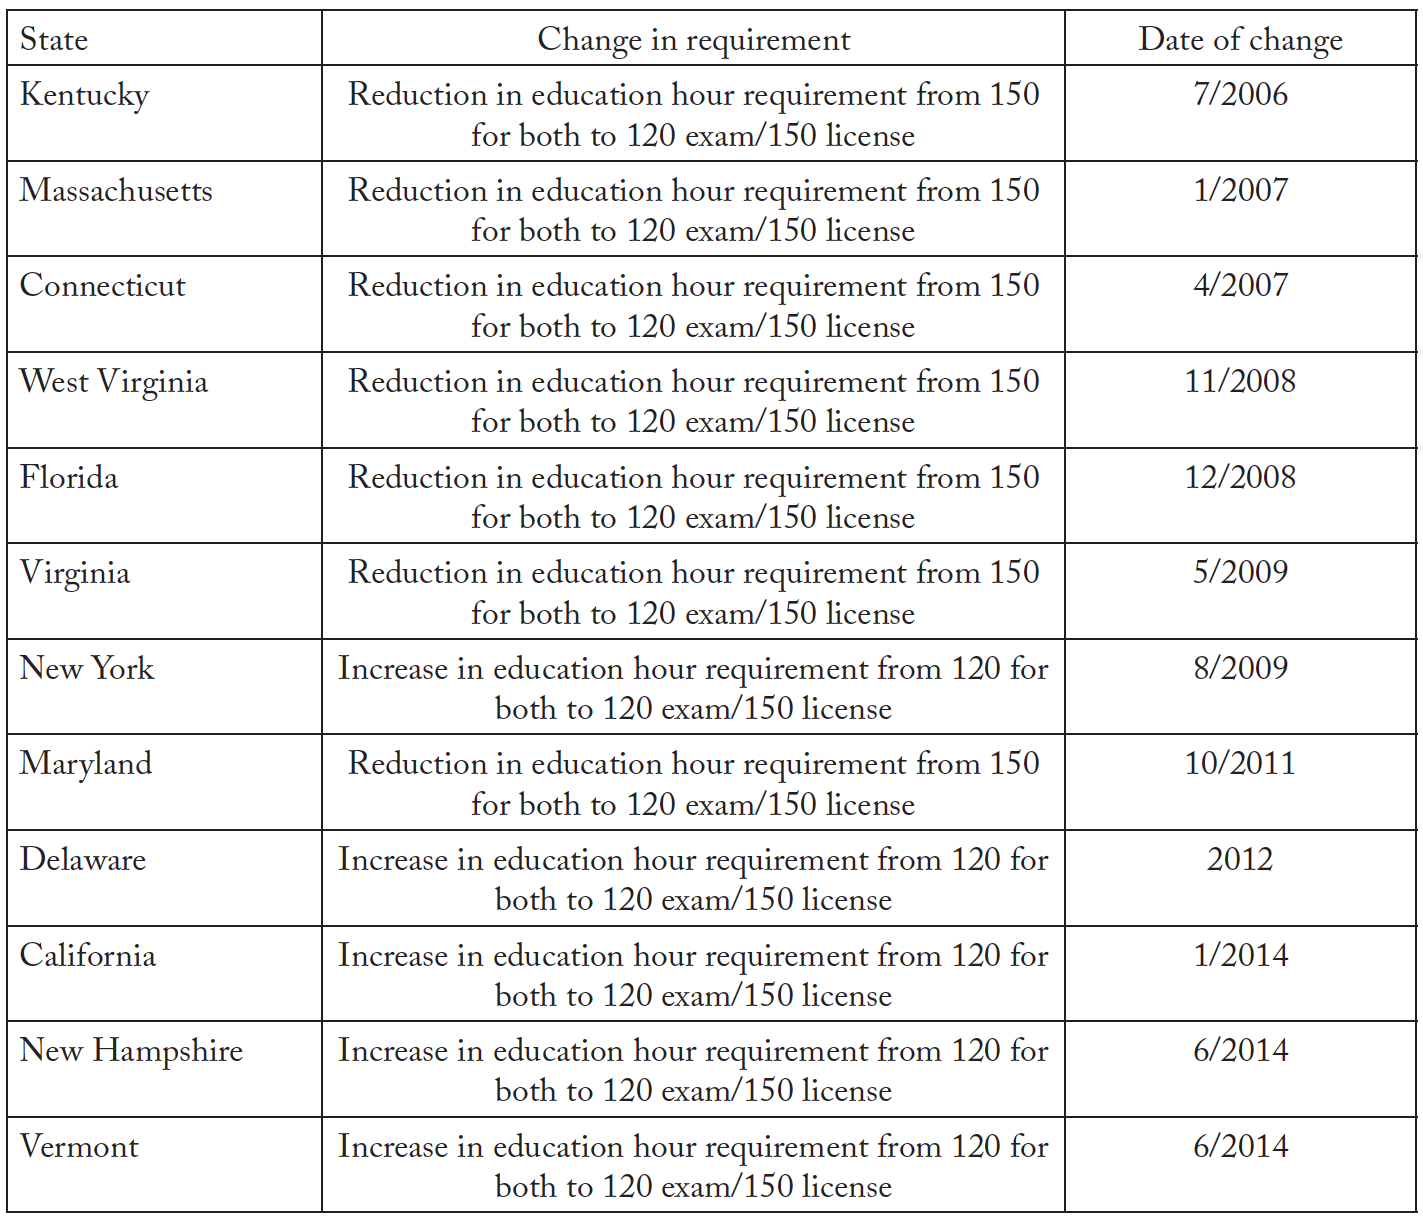
Carpenter and Stephenson (2006) examined data from 1985 to 2002, and the other papers published in 2006 studied similar, though not identical time periods. Since that time, all of the remaining states have adopted the 150-hour rule, thereby increasing their licensing requirements. However, state CPA boards became concerned about the decrease in CPA candidates following their adoption of the 150-hour rule (NASBA 2008). To reduce the impact of the 150-hour rule as a barrier to entry, many states moved to a bifurcated requirement under which 150 hours were still required for licensure, but candidates could sit for the CPA exam with just 120 hours. In recent years, therefore, some states tightened from 120/120 to 120/150 (test and license, respectively), while others relaxed from 150/150 to 120/150. This paper uses data from 2006 to 2016 to analyze the effects of these changes on the number of first-time candidates sit- ting for the CPA exam and on CPA exam scores and pass rates. Table 1 reports states that changed their educational requirements in the 2006–2016 period.3These data were collected from state-level statute and administrative codes, Jacob and Murray (2006), as well as from NASBA (2008) and WICPA (2017).
Allowing candidates to sit with only 120 hours should reduce the barrier to entry because potential CPAs can obtain a better sense of whether they will be able to pass the exam before committing to the additional 30 hours of coursework. The effect of allowing candidates to sit for the exam with only 120 hours could have ambiguous effects on the pass rate. On one hand, weaker candidates might not have been “weeded out” by the barrier-to-entry effect, thereby lowering the pass rate. On the other hand, allowing candidates to take the exam while their undergraduate accounting coursework is still recent might increase pass rates (especially if the additional 30 hours would have little accounting content).
Table 1. State Changes and Dates
Number of First-Time Candidates
We begin by examining the effect of states reducing the number of hours required to sit for the exam from 150 hours to 120 hours, using a framework similar to Carpenter and Stephenson (2006):
(1) 
 is the natural log of the number of first-time candidates sitting for the exam in state
  in year
  .4The dependent variable is specified in natural log form in order to obtain estimated coefficients that can be interpreted as percentage changes. These data are obtained from NASBA’s annual Candidate Performance on the Uniform CPA Examination reports. Table 2 reports summary statistics for the number of candidates and other variables used in the analysis. The estimation of equation (1) includes only the states that have ever reduced the credit hour requirement from 150/150 to 120/150, and states that kept a 150/150-hour requirement over the entire 2006–2016 period. This subset of the data therefore constitutes the movement in the exam sitting requirement from 150 hours to 120 hours, and a control group consisting of states that kept the exam sitting requirement at 150 hours. The licensing requirement is constant at 150 hours for all states in this subset. A few of the states in the analysis made the switch from a 150-hour requirement for both the exam and license to a 120/150 rule before the data period analyzed here (prior to 2006),5States the reduced their requirement from 150/150 to 120/150 before 2006 are: Georgia, Hawaii, Iowa, Idaho, Montana, North Carolina, New Jersey, Pennsylvania, Rohde Island, and South Carolina. See Jacob and Murray (2006) for additional details. but the rule remains constant for these states during the course of the analysis.6 These states are included in the treatment pool for the entire data period, while the states that have a straight 150/150 requirement constitute the control group. States that have a 150/150 requirement throughout the data period are: Alabama, Arkansas, Illinois, Indiana, Kansas, Louisiana, Missouri, Mississippi, North Dakota, Nebraska, Nevada, Ohio, Oklahoma, Oregon, South Dakota, Tennessee, Texas, Utah, Washington, and Wyoming. This subset of the data contains 38 states, giving a total of 418 observations.
Table 2. Summary Statistics
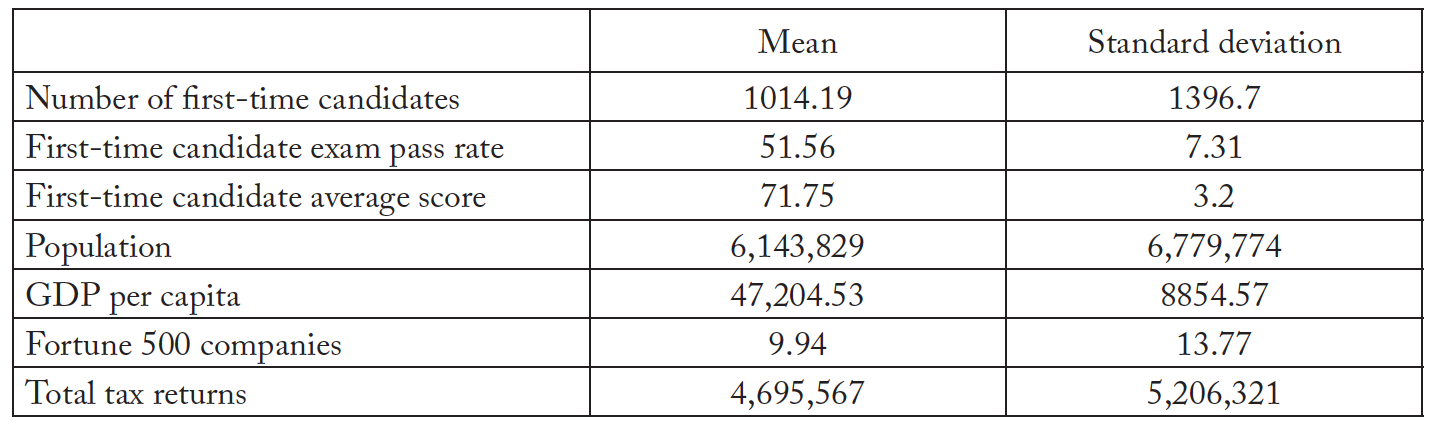
As for explanatory variables, the matrix Xit includes several variables to control for other factors that might affect the number of first-time CPA candidates in each state. These factors include (the natural log of ) population, (the natural log of ) GDP per capita, (the natural log of ) the number of tax returns filed per 100,000 population, and (the natural log of ) the number of Fortune 500 companies headquartered in each state per 100,000 population. Ceteris paribus, states with larger populations would be expected to have more CPA candidates. Similarly, states with more economic activity, larger corporate sectors, and more tax returns filed would presumably have a greater demand for CPAs, hence the inclusion of the GDP, Fortune 500, and tax return variables. The matrix Xit also includes dummy variables for a year before the reduction in the number of hours to sit and the year after the reduction of the number of hours required to sit for the exam. The rationale for including the before and after variables is that people might change the timing of their initial CPA exam sitting in anticipation of changing licensure requirements. For example, Carpenter and Stephenson (2006) found a large spike in candidates in the year before the 150-hour rule went into effect, presumably because candidates who took the exam before the higher educational requirement went into effect were “grandfathered in” under the old rules.
The model also includes two-way fixed effects. The variable  is a time fixed effect included to capture any time varying factors common across states over the course of the data period; for example, the severe financial crisis of 2008 might have affected the attractiveness of accounting careers. Similarly,
  is a vector of state fixed effects included to capture any time invariant factors causing the number of potential CPAs to vary systematically across states.
Before turning to the results, it is worth briefly discussing some of the differences between our approach and that of Soileau, Usrey, and Webb (2017), which also examines 120/150 policy changes. The main difference is that our analysis includes various measures, including state fixed effects, to control for systematic differences in the number of candidates across states. Regardless of 120/150 policy, one would expect, say, California to have more candidates than Alaska. Soileau, Usrey, and Webb (2017) do include the number of accounting degrees granted in each state in each year as a covariate; this variable might pick up some of the systematic differences across states but is likely endogenous with respect to 120/150 policy (unlike, say, population). That is, a state with the 150-hour rule might have fewer accounting graduates since the 150-hour rule might deter students from majoring in accounting.7Since California remained a 120-hour state during the 2006–2013 period covered by the Soileau, Usrey, and Webb (2017) analysis, we suspect this contributes to the very large effect—a roughly 70 percent reduction in candidates—that they find for the 150-hour rule. Since population or other state-specific controls are not included, Soileau, Usrey, and Webb (2017) likely picked up both the effect of the 150-hour rule and population differences of other states relative to California. Another important difference between our approach and Soileau, Usrey, and Webb (2017) is that our empirical framework also allows for lead and lag effects around the time of policy changes. Other differences include (1) Soileau, Usrey, and Webb’s (2017) inclusion of the average age of candidates as an explanatory variable for the number of candidates without a theoretical basis for doing so, and (2) our period, 2006–2016, covering three additional years, a period that includes three additional state policy changes. Lastly, our estimation controls for serial correlation by clustering standard errors by state whereas Soileau, Usrey, and Webb (2017) perform simple OLS estimation without correcting for possible serial correlation.
Results of estimating (1) are reported in the top portion of table 3. The first column estimates the model with the controls in Xit omitted, while the second column includes all covariates. The estimated coefficients on the reducing to 120/150 variable are large and statistically significant in both columns. Reducing the number of required hours to sit for the CPA exam increases the number of first-time candidates by about 25 percent. While this effect is large, it is less than half as large as the 60 percent decrease found by Carpenter and Stephenson (2006). Thus, as one would expect, a 120/150 regime reduces the barrier-to-entry effect relative to requiring 150 for both licensure and sitting for the CPA exam, but there may still remain a barrier to entry associated with requiring 150 hours for licensure. As for the control variables, only the population variable and Fortune 500 variable are statistically significant, and unlike Carpenter and Stephenson (2006), there is no evidence of changes in the year before or after requirement changes.
While many states stayed at 150/150 or moved from 150/150 to 120/150, some states moved from 120/120 to 120/150. Although this is a much smaller subset of the data (12 states totaling 132 observations), we now turn to analyzing the effect associated with states that tightened their requirements between 2006 and 2016. Everything in these specifications is exactly the same as the specifications reported in the top half of table 3, except that the variable of interest is a dummy variable for states that have raised their requirements for licensing from 120/120 to 120/150.
The bottom part of table 3 reports results for states that raised the requirements to sit for the CPA exam. Here the results are sensitive to the inclusion of the control variables. In the first column, the estimated effect of raising requirements is statistically significant and large: a reduction of more than one-half in the number of first-time candidates. As indicated in the second column, including the control variables in Xit reduces the estimated magnitude of the coefficient on the increasing requirements variable by about one- half, and it is no longer statistically significant.
Table 3. Analysis of First-Time Candidates
The Effect of States Moving from 150/150 to 120/150
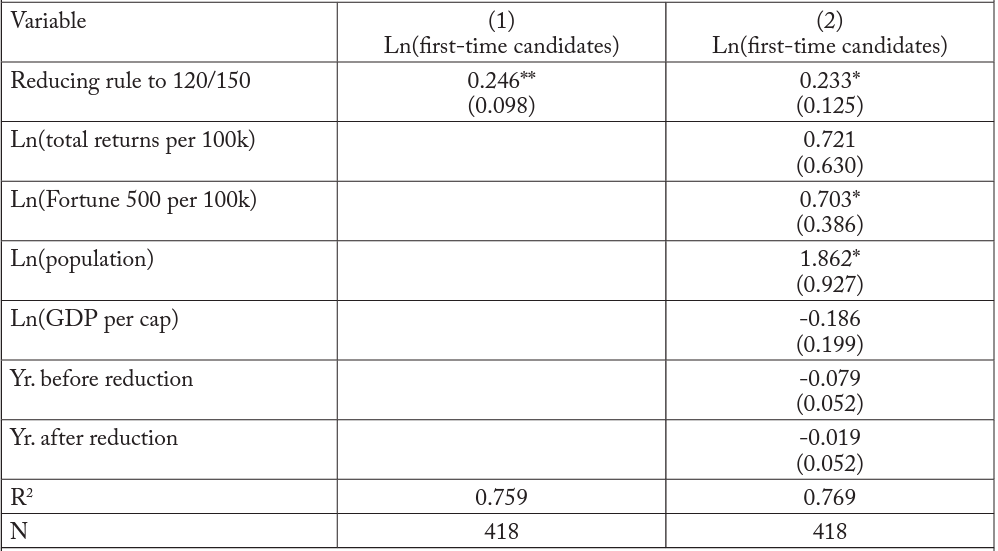
The Effect of States Moving from 120/120 to 120/150
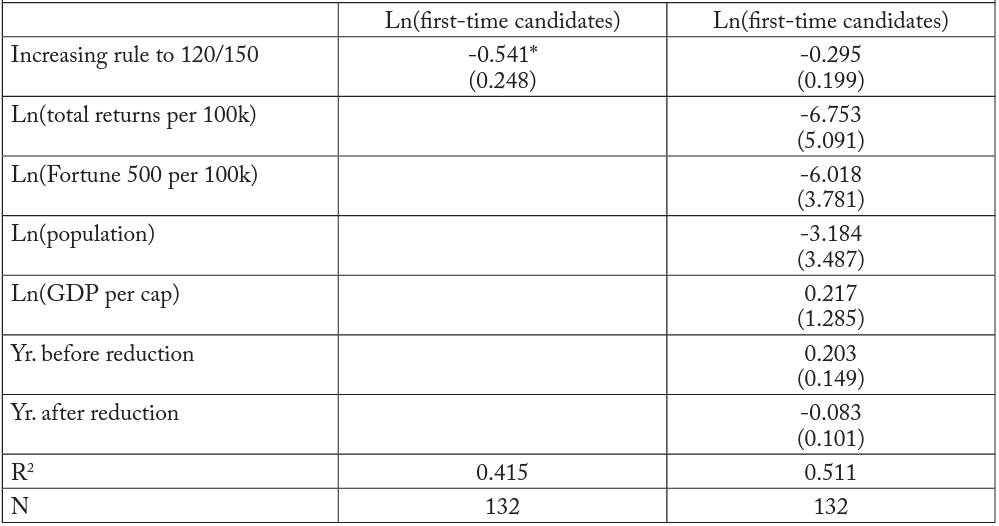
All models contain state and year fixed effects and have standard errors clustered by state.
Pass Rate and Mean Score
We now turn to the performance of first-time CPA exam candidates. As discussed earlier, CPA exam pass rates are often interpreted as an indicator of candidate quality, though the use of pass rate data aggregated at the state level potentially makes such an interpretation misleading. NASBA also reports state average scores for first-time CPA exam candidates. The mean score of first-time exam takers can also serve as an alternate indicator of candidate quality, again subject to the caveats about aggregate data discussed earlier.
To examine the effect of changing educational requirements on candidate performance, we estimate the following models:
(2) 
(3) 
In both models, performance is either the pass rate of first-time candidates or the average score of first- time candidates. The models include state and year fixed effects and are otherwise similar to the analysis presented in table 3, except that the matrix of control variables Xit is omitted because there is no a priori basis for expecting those control variables to be related to candidate performance.8Although the theoretical basis for including Xit in (2) or (3) is weak, we estimated the models with Xit included. The results were nearly identical to those reported below and are available upon request.
Estimation results for all four models are presented in table 4. The top half of the table contains the estimated effects of reducing requirements to sit for the CPA exam, while the bottom half of the table contains estimated effects of increasing requirements. The left-hand column shows results with the pass rate as the measure of candidate performance; the right-hand column contains results with the average score as the measure of candidate performance. In all four cases, the results indicate the relationship between candidate performance is small and not statistically significant.
Table 4. Analysis of Candidate Performance
The Effect of States moving from 150/150 to 120/150
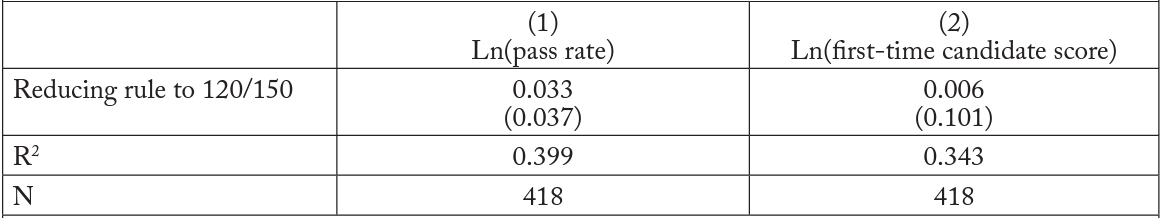
The Effect of States Moving from 120/120 to 120/150
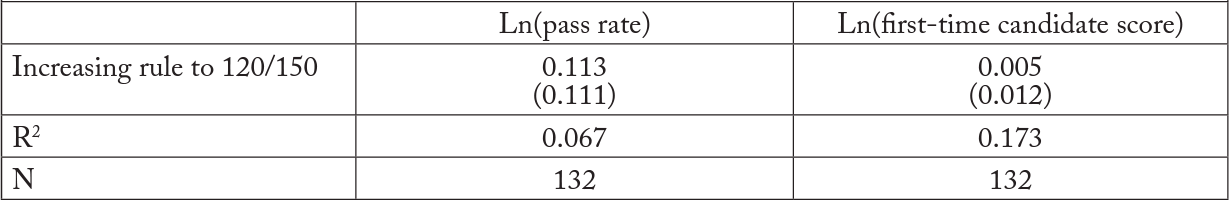
All models contain state and year fixed effects and have standard errors clustered by state.
Synthetic Control Case Studies
In order to provide additional insight into the impact of these CPA licensing changes over time, we also use a synthetic control model (Abadie, Diamond, and Hainmueller 2010) to view the impact of these changes in individual states. Synthetic control empirical methods provide a mechanism for analyzing comparative case studies. In this case, we analyze individual states that have adopted changes in the accounting education requirements and compare the outcomes to states that did not change these requirements. The 38 states that did not change their CPA education requirements over the 2006–2016 period constitute the donor pool. From this donor pool, synthetic results are constructed that form a counter-factual to the number of candidates and pass rates in each state, absent the CPA education requirement policy change. We conducted this synthetic control analysis for each state that had a policy change over our data period and had at least three years of pre-treatment data.9The estimation was performed for New York and California, but optimization procedures did not produce synthetic results for these states.
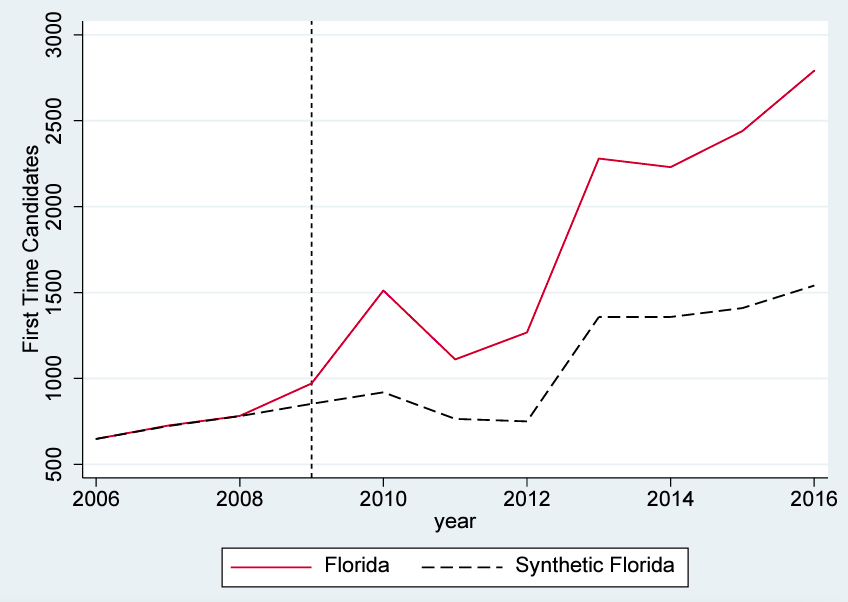
The synthetic control results in figure 1 are for Florida, which looks to be the best candidate for this synthetic control analysis, given how well the model predicts the number of candidates, pre-rule-change, in 2008 (first year implemented 2009). These figure 1 results suggest a clear divergence between the predicted number of candidates over this time (labeled Synthetic Florida, dashed line) and what actually happened (solid red line). This divergence suggests that the number of candidates is consistently larger than if the education requirement had not been reduced, and this pattern becomes more prevalent over the course of the data period. Although the pre-treatment fit is good, these results should be interpreted with caution as there are only three pre-treatment periods on which to base post-treatment synthetic predictions.10The same is true of Virginia; those results appear in the appendix.
Table 1. Synthetic Control Model of Florida Reducing CPA Exam Requirements from 150 to 120 Credit Hours on the Number of First-Time Candidates
As suggested in Abadie, Diamond, and Hainmueller (2010), we also perform a placebo test for the synthetic control estimation to examine the robustness of these findings. This falsification test applies the same synthetic control estimation procedure to each of the states in the donor pool to see if the prediction gap between the synthetic estimation and the actual treated outcome is larger than the prediction gap in all 38 other states in the donor pool. The trend line for Florida in figure 1.1 suggests that this gap is positive and larger than the vast majority of states within the donor pool (light grey lines), and this gap persists and even increases as the post-treatment period progresses. Based on the graph of this placebo test, it appears that no state within the donor pool has such a large and persistent gap between the predicted (synthetic) results and the actual outcome. Some states do have larger spikes for single or a few years during the period, but these gaps are very noisy, which indicates that these states may be considered outliers. The vast majority of these prediction gaps are smaller in magnitude than the Florida results, and none are as persistent.
Abadie, Diamond, and Hainmueller (2010, 2015) advise using the placebo test to construct p values for the synthetic control results, so these are also included for the Florida CPA candidate estimation. These values, displayed in the right-hand panel of figure 1.1, indicate that it would be unlikely that these impacts are occurring strictly by chance for each post-treatment period examined. Taken together, the p-value analysis, the placebo test, and the pre-treatment fit for the data suggest that Florida is the best candidate for the synthetic control analysis among the states that had a change in policy throughout this period. We include the same analysis for New Hampshire because of an interesting pre-treatment bump in candidates and post-treatment drop in candidates. The states for which we could obtain synthetic control results and which had at least three years of pre-treatment data are included in the appendix. We include both the placebo tests and the synthetic estimates for each of these states. Further, for both Florida and New Hampshire we follow Abadie, Diamond, and Hainmueller (2010) in estimating a second placebo simulation only using states that have similar (or better) fit with the pre-treatment prediction. We do this by limiting the states in the placebo sample to states with pre-treatment root mean square prediction error (RMSPE) less than or equal to the treated units (New Hampshire and Florida).11Abadie, Diamond, and Hainmueller (2010) suggest using placebo units with pre-treatment RMSPE’s anywhere from 2 to 10 times the treated unit. We elect to use pre-treatment RMSPE’s at or below Florida and New Hampshire’s. When we use even the 2x threshold, the sample of placebos does not change for New Hampshire. These limited RMSPE placebo results are available upon request for treatments contained in the appendix.
Figure 1.1. Falsification Test and Constructed P Values for Florida First-Time CPA Exam Candidates
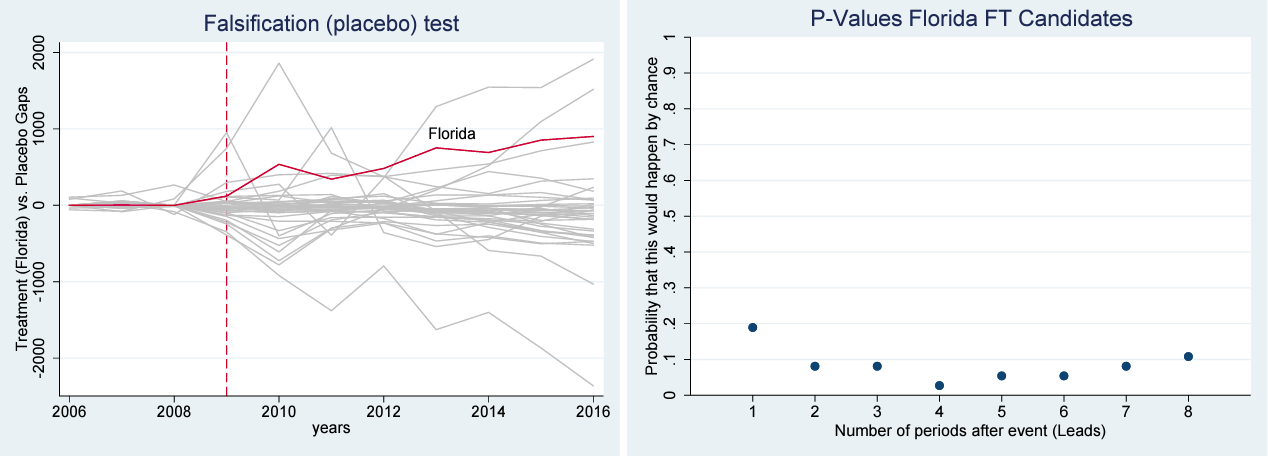
Figure 1.2. Florida Placebo Estimates Limited to States with Pre-treatment Root Mean Square Prediction Error Less than or Equal to Florida
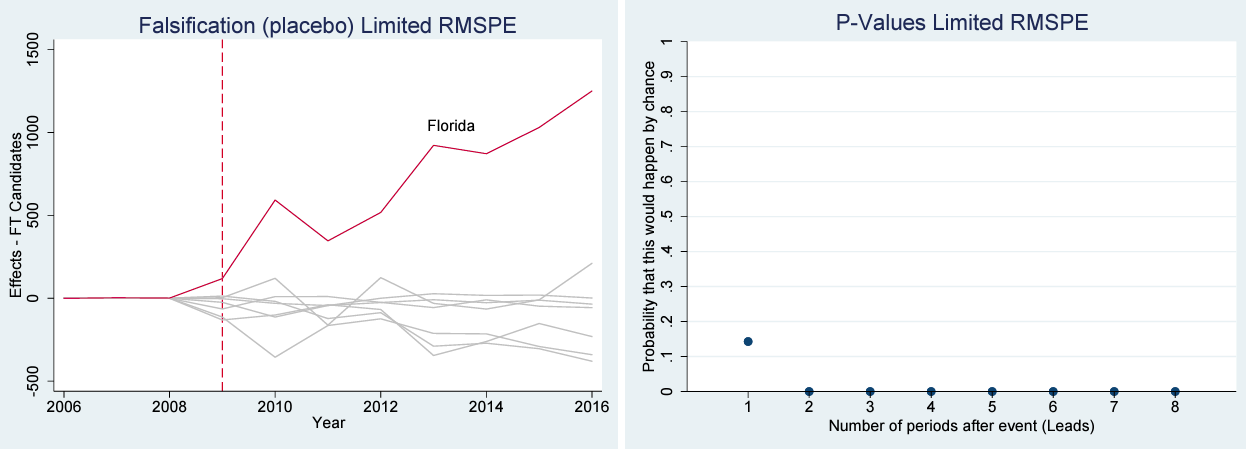
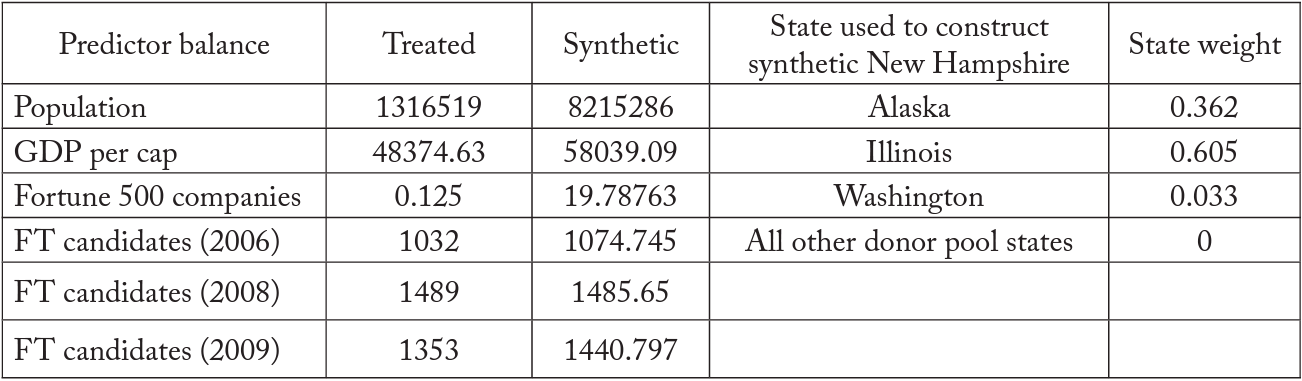
Table 5 includes the states used to construct the synthetic Florida and the estimated values of the predictors used in this estimation compared to the actual numbers in Florida.
Table 5. States Used to Construct Synthetic Florida and Predictor Balance
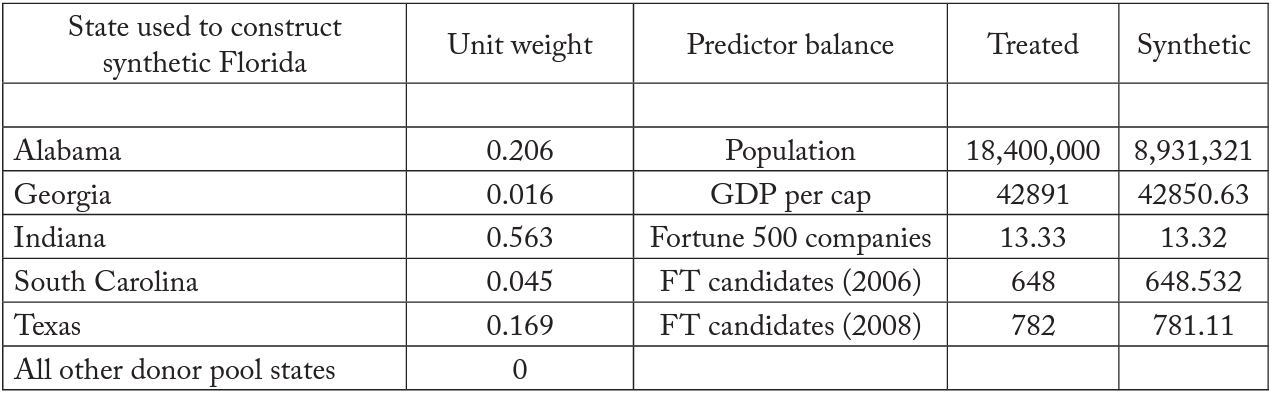
Figure 2. Synthetic Control Model of New Hampshire Increasing CPA Licensing Requirements from 120 to 150 Credit Hours on the Number of First-Time Candidates
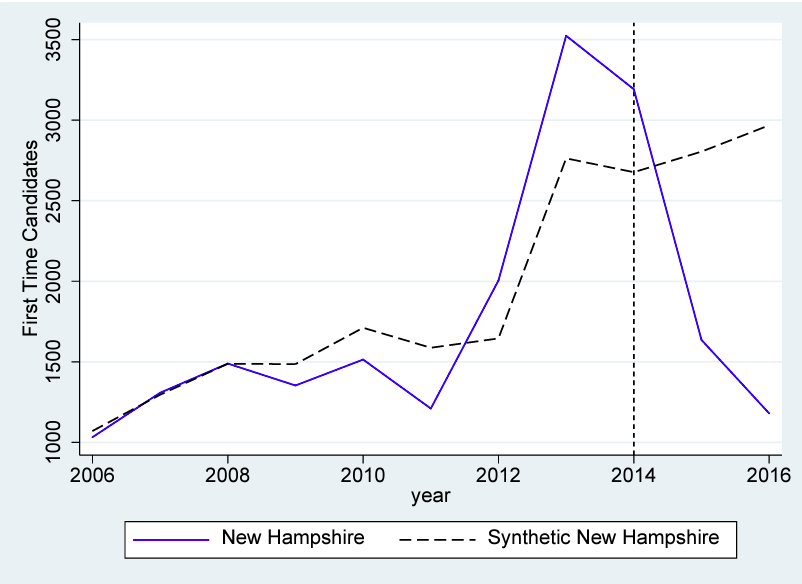
Figure 2.1. Falsification Test and Constructed P Values for New Hampshire First-Time CPA Exam Candidates
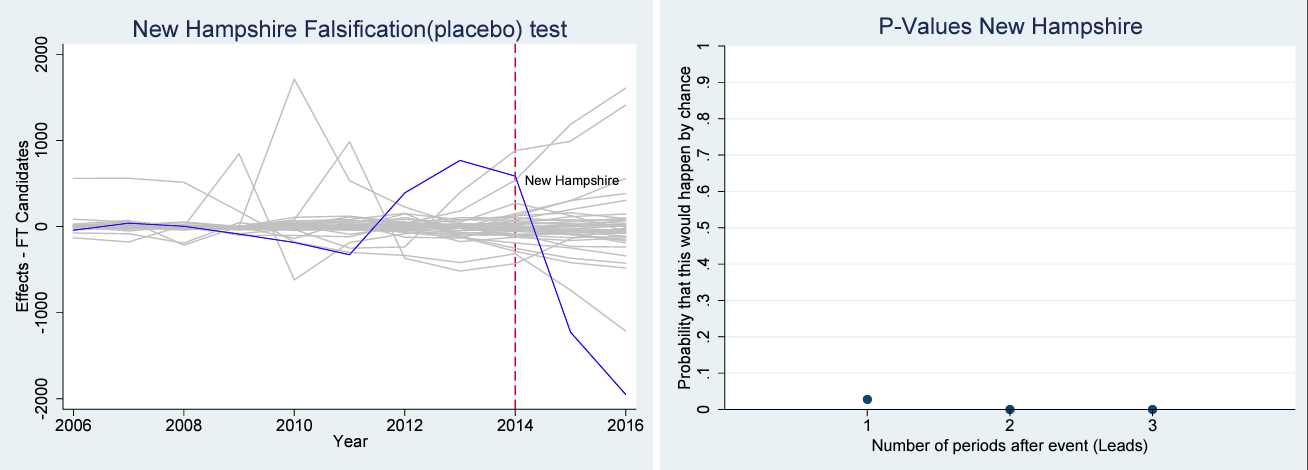
Figure 2.2. New Hampshire Placebo Estimates Limited to States with Pre-treatment Root Mean Square Prediction Error Less than or Equal to New Hampshire
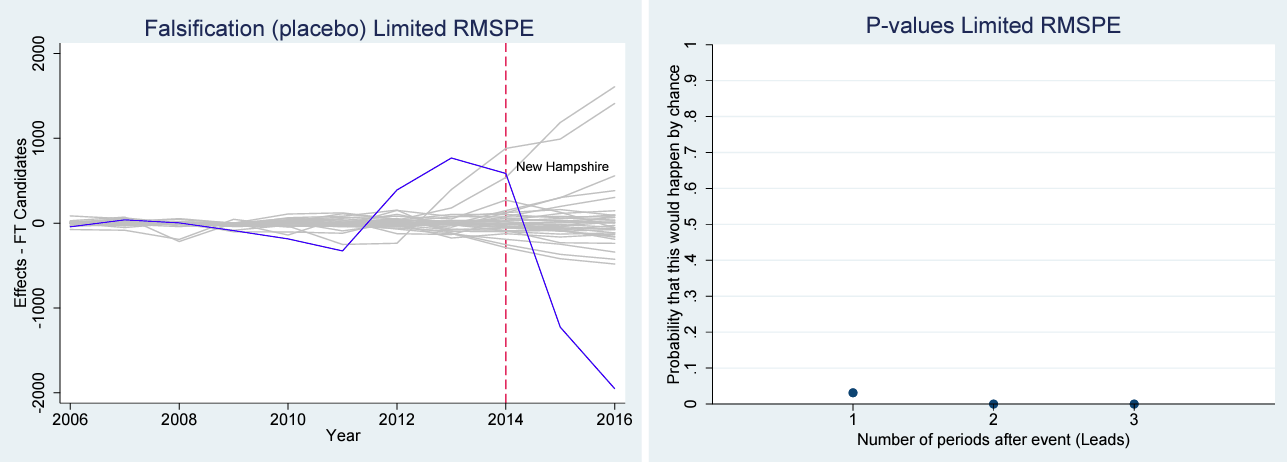
Figure 2, 2.1, and 2.2 present the results from the same synthetic control procedure applied to New Hampshire, which increased the education requirements to sit for the CPA exam in 2014. The New Hampshire pre-policy-change predictions do not coincide with the actual data as well as Florida’s do, but the reason for this could be explained by the pre-policy jump in the number of candidates before the policy takes effect. This might be the result of first-time candidates trying to be “grandfathered in” by taking the exam before the increase in education required goes into effect. Information on the policy change was publicly available years before the policy actually went into place, as the state of New Hampshire sent a revised exam and licensing requirement document to CPAs and CPA candidates dated December 8, 2011, which outlines the 2014 change and corresponds to the jump in the number of candidates (NASBA 2011). This helps to explain the observed increase in candidates just before 2012 and the drastic fall right after the policy was in place (see figure 2).
If this information is not released in all states, it might explain why this same candidate reaction is not observed in Delaware (see the appendix)—a state which had the same increase in education requirement.12The authors searched the NASBA website that contained the New Hampshire pre-policy-change announcement but could not find a similar document for Delaware. If the pre-policy-change information is only available in some states, the corresponding reactions will introduce more noise into the data, which might be why the positive coefficient for the pre-policy-change variable is not significant in table 3. Even with this surge in candidates prior to the change, the post-policy divergence between the predicted (synthetic New Hampshire) candidates and the actual first-time candidates shows a number much lower than anticipated. As the education requirement increases, it is associated with reductions in the pool of first-time candidates. Both the Florida and New Hampshire synthetic control results are consistent with the regression results in table 3 and table 4. Figure 1.2 and figure 2.2 also both show better fit and a clear divergence of the treated units from the rest of the placebo states, which supports the idea that the rule change did have an impact.
Table 6 presents the states used in the construction of the New Hampshire synthetic estimation and the values for the predictors used in this estimation. Additional synthetic control results are presented in the appendix for both pass rates and the pool of first-time candidates. Results pertaining to pass rates suggest that the policy changes had no discernable impact on pass rates, similar to the table 4 results. The appendix results should be interpreted with caution, however, as the pre-treatment fit and the placebo tests for these states do not appear to support their use in a synthetic control estimation.
Table 6. States Used to Construct Synthetic New Hampshire and Predictor Balance
Conclusion
Education requirements to obtain occupational licenses are common across the United States. Proponents argue that these requirements improve the performance and preparedness of the licensee to practice his or her occupation. The education requirements for obtaining a CPA license differ across states and over time. Over the past two decades, many states have moved to require CPA candidates to obtain 150 credit hours of education to obtain a license and sit for the CPA exam. Recently there has been a movement to split the exam requirement from the licensing requirement. Many states have adopted a 120/150 rule that allows candidates to sit for the exam with 120 credit hours completed and obtain a license after completing 150 hours. Our results suggest that this reduction in the education requirement to take the exam is associated with a roughly 25 percent increase in the number of first-time candidates attempting the exam. The results also suggest this loosening of the education requirement led to no change in exam pass rates or scores. This provides evidence that the 150-hour education requirement acts as a barrier to entry and suggests that the additional educational requirement does not enhance candidate quality, though the latter finding should be treated with caution because of potential issues arising from using aggregated data.
Appendix 1
Figure A1.1. Impact on First-Time Pass Rate of Florida Reducing Rule from 150/150 to 120/150
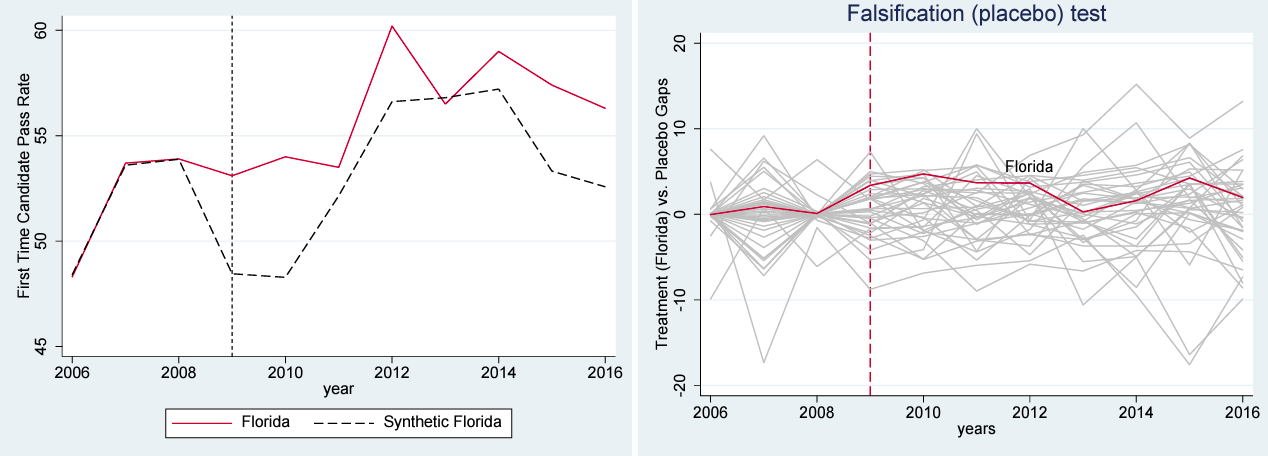
Figure A1.2. Impact on First-Time Pass Rate of Delaware Increasing Rule from 120/120 to 120/150
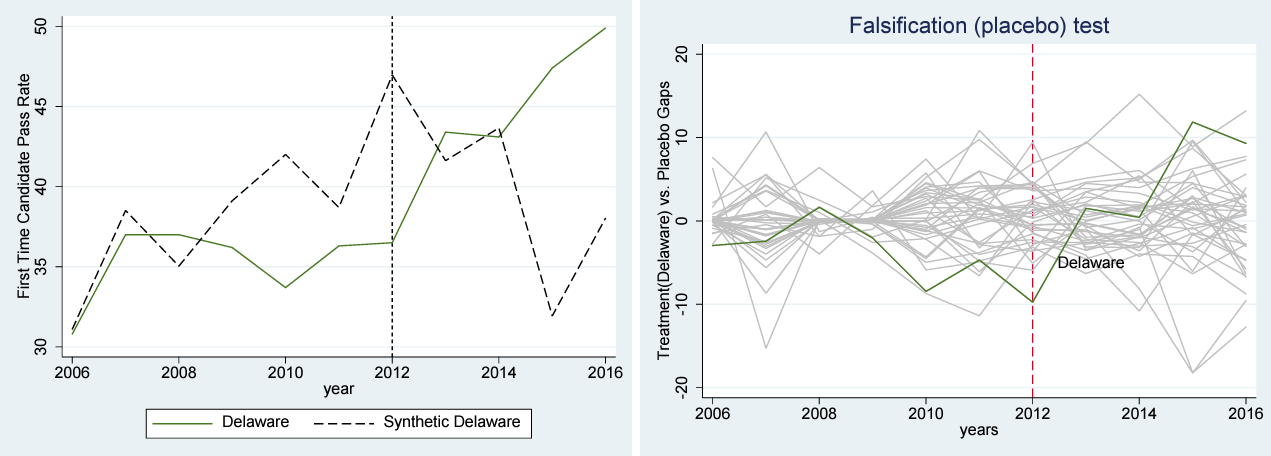
Figure A1.3. Impact on First-Time Pass Rate of Virginia Reducing Rule from 150/150 to 120/150
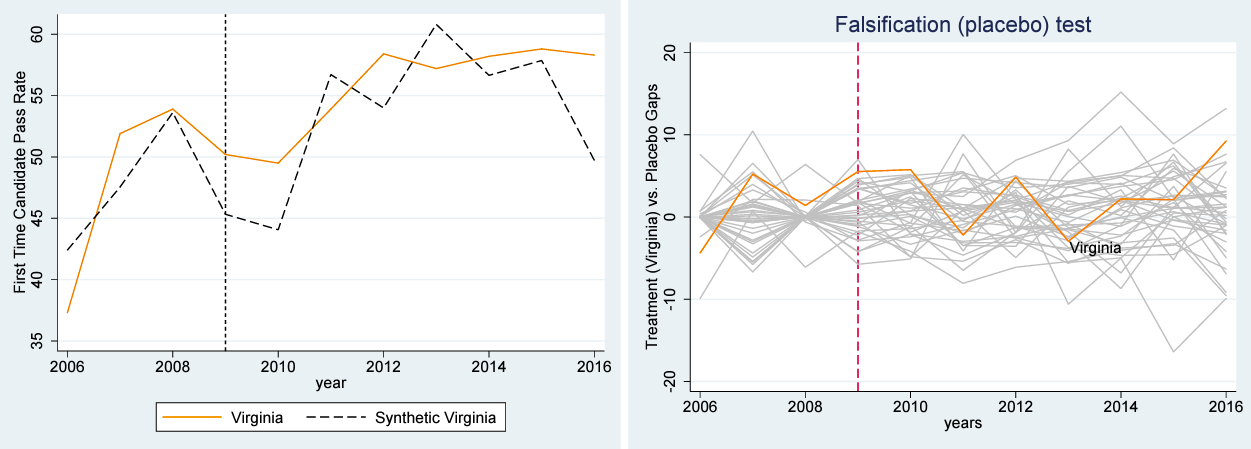
Figure A1.4. Impact on First-Time Pass Rate of New Hampshire Increasing Rule from 120/120 to 120/150
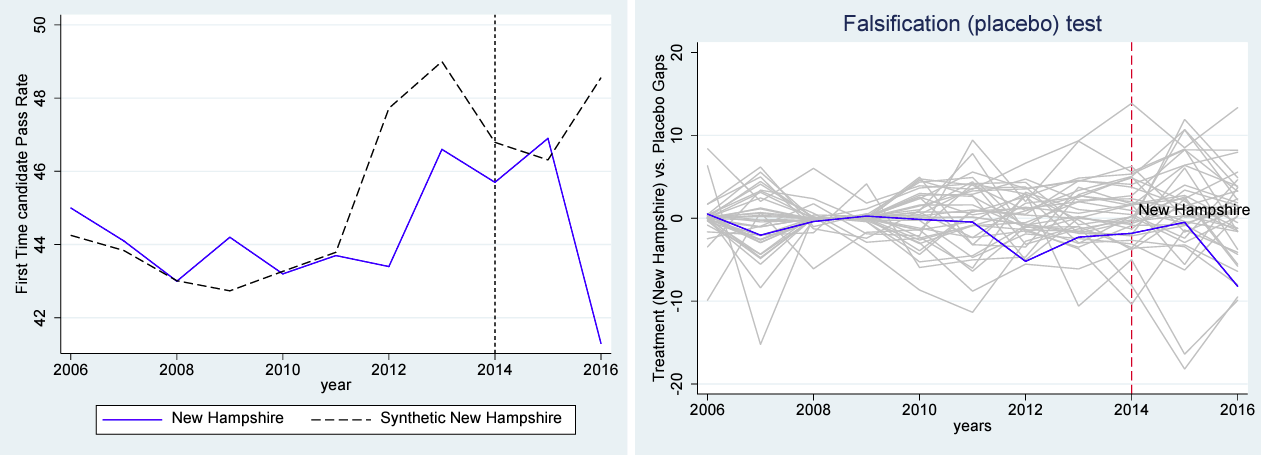
Figure A1.5. Impact on First-Time Pass Rate of Maryland Reducing Rule from 150/150 to 120/150
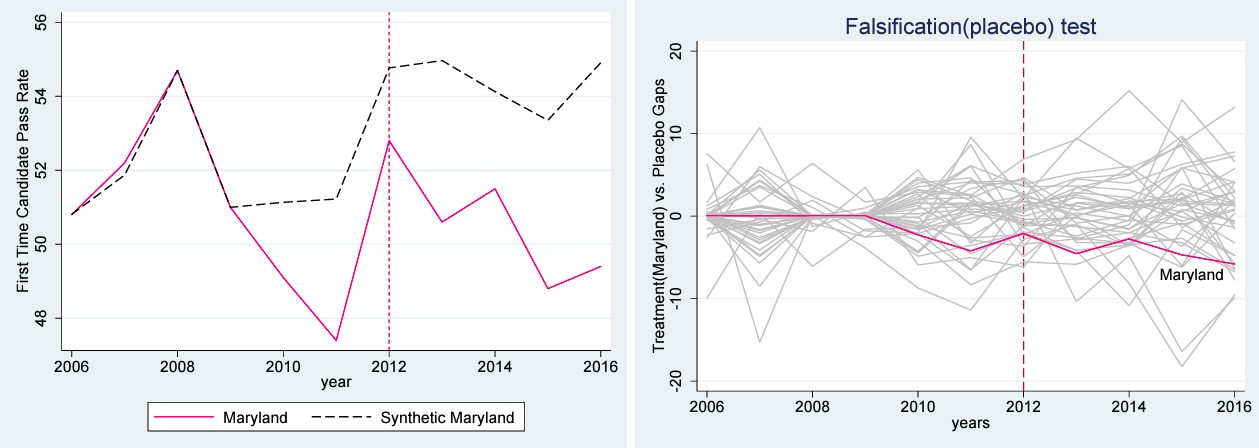
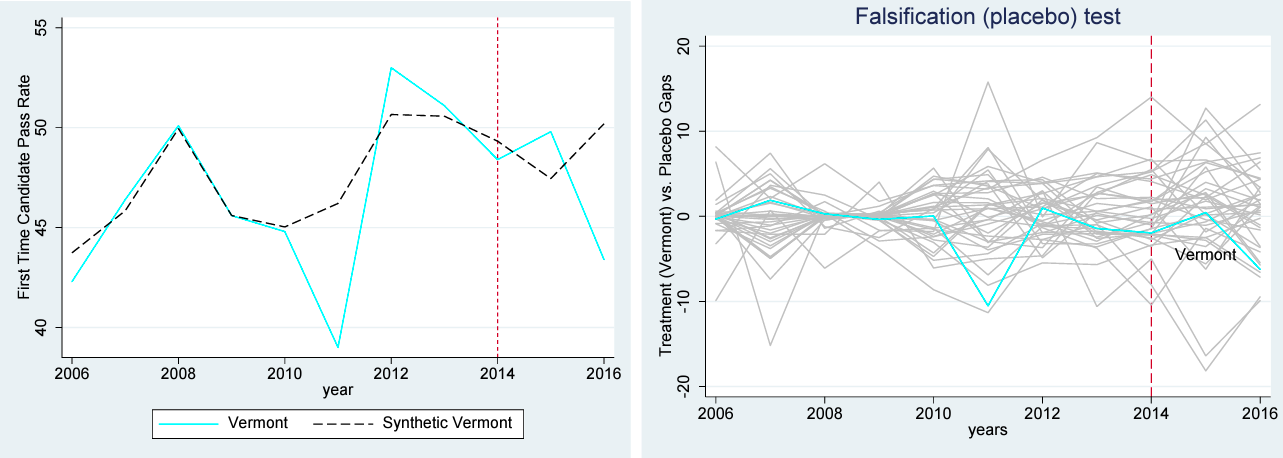
Figure A1.6. Impact on First-Time Pass Rate of Vermont Increasing Rule from 120/120 to 120/150
Appendix 2
Figure A2.1. Impact on Number of First-Time Candidates of Delaware Increasing Rule from 120/120 to 120/150
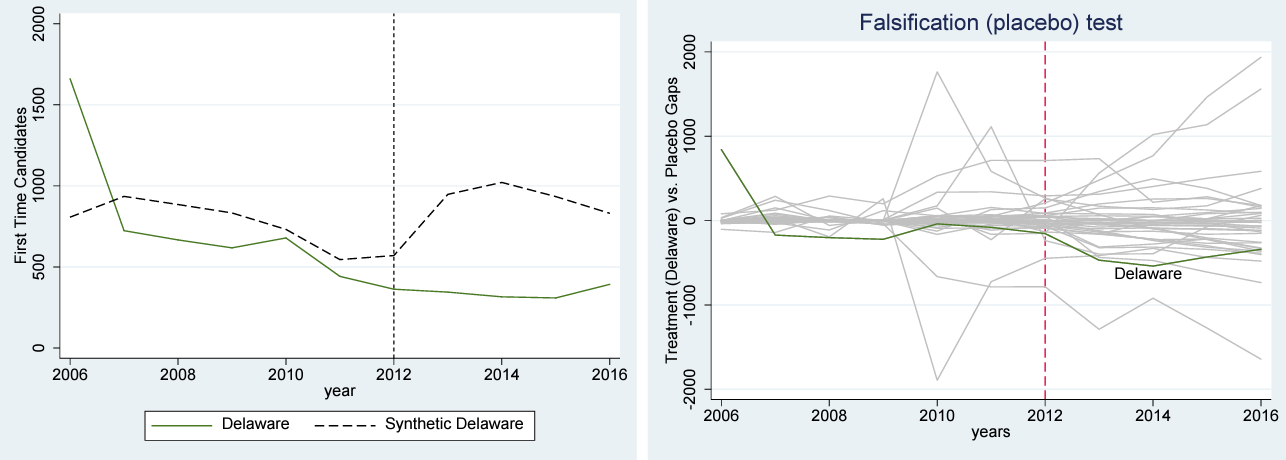
Figure A2.2. Impact on Number of First-Time Candidates of Virginia Decreasing Rule from 150/150 to 120/150
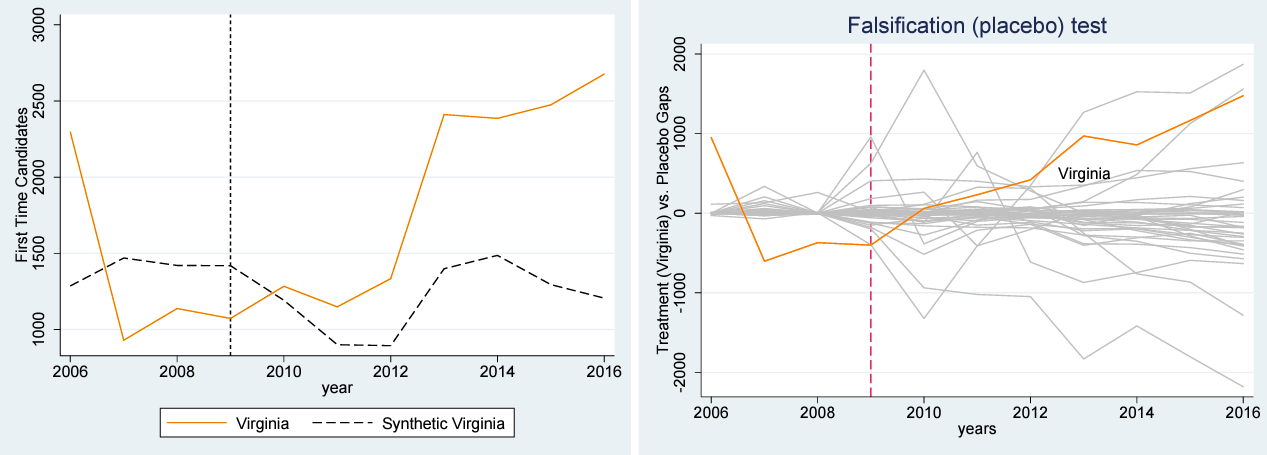
Figure A2.3. Impact on Number of First-Time Candidates of Maryland Decreasing Rule from 150/150 to 120/150
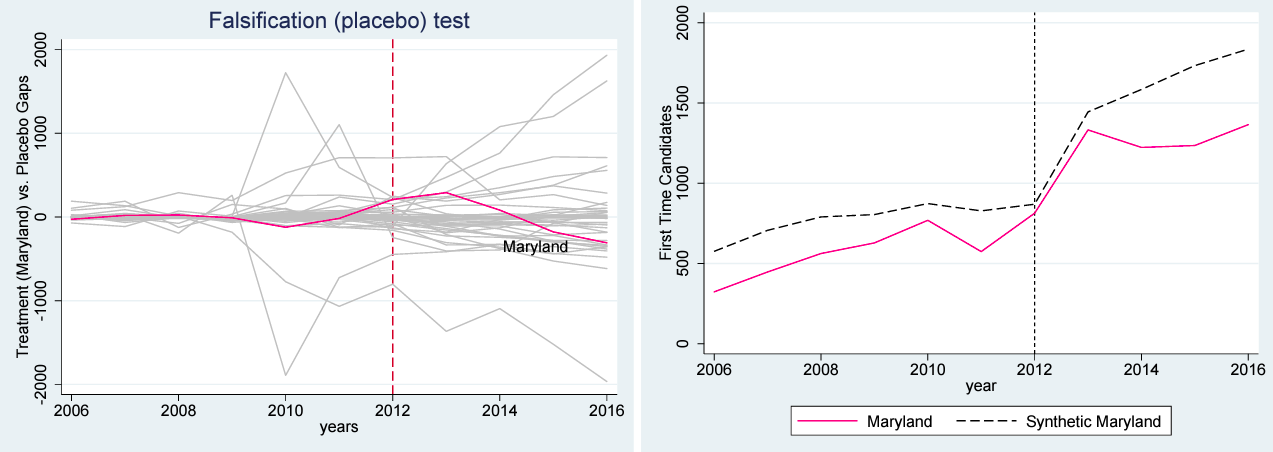
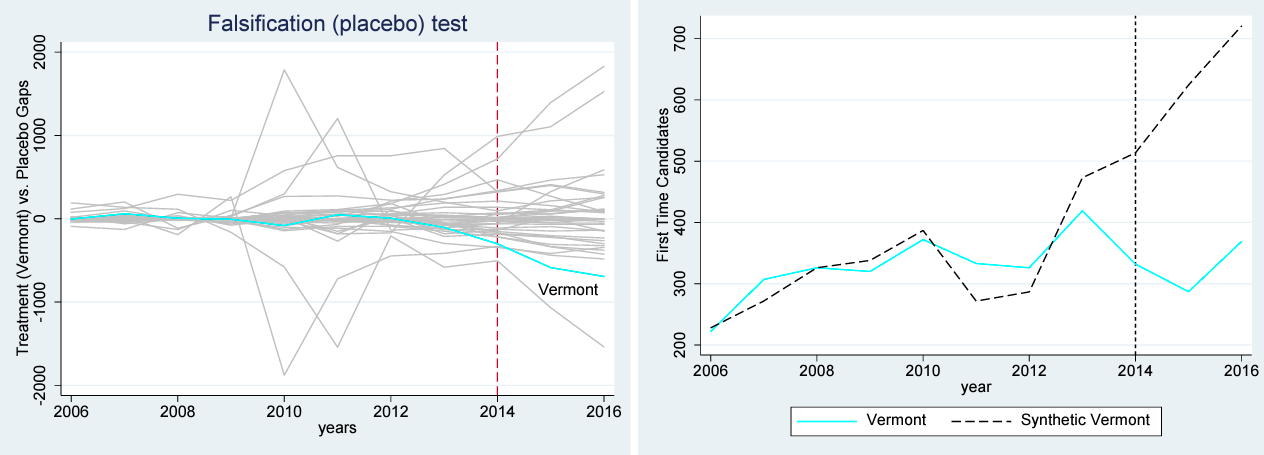
Figure A2.4. Impact on Number of First-Time Candidates of Vermont Increasing Rule from 120/120 to 120/150
References
Abadie, Alberto, Alexis Diamond, and Jens Hainmueller. 2010. “Synthetic Control Methods for Compar- ative Case Studies: Estimating the Effect of California’s Tobacco Control Program.” Journal of the American Statistical Association 105, no. 490 ( June): 493–505.———. 2015. “Comparative Politics and the Synthetic Control Method.” American Journal of Political Science 59, no. 2 (April): 495–510.
Allen, Arthur, and Angela M. Woodland. 2006. “The 150-Hour Requirement and the Number of CPA Exam Candidates, Pass Rates, and the Number Passing.” Issues in Accounting Education 21, no. 3 (August): 173–93.
Anderson, D. Mark, Ryan Brown, Kerwin Kofi Charles, and Daniel I. Rees. 2016. “The Effect of Occupa- tional Licensing on Consumer Welfare: Early Midwifery Laws and Maternal Mortality.” NBER Working Paper No. w22456, National Bureau of Economic Research, Cambridge, MA, August 2016.
Barrios, John M. 2019. “Occupational Licensing and Accountant Quality: Evidence from the 150-Hour Rule.” Becker Friedman Institute for Research in Economics Working Paper No. 2018-32, Uni- versity of Chicago, Chicago, IL, February 2019.
Blair, Peter Q., and Bobby W. Chung. 2019. “How Much of Barrier to Entry is Occupational Licens- ing?” British Journal of Industrial Relations 57, no. 4: 919-943.
Boone, Jeff P., and Teddy L. Coe. 2002. “The 150-Hour Requirement and Changes in the Supply of Ac- counting Undergraduates: Evidence from a Quasi-Experiment.” Issues in Accounting Education 17, no. 3 (August): 253–68.
Carpenter, Charles G., and E. Frank Stephenson. 2006. “The 150-Hour Rule as a Barrier to Entering Public Accountancy.” Journal of Labor Research 27, no. 1 (March): 115–26.
Carroll, Sidney L., and Robert J. Gaston. 1981. “Occupational restrictions and the quality of service re- ceived: Some evidence.” Southern Economic Journal 47, no. 4 (April): 959–76.
Farronato, Chiara, Andrey Fradkin, Bradley Larsen, and Erik Brynjolfsson. 2020. “Consumer Protec- tion in an Online World: An Analysis of Occupational Licensing.” NBER Working Paper No. w26601, National Bureau of Economic Research, Cambridge, MA, January 2020.
Friedman, Milton. 1962. Capitalism and Freedom. Chicago: University of Chicago Press.
Hall, Joshua C., and Shree B. Pokharel. 2016. “Barber Licensure and the Supply of Barber Shops: Evi- dence from US States.” Cato Journal 36, no. 1 (Winter): 647–57.
Halvorsen, Robert, and Raymond Palmquist. 1980. “The Interpretation of Dummy Variables in Semiloga- rithmic Equations.” American Economic Review 70, no. 3 ( June): 474–75.
Hotz, V. Joseph, and Mo Xiao. 2011. “The Impact of Regulations on the Supply and Quality of Care in Child Care Markets.” American Economic Review 101, no. 5 (August): 1775–1805.
Jacob, John, and Dennis Murray. 2006. “Supply-Side Effects of the 150-Hour Educational Requirement for CPA Licensure.” Journal of Regulatory Economics 30, no. 2 (August): 159–78.
Jackson, Robert E. 2006. “Post-graduate Educational Requirements and Entry into the CPA Profession.” Journal of Labor Research 27, no. 1 (March): 101–14.
Kleiner, Morris M., and Alan B. Krueger. 2010. “The Prevalence and Effects of Occupational Licensing.”British Journal of Industrial Relations 48, no. 4 (December): 676–87.
Kleiner, Morris M., and Robert T. Kudrle. 2000. “Does Regulation Affect Economic Outcomes? The Case of Dentistry.” Journal of Law and Economics 43, no. 2 (October): 547–82.
Kleiner, Morris M., Allison Marier, Kyoung Wong Park, and Coady Wing. 2016. “Relaxing Occupational Licensing Requirements: Analyzing Wages and Prices for a Medical Service.” Journal of Law and Economics 59, no. 2 (May): 261–91.
Kleiner, Morris M., and Richard M. Todd. 2009. “Mortgage Broker Regulations That Matter: Analyzing Earnings, Employment, and Outcomes for Consumers.” In Studies of Labor Market Intermediation, edited by David H. Autor, 183–231. Chicago: University of Chicago Press.
Law, Marc T., and Sukkoo Kim. 2005. “Specialization and Regulation: The Rise of Professionals and the Emergence of Occupational Licensing Regulation.” Journal of Economic History 65, no. 3 (Febru- ary): 723–56.
Law, Marc T., and Mindy S. Marks. 2009. “Effects of Occupational Licensing Laws on Minorities: Evi- dence from the Progressive Era.” Journal of Law and Economics 52, no. 2 (May): 351–66.
Leland, Hayne E. 1979. “Quacks, Lemons, and Licensing: A Theory of Minimum Quality Standards.”Journal of Political Economy 87, no. 6 (December): 1328–46.
Meehan, Brian. 2015. “The Impact of Licensing Requirements on Industrial Organization and Labor: Evidence from the US Private Security Market.” International Review of Law and Economics 42 ( June): 113–21.
Meehan, Brian, and Bruce L. Benson. 2015. “The Occupations of Regulators Influence Occupational Regulation: Evidence from the US Private Security Industry.” Public Choice 162, no. 1-2 ( January): 97–117.
National Association of State Boards of Accountancy (NASBA). 2006–2016. Uniform CPA Examination: Candidate Performance. Nashville, TN: NASBA, 2006–2016. ———. 2008. Education and Licensure Requirements for Certified Public Accountants: A Discussion Regarding Degreed Candidates Sitting for the Uniform CPA Examination with a Minimum of 120 Credit Hours (120-Hour Candidate) and Becoming Eligible with a Minimum of 150 Credit Hours (150-Hour Can- didate). Draft, July 2008. ———. 2011. New Hampshire Exam and Certification Requirements. December 8, 2011.
Soileau, Jared S., Spencer C. Usrey, and Thomas Z. Webb. 2017. “Sitting Requirements and the CPA Exam.” Issues in Accounting Education 32, no. 1 (February): 1–15.
Timmons, Edward J., and Robert J. Thornton. 2008. “The Effects of Licensing on the Wages of Radiolog- ic Technologists.” Journal of Labor Research 29, no. 4 (December): 333–46. ———. 2010. “The Licensing of Barbers in the USA.” British Journal of Industrial Relations, 48, no. 4 ( July): 740–57.
Thornton, Robert J., and Edward J. Timmons. 2013. “Licensing One of the World’s Oldest Professions: Massage.” Journal of Law and Economics 56, no. 2 (May): 371–88.
Wisconsin Institute of Certified Public Accountants (WICPA). Accessed 2017. “CPA Exam & Licen- sure.” Education. https://www.wicpa.org/education/cpa-exam-licensure.