

1. Introduction
Over the past decade a number of studies have highlighted the expansion of occupational licensing (“licensing” in the rest of the paper) across several occupations (Kleiner, 2006; Bryson and Kleiner, 2019) discussing, among others, its effects on labor supply, wages, mobility, and the prices of the services provided (White House, 2015; Gittleman and Kleiner, 2016; Johnson and Kleiner, 2020; Farronato et al, 2020). Licenses are commonly found to generate wage premia of about 15% (Kleiner and Krueger, 2010; Ingram, 2019) and reduce labor supply by about 20% (Blair and Chung, 2019). For immigrants, occupational licensing is harder to get (Gomez et al, 2015), but, once obtained, it produces higher returns to schooling relative to natives, and, in the case of immigrant women, it leads to more hours of work (Cassidy and Dacass, 2019).
Although the wage effects are akin to those of a trade union (Kleiner, 2006; Kleiner and Soltas, 2019; Zhang, 2019), the reasons underpinning the introduction of licensing, its operating mechanism, and welfare consequences are quite distinct. Unions raise employment costs for the benefit of their members— typically workers at the low end of the pay scale—tending to curb income inequality between high- and low-pay employees. In contrast, licensing restricts entry to certain skilled manual and professional jobs, theoretically in exchange for higher quality in the services provided (Gellhorn, 1976), creating monopolies that extract surplus from consumers with no detectable impact on inequality.
Existing research has so far studied the determinants of licensing and its effects on wages and labor supply. In contrast, little work has addressed its effects on the quality of the education-occupation match experienced by licensed and unlicensed tradesmen and professionals. Yet, this topic can shed light on whether a fundamental objective of licensure is fulfilled: namely, to screen against potential professional incompetence by ensuring a tight connection between the human capital of license holders and the specific skill requirements of their jobs.
In theory, restricting certain occupations through a licensure system aims to protect the general public from the risk of being exposed to professional incompetence (Leland, 1979). The admission includes completing set formal qualifications, gaining relevant work experience, and complying with regular practices like annual training, maintaining liability risk insurance, and holding membership in licensing associations. Compliance raises the cost of the services delivered under licensure, but this is often considered acceptable to ensure that services are delivered at or above set minimum standards. In practice, however, empirical studies repeatedly find that this quality-price trade-off does not exist: licensed services are more expensive and of no better quality than non-licensed comparable alternatives (Kleiner and Kudrle, 1997; Kugler and Sauer, 2005; Peterson, Pandya, and Leblang, 2014; Wiswall, 2007; Farronato et al, 2020).
Licensing could nevertheless affect another objective: namely, to improve the quality of the match between the skill level associated with a job and the human capital of the individual carrying it out. The screening involved in acquiring a license may prevent under-qualified applicants from gaining access to a profession, as only those with valid credentials can filter through. At the same time, by formally stating the criteria re-quired to be successfully employed in a certain job, the licensing regime may help job-seekers avoid excess schooling and over-qualification.
Mismatches between the skills acquired through formal education and those required in the job per-formed are common in the labor market (Chevalier, 2003; McGuinness, 2006; Leuven and Oosterbeek, 2011). Most workers have a level of education commensurate with their job, but a substantial proportion have much more (they are described as “over-educated” in Freeman, 1976), and a similar proportion have much less (“under-educated”).1Several alternative methods are used by this stream of research to measure over-, correct, and under-education, ranging from self-assessment to objective assessments carried out by official national agencies (e.g., the National Center for O*NET Development in the US and the Australian Bureau of Statistics for Australia). A temporary mismatch is a natural feature of a well-functioning labor market, as well-educated newcomers enter at a lower point to gain relevant experience and then catch up with faster career progressions (Sicherman, 1991; Robst 1995). However, it has been observed that over-education is both persistent and associated with undesirable consequences that raise serious public policy concerns (Büchel and Mertens, 2004; Beckhusen et al, 2013; Adalet McGowan and Andrews, 2015), including higher job turnover and diminished individual productivity and well-being (Tsang and Levin, 1985; Tsang, 1987; Alba-Ramirez, 1993; Rubb, 2003; Lang, 2007).
Mismatches, and especially over-education, are more common among immigrants than natives (Chiswick and Miller, 2009; Akresh, 2008). This appears to reflect specific features of labor demand (Altonji and Pierret, 2001; Tani, 2017), as well as institutional frictions, such as licensing (Tani, 2018; Cassidy and Dacass, 2019). Besides the personal costs suffered by the individuals experiencing it, over-education in the immigrant population carries relevant negative societal consequences. For example, in the health emergency caused by the COVID-19 pandemic in the US in 2020, excess demand for health care coexists with a large stock of widely distributed but “unused” immigrant nurses (Batalova, Fix, and Pierce, 2020). Nursing is a licensed occupation across all US states, and this appears to be a major obstacle to the employment of these immigrants.2The Migration Policy Institute estimates these qualified immigrants to be over 250,000 across the US. Although these immigrants completed 4-year health degrees, they are unemployed or work in jobs that require no more than a high school degree—a formidable paradox representing skill wastage for nurses, hospitals, and their prospective patients.
This paper focuses on the education-occupation match by addressing two related questions: (1) Is licensing associated with a better match quality? (2) Does licensing differently affect higher- and lower-educated natives and immigrants, and if so how?
The empirical analysis is based on four waves of the 2014 sample of the Survey of Income and Program Participation (SIPP), a longitudinal survey covering relevant questions related to licensing. The key advantage of using SIPP 2014 is its longitudinal nature, which enables one to control for time-invariant individual heterogeneity, and its several questions on licensing, which compensate for the lack of a clear-cut identification of which jobs are subject to it across the US.
To identify licensed jobs and the relevant comparison group of unlicensed workers, the literature has proposed different strategies. We follow five of them, and identify licensing from:
- self-reported measures of whether the respondent holds a license (Gittleman, Klee, and Kleiner, 2018 – I),
- whether that license was issued by federal, state or local government (Gittleman, Klee, and Kleiner, 2018 – II),
- whether the license serves to carry out the current job (Cassidy and Dacass, 2019);
- we also aggregate this information at the state level to generate a licensing indicator (Blair and Chung, 2019), and
- extract a smaller set of jobs licensed in some but not all US states sourced from the National Occupational Licensing Statute Database3https://www.ncsl.org/research/labor-and-employment/occupational-licensing-statute-database.aspx accessed 20th August 2020. using its definition.
The dependent variable, the quality of the job-education match, is measured as the difference between a respondent’s level of completed education and the education required for performing his/her job. This approach follows the literature (e.g., Duncan and Hoffman, 1981; Hartog, 2000; Leuven and Oosterbeek, 2011) though it is far from perfect. Job-required education is sourced from the National Centre for O*NET Development (2008): each occupation is sorted into one of five “job zones,” each corresponding to well-defined level of education (less than high school, high school diploma, some college or an associate degree, bachelor’s degree, master’s and PhD). When a respondent’s actual completed education is grouped in the same five levels, it is possible to establish a 1:1 link with the job-required education for each working individual.
“Over-educated” workers are those whose completed education is 1 or more levels above their job-re- quired education. This is the case if someone with a university degree performs a job requiring only an associate degree or a high school level, or a master’s/PhD holder performs a job where a bachelor’s degree is required. If licensing improves the quality of skill matches, we should expect that it reduces over-education. We also analyze the effect of licensing on “under-education,” where a respondent’s formal schooling is less than the job-required education,4Under-education occurs when a high school graduate carries out a job requiring a bachelor’s or master’s degree. This is often the case for managerial occupations that are classified in the highest job zone but are filled by people with bachelor or lower qualifications. under the maintained hypothesis that an effective licensing system prevents access to jobs by underqualified candidates.
With reference to immigrants, we distinguish those who have and have not been settled for more than 10 years, as a way to separate different stages of economic assimilation (LaLonde and Topel, 1992). Immigrants self-select and specialize once in the US labor market (Roy, 1951; Borjas, 1991). Licensing likely compounds the challenges faced by immigrants, especially when they have completed their formal education abroad, because schooling quality in the country of education may be considered by employers to differ from its nominal US equivalent. Alternatively, it may also be possible that foreign education does not carry a sufficiently clear signal of individual productivity for US employers, creating incentives to add a domestic qualification (Tani, 2017). In view of these considerations, we expect immigrants to either avoid jobs subject to licensure or acquire extra qualifications relative to comparable natives. In other words, licensing likely raises over-education among immigrants.
Although we rely on official measures of schooling and required education in a given job and standard methods to measure over-education, we are aware of the limitations of our approach. For one, there are about twice as many jobs in the O*NET classification (based on 6 digits), as in SIPP (based on 4). In general, there is a clear 1:1 overlap between the O*NET and SIPP 2014 classifications for many jobs. But in some cases, it is necessary to aggregate. Often this is unproblematic as the multiple O*NET categories within a given SIPP 2014 occupation belong to the same job zone. The job-required education level sourced from O*NET can therefore be easily crossed-over to SIPP 2014. At times, however, this is not possible. In such cases, we apply to SIPP 2014 the average job-related education using the various job zones of the underlying O*NET occupations (more in the Data section). Since our approach can introduce measurement error, we test whether the results are significantly affected by it using the method discussed by Oster (2019). We find strong support that this is not the case.
We apply several empirical strategies to measure the effect of licensing and define the relevant group of unlicensed occupations. First, we use the Ordinary Least Squares estimator as a baseline, the panel random effect estimator as our preferred choice, and Propensity Score Matching (PSM) as an additional backup to overcome the lack of an ideal control group. Perhaps more importantly, we perform regressions on subsets of jobs that are only partly licensed across the US, removing those that are either uniformly licensed or unlicensed, as a way to reduce the heterogeneity of jobs in the group. We find only small differences and hence tend to present the results obtained on the larger set of occupations. Finally, we perform the regressions on a limited number of low-education occupations sourced from the National Occupational Licensing Statute Database as a way to exploit an existing institutional identification of licensure without relying on derived methods, though we find that the results are data-specific and invariably reflect the low education level of the jobs covered.
Overall, the results suggest that licensing reduces over-education but does not reduce under-education. For immigrants, licensing is not only less likely (Cassidy and Dacass, 2019) but it raises the likelihood of over-education, especially for those that have settled for more than a decade. Smaller effects are found for more recent arrivals. Licensing emerges as benefiting natives in low-education jobs while reducing immigrants’ labor market integration. These results are similar to what has been found by recent US empirical work on different outcome variables, which has cast doubt on the supposed benefits of the current licensure system.
2. Data
The empirical analysis is based on the four waves of SIPP 2014. SIPP is a household survey organized as a continuous set of national panels, each featuring a representative sample interviewed over (about) a four-year span. Its main objectives are to collect information on individual and family income dynamics, welfare participation, context and changes in individual and family circumstances, and the interaction among them.5https://www.census.gov/programs-surveys/sipp/about/sipp-introduction-history.html The first SIPP began in 1983, but substantive changes have been implemented with the 2014 panel—most notably the integration in the main survey of questions that were previously asked in ad hoc modules, and the reduction in the frequency of interviews from once per quarter to once per year.
Academic research on licensing has typically exploited information contained in a freestanding cross-sectional module of the SIPP 2008 sample (Cassidy and Dacass, 2019; Blair and Chung, 2019). The questions covered in that module included the type of organization issuing the license, whether licensure was required to perform the current job, and whether it involved attending training or passing examinations. Some of these questions are included in SIPP 2014 and used in the analysis: namely, (i) whether the respondent has earned a professional certification or license, and (ii) whether the certification or license was issued by the federal or state or local government. An important advantage of SIPP 2014 relative to SIPP 2008 is the longitudinal coverage of the licensing question. This makes it possible to apply panel data estimation techniques and control for time-invariant individual heterogeneity—something that is not possible with SIPP 2008 because licensing was covered only in an special cross-sectional module in wave 13, focused on licensure.
Because SIPP 2014 data has only become available recently, its use in the literature has so far been limited. It has typically been used in reports about the statistical features of the new data (National Academy of Sciences, Engineering and Medicine, 2018), and working papers focusing on wealth (Eggleston and Gideon, 2017) and poverty dynamics (Warren and Edwards, 2017). To our knowledge this is one of the first papers using SIPP 2014 to study the impact of licensing on the quality of skills match in the labor market. The four waves of SIPP 2014 form a panel of about 53,000 households observed over a 48-month period, from January 2013 to December 2016. In line with existing research, we restrict the working sample to those aged 18+ who are working and have an hourly wage within the range ($5 USD – $100 USD). This results in a set of just over 25,000 individuals as of January 2013—the first reference month of the first wave of SIPP 2014.
Similarly to previous literature, we also face the challenge of identifying occupations subject to licensure and the ensuing comparison group of unlicensed jobs. We use five alternative definitions: first, we use the responses to whether one holds a license or certification as in Gittleman, Klee and Kleiner (2018), and, second, whether that was issued by the federal, state or local government (also applied by Gittleman, Klee and Kleiner (2018)). Third, we use the self-reported information about holding a government-issued license or certification by occupation and attribute licensure for that occupation in the state if more than 50% of the jobs in a state are licensed (Blair and Chung, 2019). Fourth, we use whether the respondent holds a license or certification issued by government and the job performed requires it (Cassidy and Dacass, 2019). Fifth, we use the smaller set of occupations extracted from the National Occupational Licensing Statute Database, which we can directly match to SIPP 2014.
The occupational coverage of these five licensing identification strategies is summarized in Figure 1. It reports the occupations along the horizontal axis and their frequency on the vertical axis for unlicensed (left panel) and licensed (right) jobs, respectively. The first four approaches seem similar in the coverage of high- and low-education jobs, with peaks in professional (codes ~2000-3999) and trade occupations (~8000-9750). This is not the case for the National Occupational Licensing Statute Database, which overwhelmingly covers low-education jobs. This feature limits its usefulness in offering anything beyond a partial view of the effect of licensing on the quality of the skill match.
The dependent variable, the education-occupation mismatch, is obtained through a number of steps that draw from the classification of occupations. O*NET (National Centre for O*NET Development, 2008, Tables 2 and 3) associates each job with one of five “job zones” reporting the appropriate level of education required to carry it out. We aggregate the level of completed education using the same five educational groups. Then, we use the job in both SIPP 2014 and O*NET to create a 1:1 relationship between job-required and actual level of education for each working person in SIPP 2014 to gain a measure of the quality of their match.
While completed education is directly collected from each SIPP 2014 respondent, its mapping into the job-required educational level is complex, as O*NET contains many more jobs than SIPP 2014: there are 969 occupations in O*NET but only 473 jobs in SIPP 2014. We hence start by matching jobs with the exact same occupational title in both datasets (e.g., “advertising and promotion managers,” “budget analysts,” and “computer programmers”). When this is not possible, we look for the closest match: for example, we assign the three O*NET categories Farm Equipment Mechanics and Service Technicians (49- 3041.00), Mobile Heavy Equipment Mechanics, Except Engines (49-3042.00) and Rail Car Repairers (49-3043.00) to the single SIPP 2014 category “Heavy vehicle and mobile equipment service technicians and mechanics” (7220), as these are closely related. In doing so we adjust the job-required education of the single SIPP 2014 category using the average of the job zones of the underlying O*NET jobs. Continuing with the example, jobs 49-3041.00 and 49-3042.00 are in job zone 3 but 49-3043.00 is in job zone 2. We impute the job-required education for job 7220 in SIPP 2014 as 2/3 job zone 3 + 1/3 job zone 2 = 2.667.
Once completing this task for each SIPP 2014 job, we subtract the value obtained (2.667) from the actual level of education of each respondent performing that job (7220), previously aggregated in the same 5 groups as O*NET job zones. A difference of +1 or more identifies an over-educated respondent: his/her schooling is at least 1 level above the (job-zone sourced) requirement to perform his/her job. A correct match arises when the difference between actual and minimum education is less than one in absolute value. Conversely, a value of -1 or greater is an indication of under-education: the respondent has less than 1 level of education relative to what required by the job s/he performs. This approach is akin to the “job analysis” classification of education-occupation mismatches. It applies metrics established by national statistical offices or other institutional agencies (e.g., National Center for Development of O*NET) and produces a more conservative range of measures (Kler, 2005) than alternative approaches such as mean or modal years of education across various age cohorts and sub-groups of workers within a given job. However, both methods have advantages and drawbacks (Dolton and Vignoles, 2000; Halaby, 1994; Hartog, 2000; Leuven and Oosterbeek, 2011), which we acknowledge.
Table 1 illustrates best and worst occupation-education matches by job zone: job zones 1–3 include jobs requiring a high school degree. Job zone 4 contains jobs requiring a bachelor’s degree while job zone 5 covers occupations requiring a master’s degree or above. The fact that over-education is zero in all the best matches in job zone 5 illustrates the potential bias arising when the analysis includes only jobs that are licensed or unlicensed. To address this problem, we present results where such “extremes” are removed, leaving only occupations that are licensed in part of the US. In these cases, the effect of licensing is identified by the geographic coverage of licensure across US states.
To continue with Table 1, the best matches are generally found in professional and technical jobs (drafters, installers, mechanics…) or jobs at the highest managerial levels (CEO, general manager…). The worst arise either in occupations requiring predominantly generic skills (receptionists, mail sorters, middle management, etc.) or in high-education jobs involving intermediary supervisory tasks, or in highly specialized fields (e.g., IT, computing, health).
Figure 2 shows the average over-education in licensed and unlicensed occupation by immigrant status. On average there is more over-education in unlicensed occupations (left panel), supporting prima facie the hypothesis that licensing reduces over-education. Natives (which include Puerto Ricans) have the lowest incidence of over-education in jobs that are unlicensed but the highest in the opposite case, respectively. This occurs as immigrants concentrate in fewer jobs, mostly in health care and teaching, and occupy proportionally fewer managerial positions within the licensed group.
Table 2 summarizes the unconditional mean and standard deviation of the key variables by licensing status as of the first month of the first wave ( January 2013). Licensing here reflects holding a license or certification issued by government at federal, state or local level (Gittleman, Klee and Kleiner I, 2018).
There are substantive differences between licensed and non-licensed respondents along several demographic and labor market characteristics. On average, licensed workers earn more and have a lower incidence of mismatch than their unlicensed counterparts. They are also more likely to be older (43.1 vs. 41.3 years of age), female (58.5% vs. 45.7%) and single only 36.4% are married vs. 45.8% among unlicensed respondents.
Notable differences arise with respect to education, immigration status, and employment. Licensed workers are far more likely to have higher levels of education than non-licensed workers, as shown by their higher shares at progressively higher levels of education. While there are only 18.6% licensed workers with a high school degree (unlicensed: 31.6%), there are 27.2% with a university qualification (unlicensed: 18.6%) and 21% holding a post-graduate degree such as master’s and PhD (unlicensed: 8.1%). Licensed workers are also more likely to be US natives than unlicensed workers, respectively (90.1% vs. 83.5%). With reference to race, licensed workers are more likely to be white (72.8% vs. 63.5%) and less likely to be Hispanic (8.6% vs. 15.5%). No detectable differences arise for the other racial groups.
Immigrants who have settled in the US for more than 10 years are predominantly born in the 1950s–1970s and likely arrived after having acquired substantive schooling abroad. This is even more likely for more recent immigrants, mostly born during the 1970s and the 1980s and settling in their 20s or 30s. Arriving after completing education abroad may explain why immigrants in Table 2 are far less likely to work in a licensed job: 7.6% vs. 12.2% among those who have settled in the US for more than 10 years and 2.3% vs. 4.6% among more recent immigrants. The prevailing jobs for both groups are in health care and teaching (>80%). As licensing bodies may not consider foreign education fully equivalent to comparable US degrees, additional formal qualifications may be required to gain licensure. This may contribute to push immigrants away from licensed jobs—something already noted by the literature (Banerjee and Phan, 2014; Gomez et al, 2015; Cassidy and Dacass, 2019).
Finally, licensed workers are far more likely to work for the US government at the federal, state or local level than unlicensed workers (29% vs. 12.6%). This is perhaps not coincidental as the most common categories of licensed jobs include teachers and policemen who work in the public sector. The larger share of government employment among licensed workers also reflects the higher proportions of unionized employment and lower shares of both employees paid on an hourly basis and casual workers.
3. Methodology
The empirical analysis consists of distinct sets of regressions. We begin with the linear probability model:
(1) 
where  is a measure of the over-education of individual
  working in state
  at time
  is a set of demographic and labor market characteristics6These include age (up to third polynomial), gender, marital status, disability status, race (white, Hispanic, black, Asian, other—reference: white) whether another language is spoken at home, the level of education (less than high school, high school equivalent, some university or associate degree, bachelor’s degree, master’s, professional, or doctoral degree—reference: less than high school), immigration status (US native, naturalized, immigrant—reference: US native), age cohort (18–25, 26–35, 36–45, 46–55, 56–65, 66+ —reference:18–25), an interaction term between the cohort and the level of education, because schooling completion rates vary across generations, and whether or not they live in a metropolitan area, union membership status, whether or not paid by the hour, and employer type (business sector, government, self-employed—reference: business sector). ;
  is a dummy variable indicating whether a person works in a job subject to licensing;
  measures the effects of time, is a vector of state fixed effects, and
  and
and  form a composite error term.
The parameter of interest in model (1) is  as that captures the effect of licensing on the skills match conditional on demographic, educational, employment and other characteristics. We apply Ordinary Least Squares to obtain the baseline values of model (1), clustering the error term across the same individual observed on a monthly basis. However, our preferred approach is the panel random estimator7See Wooldridge (2010) for a discussion. since this reduces the problem of serial correlation in the composite error term while taking into account that some covariates are time-invariant (e.g., gender, race, place of birth).
Then, we add the time-averaged values of the time-varying variables to model (1), which we refer to as “Mundlak” in the rest of the paper. Doing so enables us to control for unobserved time-invariant heterogeneity, and relax the assumption of orthogonality between the individual-specific variable and the observed covariates, which applies to the random effect estimator (Mundlak, 1978; Chamberlain, 1980; Wooldridge, 2010). We use the Mundlak estimates in every empirical specification, thereby applying the model
(2) 
where the vector  summarizes the time-averaged values of the time-varying components of
  . Although self-reported measures of licensure are likely to be endogenous (see separate subsection below), the bias is controlled by the inclusion of state fixed effects .
To explore whether the effect of licensing varies across groups according to immigrant status and time since migration, we augment model (2) to include an interaction term between licensing and immigrant status. This is implemented via the statistical model
(3) 
which uses the same dependent and control variables of model (1’) but includes the new interaction term  . The sign and statistical significance of the parameter
  test the null hypothesis of identical licensure effects between US natives, long-term immigrants, and more recent immigrants to the US, respectively.
Finally, we restrict the analysis to the cross-sectional version8To our knowledge there is no agreed econometric formulation to apply Propensity Score Matching to panel data. We hence restrict the analysis to a cross-section of SIPP 2014 based on the first month of observations in the first wave ( January 2013) and acknowledge this limitation. of model (2) to apply a Propensity Score Matching technique (nearest neighbor). The PSM relates licensing to a set of characteristics that include demographics, education, country of origin, immigration and state of residence9 The explanatory variables include age, gender, marital status, race (white, Hispanic, black, Asian, other—reference: white), whether another language is spoken at home, the level of education (less than high school, high school equivalent, some university or associate degree, bachelor’s degree, master’s, professional, or doctoral degree—reference: less than high school), immigration status (US native, naturalized, immigrant— reference: US native), and whether or not the respondent lives in a metropolitan area. All PSM results presented pass Rubin’s B and R tests of balance between treated and non-treated group (Rubin, 2001) as implemented by Stata’s pscore command. Recent work has begun applying PSM to reduce the heterogeneity of the non-licensed worker group; see, e.g., Kleiner and Xu (2019). in order to identify a related unlicensed control group. In this process we progressively reduce the maximum tolerated distance between matched observations to improve comparability between licensed and unlicensed observations.
The new control group has extensive common support and satisfies the balancing tests discussed by Rubin (2001) across the various specifications applied.
Before presenting the estimates it is important to clarify some empirical issues.
Identifying the relevant comparison group
We estimate the effect of licensing by relying on state-by-state variation in the classification of a licensed job using the 4-digit category reported in SIPP 2014. As licensing requirements vary across the US, we use five possible control groups used in recent work. We also apply model (1’) and (2) on two distinct sets of occupations:
- jobs that are licensed only in some US states, and
- jobs that are uniformly either licensed or not licensed across the
We perform separate regressions, but find limited differences between the results arising when observations are restricted to (i) and those when observations include both (i) and (ii) above. We hence tend to present the latter, as they use a larger number of observations.
Dealing with omitted variable bias
Licensing is likely endogenous, as those working in such jobs self-select into them. We control for
time-invariant individual heterogeneity by using the random effect estimator, but this does not guarantee that all sources of heterogeneity are adequately controlled for. As an example, the partial observability of the O*NET 6-digit job-required education at the 4-digit SIPP 2014 level generates an omitted variable problem: the unobserved element that links the 6-digit O*NET job into its 4-digit SIPP 2014 aggregate effectively connects the licensing indicator with the error term. The severity of the potential omitted variables bias is assessed via the method developed by Oster (2019), which builds on estimates of the licensing effect obtained by OLS. We show these in Table 3 for each of the five definitions of licensing used in the analysis.
Oster’s approach relies on the assumption that observed and unobserved variables are related, from which one can calculate the ratio of unobserved versus observed selection (“delta”) that makes zero the coefficient (“beta”) of licensing. If this is greater than unity (the benchmark), then unobserved selection is deemed insufficient to invalidate the OLS estimates.
We present this calculation in Table 4. The first row shows that at the set level of R2 delta varies between
4.42 and 112.28—way above the unit benchmark.10 The negative sign of the delta obtained when licensing is defined as per Gittleman, Klee and Kleiner II (2018) (column labeled 3: -33.16) simply suggests that unobserved heterogeneity is negatively related to the covariates included in the regression: what matters is the size of the delta, which is more than 33 times higher than the benchmark. Overall, Table 4 suggests that unobserved heterogeneity is unlikely to invalidate the licensing effect reported in Table 3.
Oster’s method also enables us to assesses the stability of beta by varying delta in the interval [0,1]: if beta excludes zero as delta varies at different levels of R2, the initial OLS estimates can be considered as “robust to omitted variable bias.” As shown in Table 5, the intervals containing beta never contain zero, suggesting that potential omitted variable bias is unlikely to threaten the results presented below.
4. Results
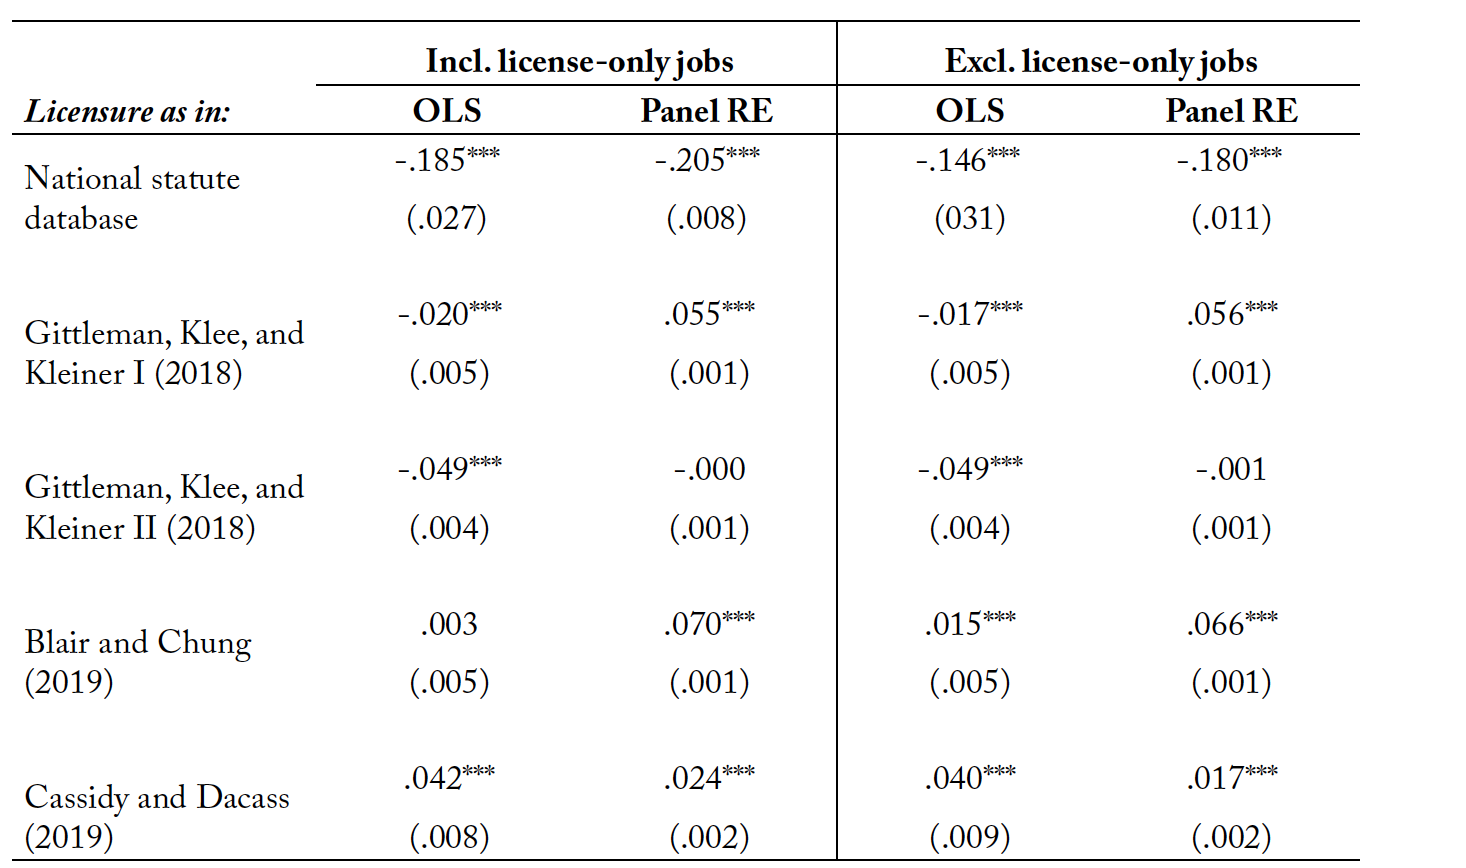
Table 6 summarizes the results obtained on model (2). The left panel includes jobs that are partly licensed across the US as well as jobs that are licensed in each US state. The panel on the right includes only jobs that are licensed in some of the states. Columns display the estimator: OLS, RE, and PSM. Rows indicate the licensing indicator. The first row uses licensing as sourced from the National Occupational Licensing Statute Database. The next two rows indicate whether the respondent holds a license or certification (Gittleman, Klee, and Kleiner I, 2018), and whether or not that license is issued by a government (Gittleman, Klee, and Kleiner II, 2018), respectively. The fourth row reports estimates obtained using the 50-50 rule on government licenses aggregated by occupation and state (Blair and Chung, 2019). The fifth row uses information on whether the respondent holds a government license and uses it for work (Cassidy and Dacass, 2019). As evident from Table 6, there are limited differences between left and right panels: typically the estimates on the right panel are smaller, reflecting the lack of “extremes” arising when jobs are licensed across all the 50 US states.
The results support the hypothesis that licensing reduces over-education: the signs of the remaining licensing coefficients are always negative and significantly different from zero across several definitions of licensing and alternative control groups. The only exception occurs on licensing on the occupations of the National Occupational Licensing Statute Database. These predominantly cover jobs requiring only high school or lower levels of education (we discuss the estimates obtained when separate regressions are performed on low- and high-education jobs later in this section—Tables 9 and 10).
Equivalent regressions performed on data on under-education (Table 7), however, yield mixed results: licensing reduces under-education, but the strongest results arise in the low-education jobs covered by the National Occupational Licensing Statute Database.
When different control groups are used, licensing does not appear to screen out people with lower than job-required education. The RE estimator, our preferred, often yields positive estimates, implying that licensing raises under-education. This is the exact opposite of what licensing is intended to achieve, casting doubts on its usefulness.
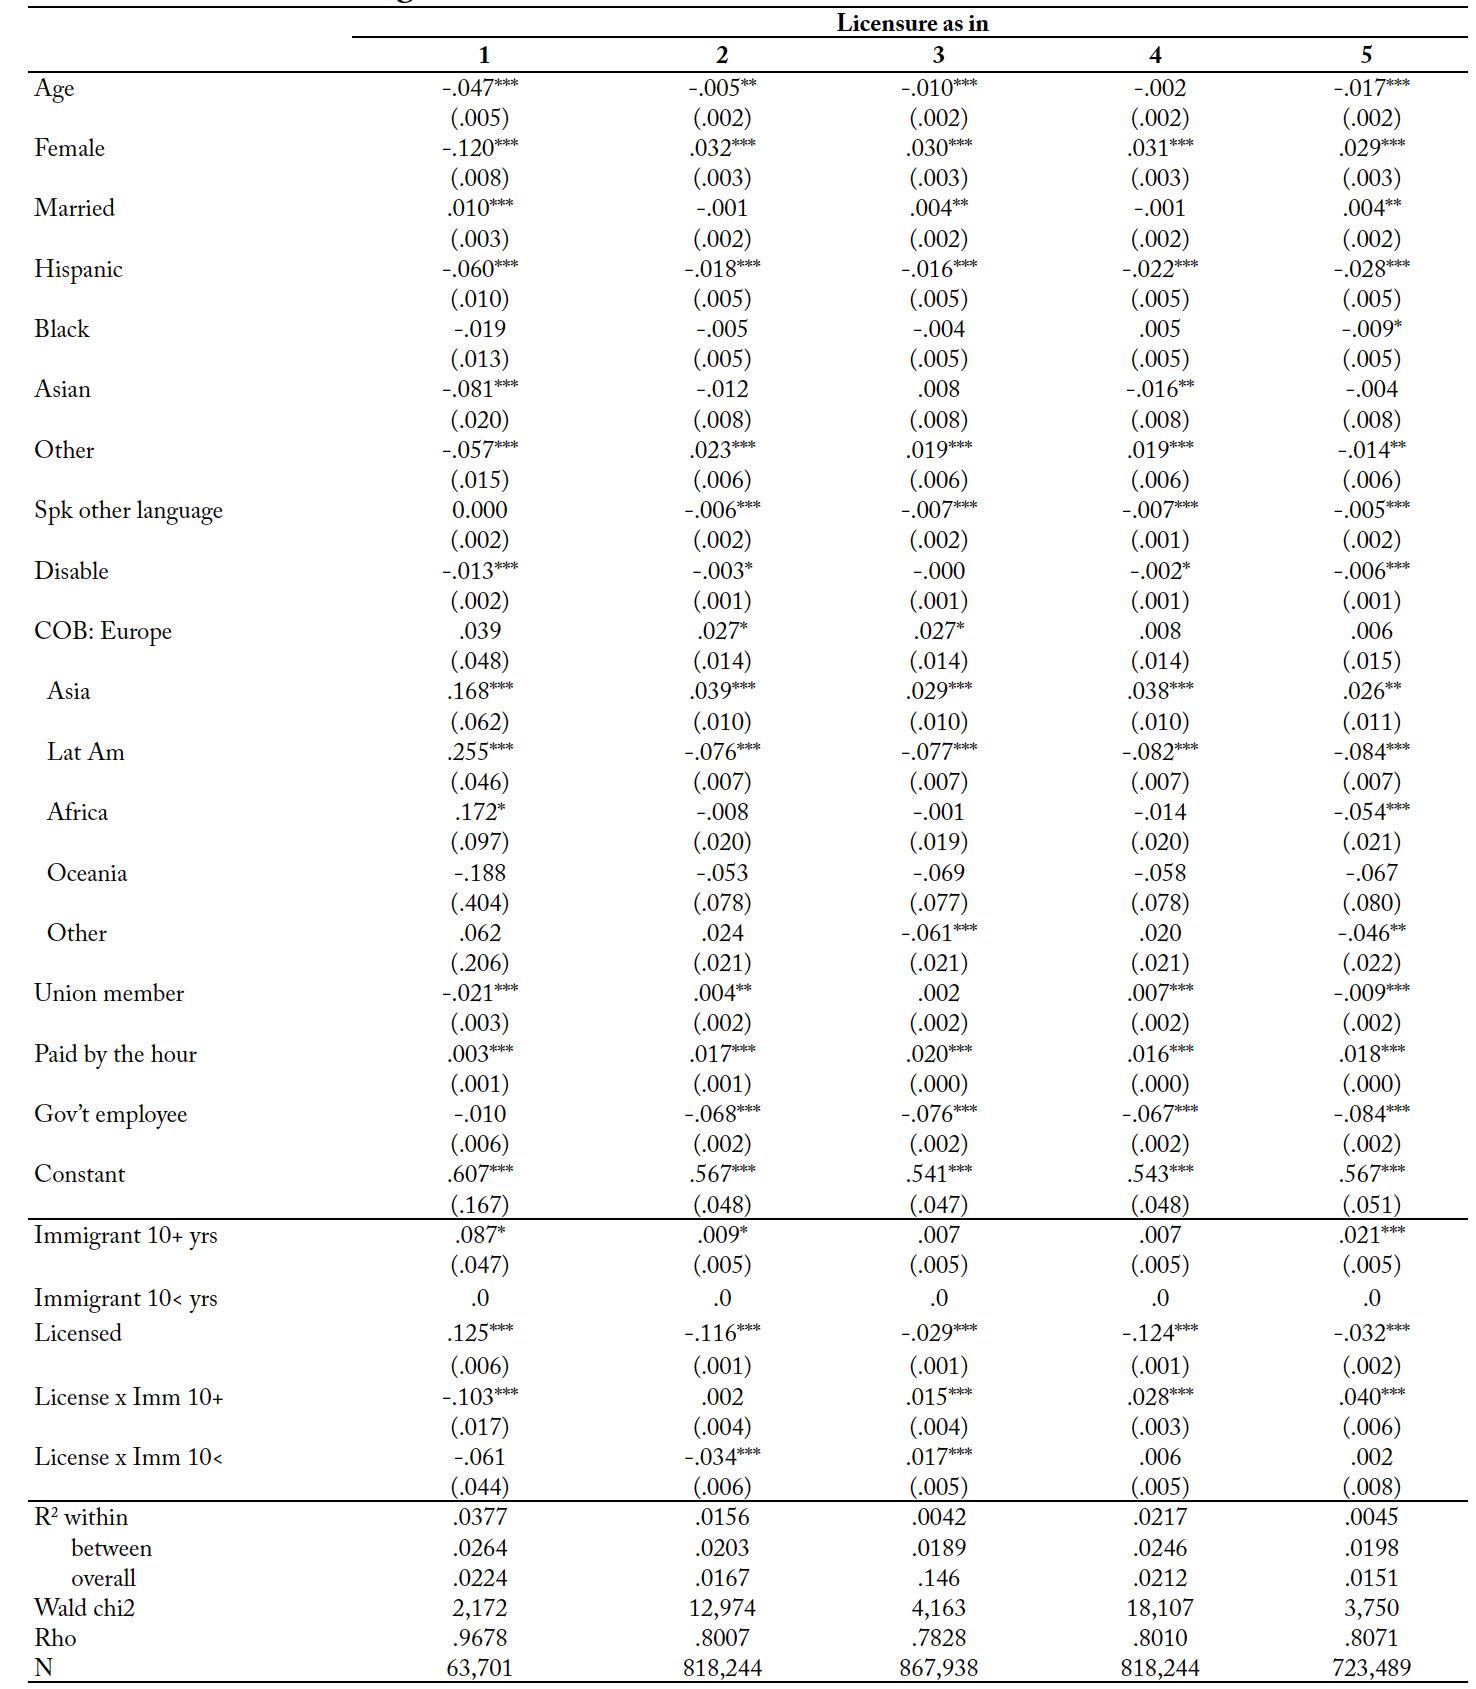
Table 8 reports the results across several covariates based on model (2). Over-education is higher for younger workers (the point estimate of age is generally negative, ranging from -.05% to about -1.7%), women (~2%), and immigrants but only to a lesser extent (earlier arrivals: ~1%). These estimates suggest that skills mismatches are more common among sub-groups that either experience labor market discrimination or provide weaker productivity signals to prospective employers. This may reflect limited work experience or life circumstances (e.g., McMillen, Seaman, and Singell, 2007), as well as the need to complement education completed abroad with a domestic qualification.
Race is not a significant determinant of over-education (Table 8), with the notable exception of Hispanics, for whom it is consistently lower. The better match, however, occurs as Hispanics have on average low levels of formal education and are concentrated in low-education jobs. The country of birth consistently indicates a lower incidence of over-education for those born in Latin America, reflecting the levels of schooling (Rivera-Batiz, 2007; Duncan and Trejo, 2009), which may include qualifications acquired in the US. Opposite results characterize immigrants born in Asia, reflecting relative concentration in low-education jobs (e.g., food preparation, restaurant) and high rates of self-employment (Madamba and De Jong, 1997).
Disability and marital status, too, emerge as statistically unimportant determinants of skill mismatches. The US labor market (notwithstanding what was previously highlighted about women, the young, and immigrants) emerges as employing people according to their productivity rather than their demographic features.
In contrast, the skills mismatch is influenced by the type of work: being employed by government substantially reduces the probability of being over-educated (~7%), while casual and other forms of employment paid by the hour are associated with significantly higher probabilities (~2%). Being a union member has a small and inconclusive effect: its point estimate of less than 1% is signed either positive or negative depending on the comparison group used.
The estimates at the bottom of Table 8 strongly support the existence of a negative relationship between licensing and over-education: the point estimates are both negative and different from zero at the 1% level of statistical significance. Coefficients however vary substantially in magnitude: they are as large as -12% when licensing is self-reported and issued by government (Gittleman, Klee and Kleiner I, 2018), even when responses are aggregated by job and state (Blair and Chung, 2019). In contrast,11These differences also emerge in Figure 2. The distributions of licensed and unlicensed jobs of Gittleman, Klee, and Kleiner I (2018) are similar to Blair and Chung (2019). So are those of Gittleman, Klee, and Kleiner II (2018) and Cassidy and Dacass (2019). they are as low as -3% when respondents state they hold a professional certification or license (Gittleman, Klee and Kleiner II, 2018), or have a license issued by government and need it to work (Cassidy and Dacass, 2019).
The bottom panel of Table 8 reports the interaction between licensing and immigrant status. Licensing raises over-education by 1.7%–4% for immigrants settled in the US by more than 10 years. This finding may reflect some form of discrimination, either statistical or outright as purported in recent work focusing on foreign-born professionals in the US.1212 https://www.migrationpolicy.org/research/brain-waste-immigrants-health-degrees-multi-state-profile?mkt_tok=eyJpIjoiTXpRMlpX- UmxOMlkzT1RNNCIsInQiOiJpbWo0RUZUTTJhRkM2ZXVyMkFhZUIyeVl4NllwR3pOVit6SmVocVBHOFFKek9qTDU4eU9G-MXhpXC9FWWdmY1hjRGpZQTFTM2lSZHpybTFwTjBnXC9FQ3dLWDJaUEw0Rlo2Y1J1bzE3YWZadjNHMUR6M3BsYklZd-TA0WTI0b1Nyc2gwIn0%3D
https://www.migrationpolicy.org/research/untapped-talent-costs-brain-waste-among-highly-skilled-immigrants-united-states https://www.migrationpolicy.org/research/credential-recognition-united-states-foreign-professionals https://www.migrationpolicy.org/research/tackling-brain-waste-strategies-improve-recognition-immigrants-foreign-qualifications https://www.migrationpolicy.org/research/skills-professional-regulation-and-international-mobility-engineering-workforce
All accessed 20 August 2020. This result, however, is also consistent with the need to acquire US-based education to learn the language of the host country, to get a signal of productivity that is recognized by US employers, or to compensate for school quality differences between host country and country of education. The effect of licensing on the over-education of immigrants settled for less than 10 years is generally weaker but nevertheless clearly arises in one case of self-reported licensing (labelled Gittleman, Klee and Kleiner II, 2018), in line with what is found for earlier immigrants.
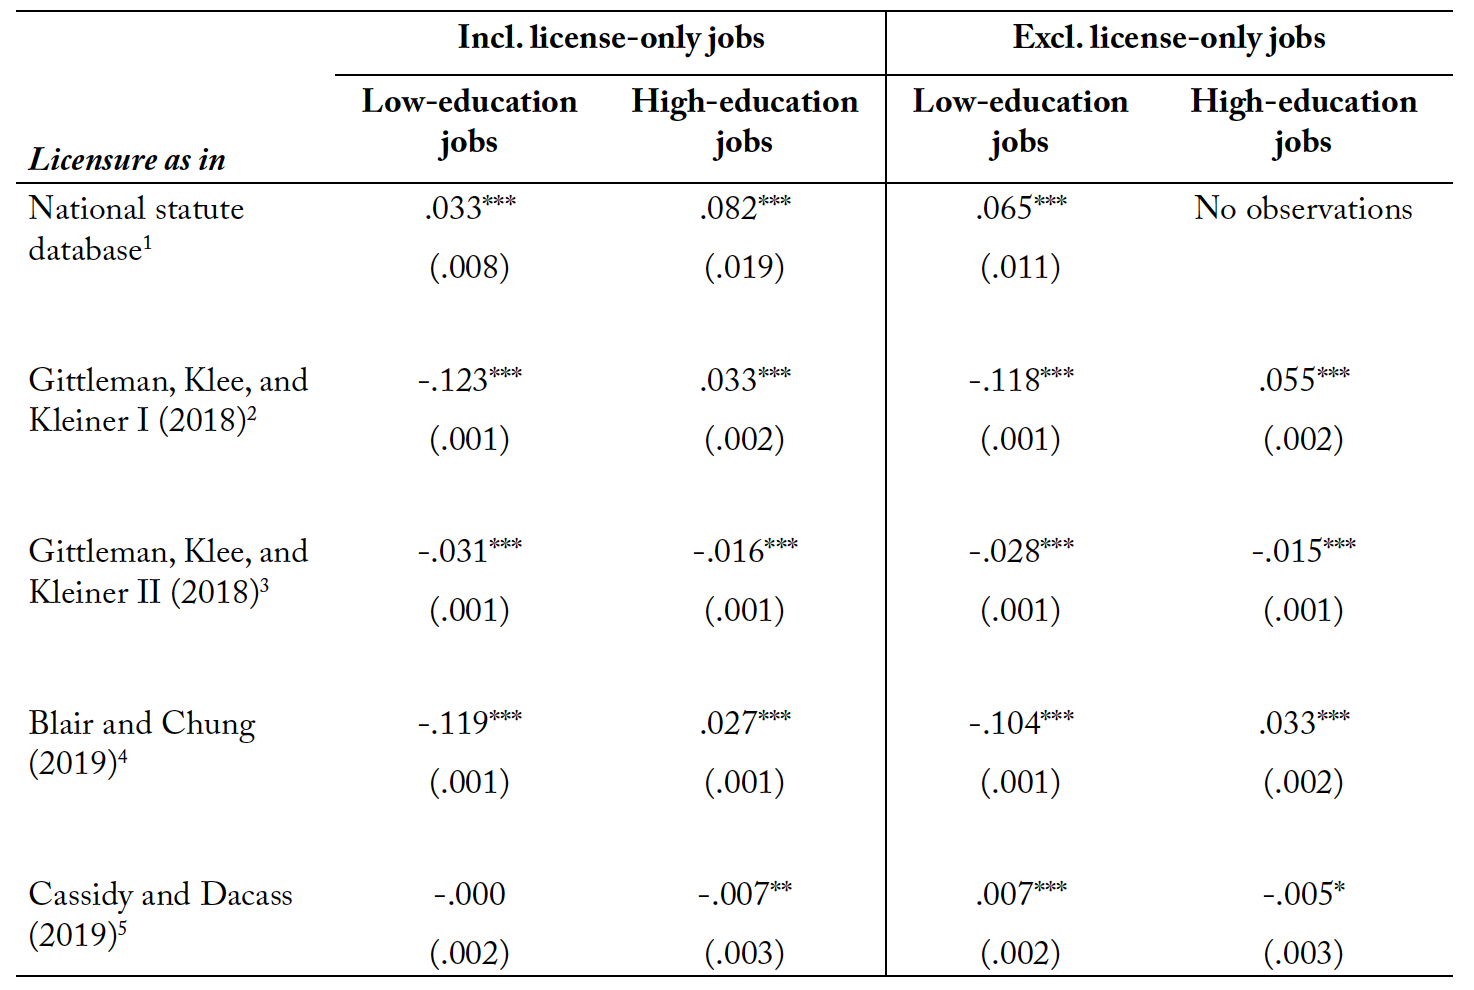
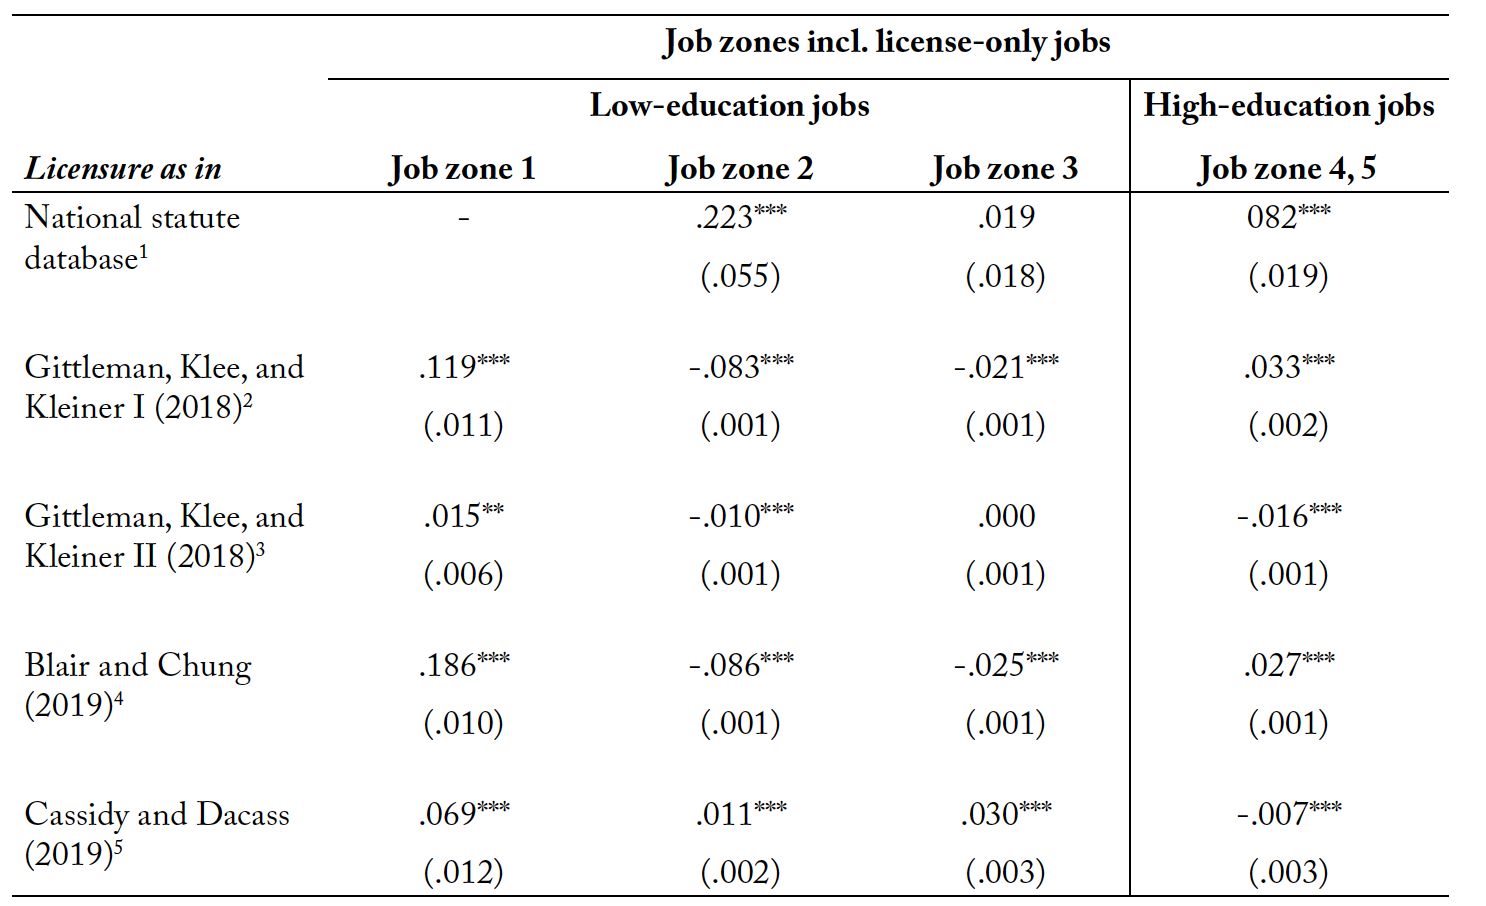
Table 9 and 10 summarize the effect of licensing on the skills mismatch by job-required education (Table 9) or job zone (Table 10). Licensing reduces over-education predominantly in low-education jobs, in job zones 1–3 (the same ones prevailing in the occupations sourced from the National Occupational Licensing Statute Database), but not in high-education occupations. In job zones 4 and 5 licensing produces mixed effects on over-education, implying inconclusive effects: both positive and negative estimates are found. In sum, only some of the original hypotheses about the effect of licensing on the quality of skill matches in the US labor market are empirically supported.
5. Concluding remarks
The empirical analysis suggests that licensing improves skill matches by reducing over-education by an estimated 3%–12% depending on the control group used. Such values are comparable to the 11% found by Guvenen et al (2020) on US panel data using a multidimensional measure of the skill mismatch.
Licensing emerges as benefiting US natives and those working in low-education licensed jobs. However, it raises over-education among immigrants, particularly if they have settled in the US for more than a decade. In a complementary analysis, we also find that licensing tends to raise the incidence of under-education, in direct contrast to one of its fundamental objectives. The results add to the view that the higher price/higher quality trade-off theoretically associated with licensing has a limited foundation across the full set of jobs covered by licensure. Rather, they point to licensing in the US as a source of labor market friction with at best mixed benefits in its current form.
Appendix
Figure 1. Occupational codes, by licensing status
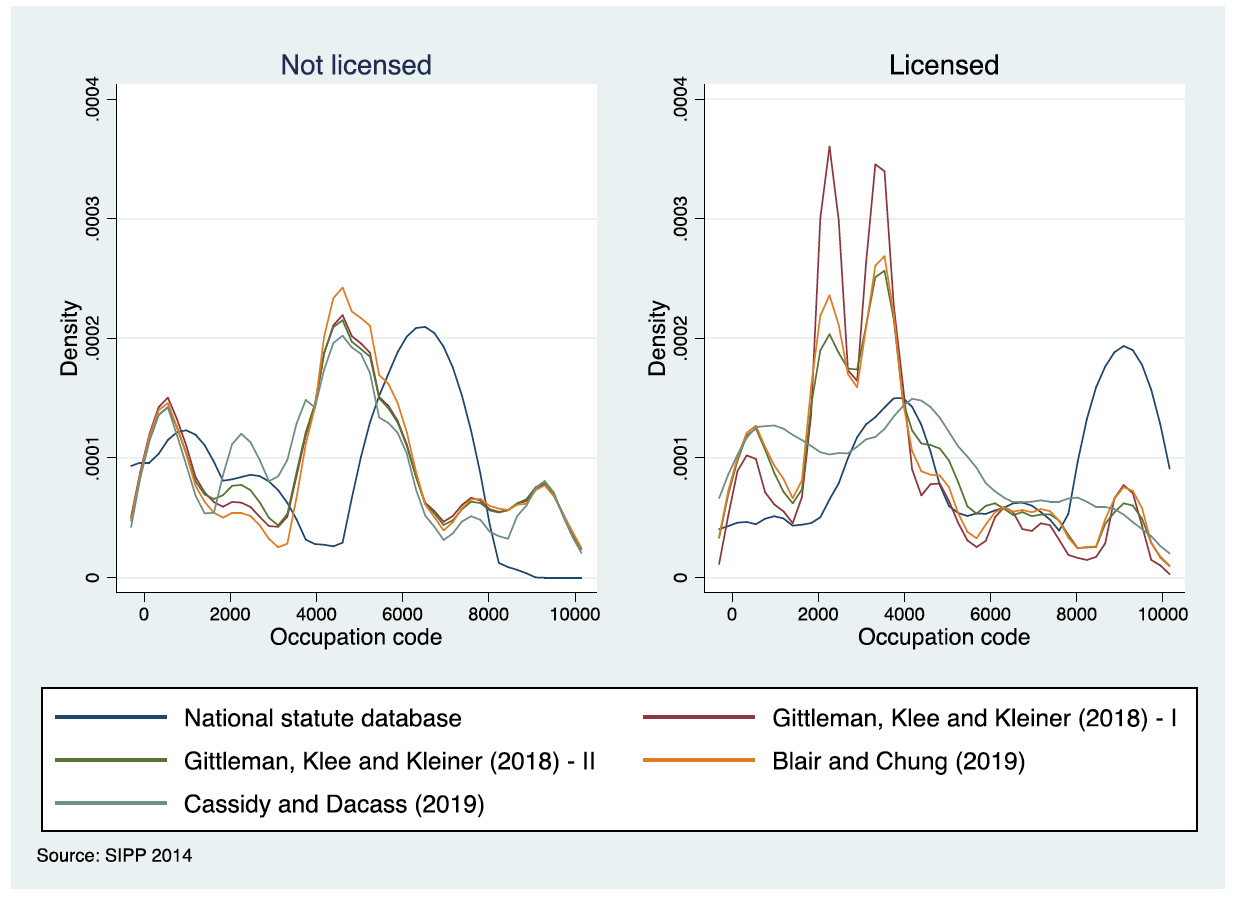
Figure 2. The share of skills mismatch by licensing status (over-education)
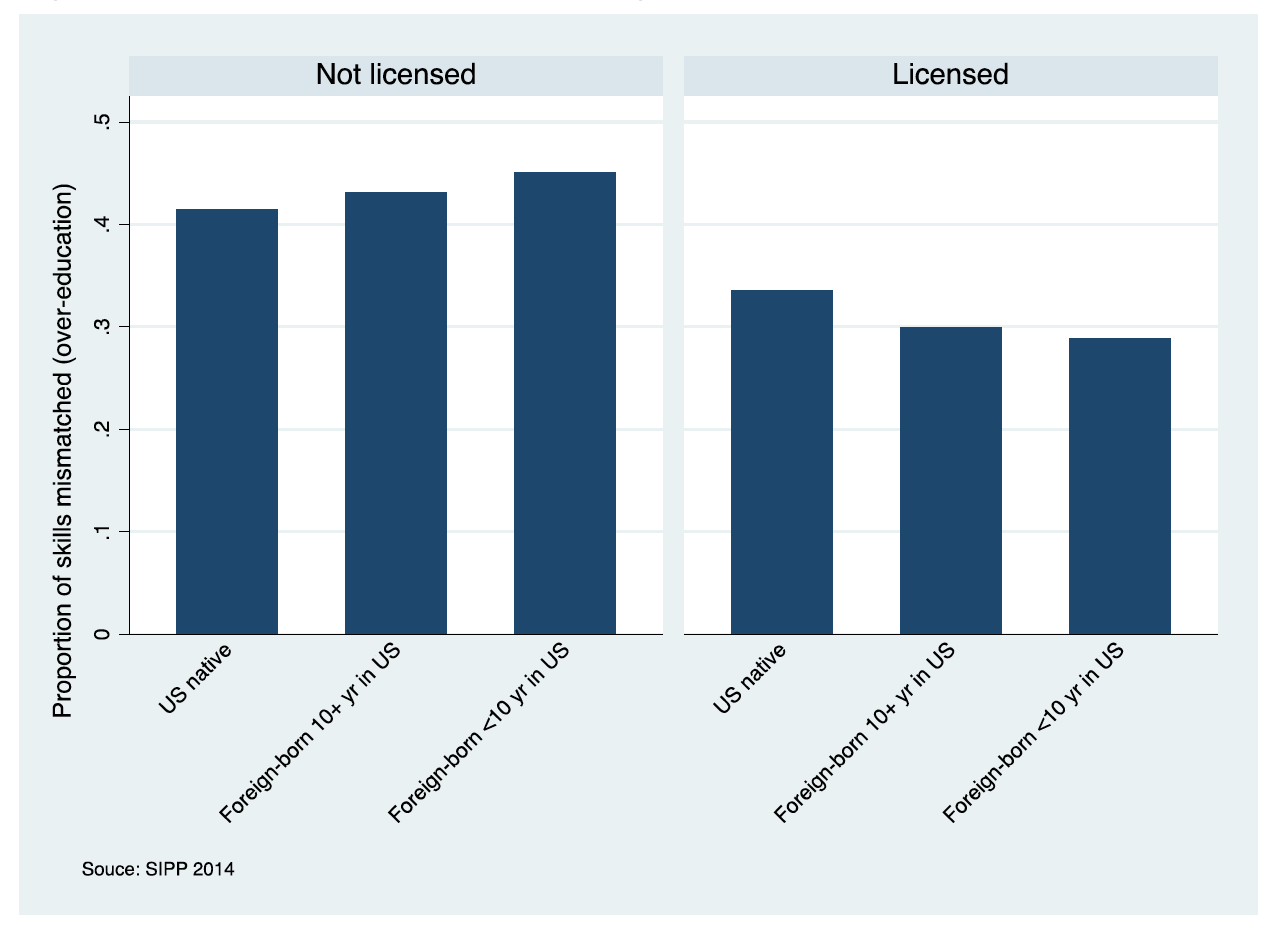
Table 1. Jobs with best/worst match (over-education), by job zone
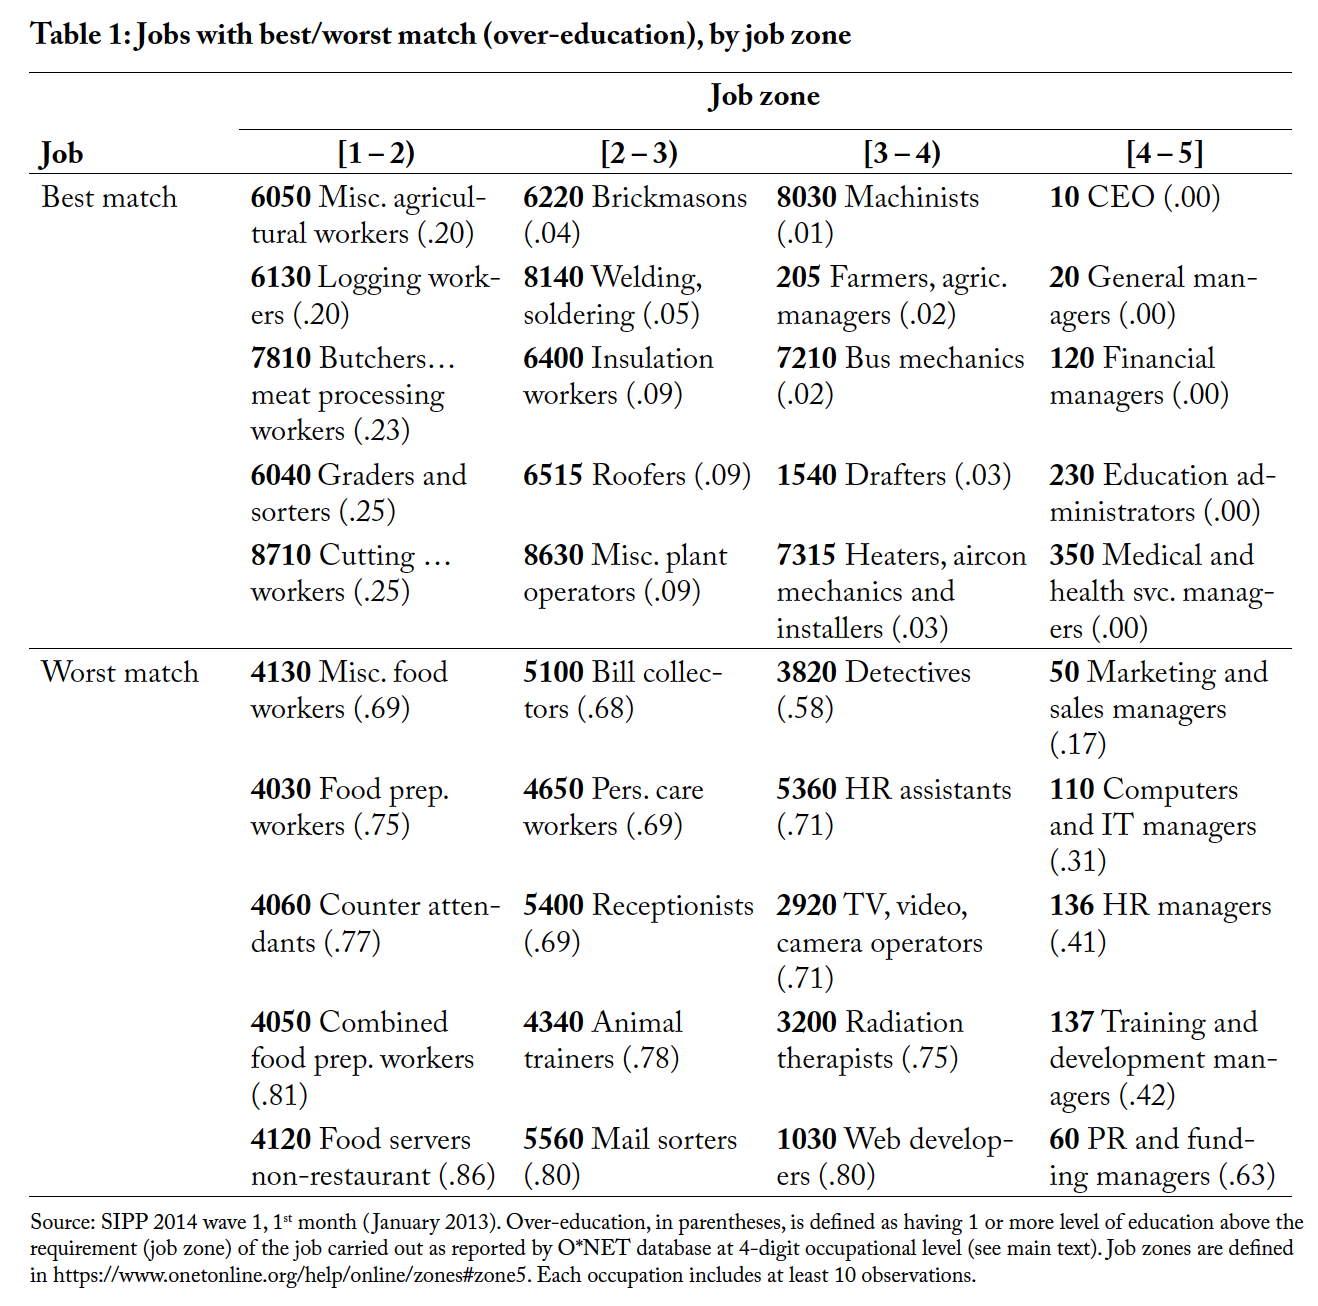
Source: SIPP 2014 wave 1, 1st month (January 2013). Over-education, in parentheses, is defined as having 1 or more level of education above the requirement (job zone) of the job carried out as reported by O*NET database at 4-digit occupational level (see main text). Job zones are defined in https://www.onetonline.org/help/online/zones#zone5. Each occupation includes at least 10 observations.
Table 2. Baseline working sample–Workers aged 18-64 as of January 2013
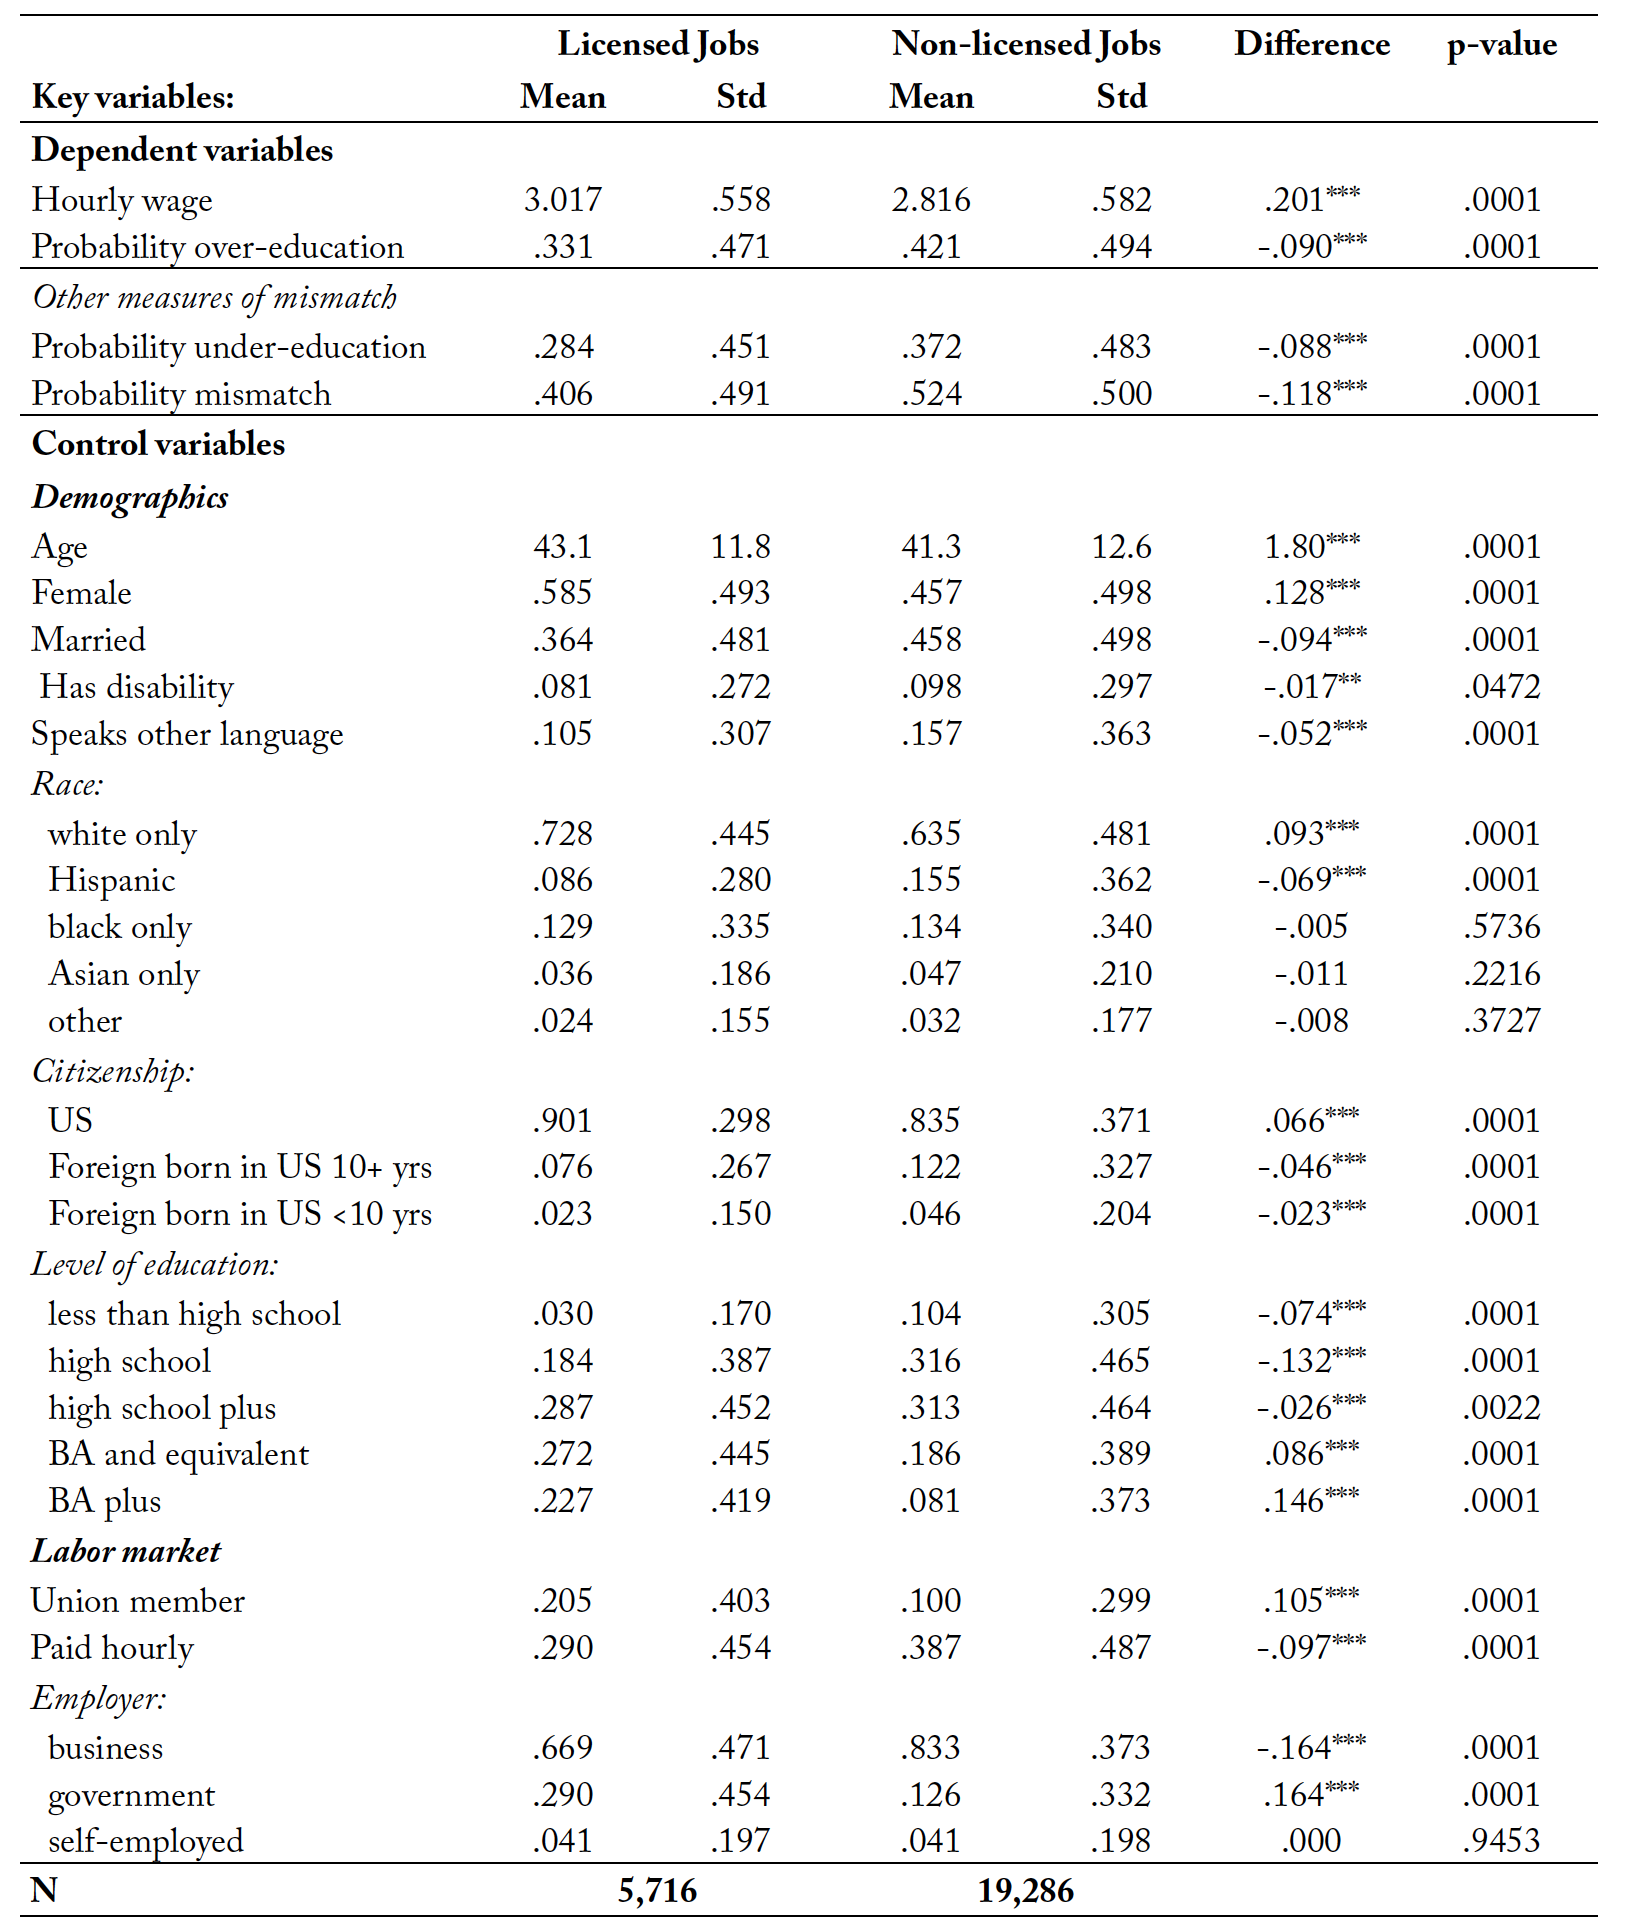
Source: SIPP 2014 wave 1, 1st month (January 2013). Licensing based on self-reported indicator of holding license issued by government using the 50-50 rule. The symbols *, **, *** indicate statistical significance at 10%, 5%, and 1%, respectively.
Table 3. OLS baseline case
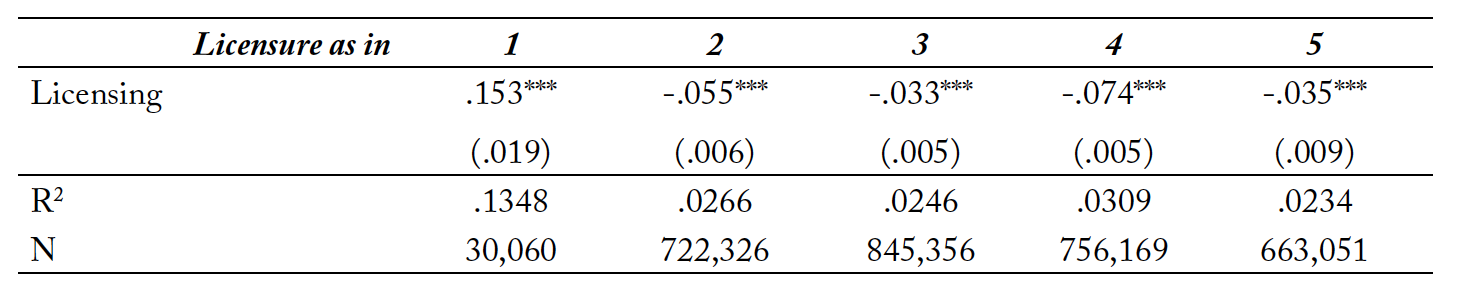
Source: SIPP 2014, 4 waves. OLS estimator applied to model (1’) in the main text. Sample restricted to workers aged 18–64 earning an hourly wage between $5 and $100. Controls include time fixed effects. Over-education is defined as having 1 or more level of education above the requirement (job zone) of the job carried out as reported by O*NET database at 4-digit occupational level (see main text). Job zones defined in https://www.onetonline.org/help/online/zones#zone5. Licensing is defined as in the following:
- National statute database: https://www.ncsl.org/research/labor-and-employment/occupational-licensing-statute-database.aspx;
- Gittleman-Klee-Kleiner I (2018): have a self-reported license in SIPP 2014 issues by federal, state or local government.
- Gittleman-Klee-Kleiner II (2018): have a self-reported license in SIPP 2014 (eprocert = ‘yes’).
- Blair and Chung (2019): have a federal, state, or local government license in SIPP 2014. Blair and Chung apply the 50-50 rule by occupation- state pairs.
- Cassidy-Dacass (2019): have a government license and use it for working. Based on topical module of SIPP 2008. Occupation-state pairs from SIPP 2008 are mapped into SIPP 2014 using the 50-50 rule and a 6-digit code.
Standard errors in parentheses. * p < .1, ** p < .05, *** p < .01.
Table 4. Selection on unobservables
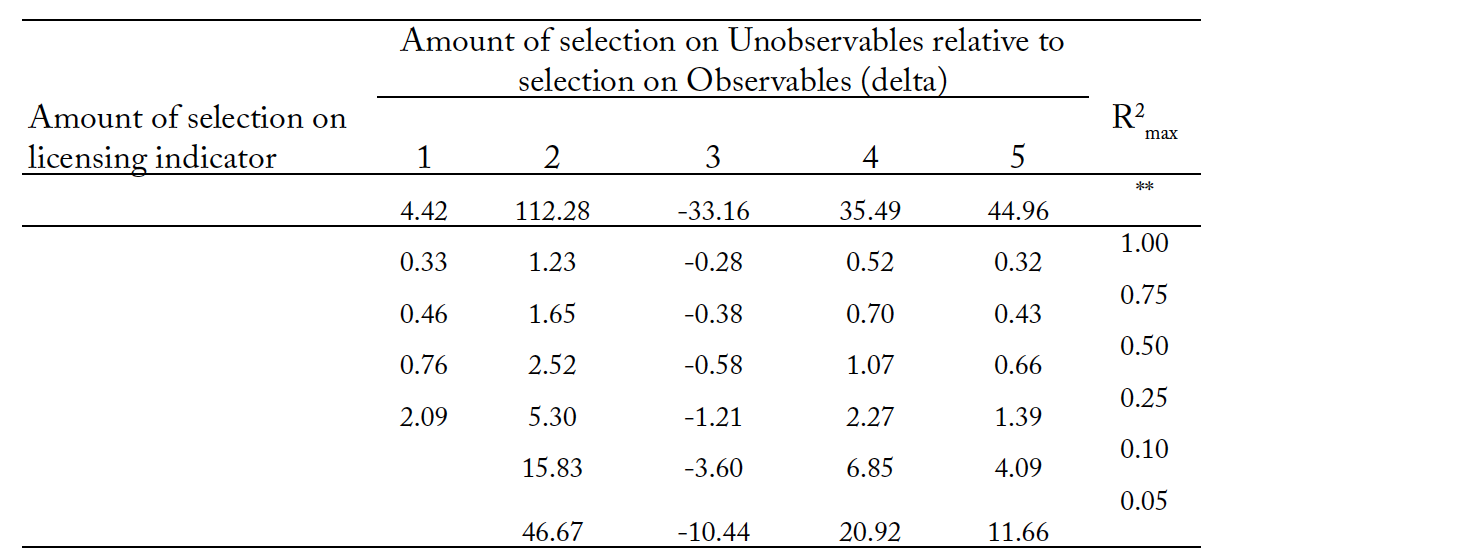
Methodology based on Oster (2019) and implemented using Stata’s command psacalc on OLS regressions based on model (1) and alternative dependent variables. Licensing is defined as in the following:
- National statute database: https://www.ncsl.org/research/labor-and-employment/occupational-licensing-statute-database.aspx;
- Gittleman, Klee, and Kleiner I (2018): have a self-reported license in SIPP 2014 issues by federal, state or local government.
- Gittleman, Klee, and Kleiner II (2018): have a self-reported license in SIPP 2014 (eprocert = ‘yes’).
- Blair and Chung (2019): have a federal, state, or local government license in SIPP 2014. Blair and Chung apply the 50-50 rule by occupation- state pairs.
- Cassidy-Dacass (2019): have a government license and use it for working. Based on topical module of SIPP 2008. Occupation-state pairs from SIPP 2008 are mapped into SIPP 2014 using the 50-50 rule and a 6-digit code.
**These values of R-squared are calculated as , where is from the various OLS regressions based on model (1’), and are as follows: 0.175 (licensing based on 1.), 0.036 (2), 0.033 (3), 0.041 (4), and 0.032 (5). A negative selection indicates a negative relationship between unobservables and observed covariates.
Table 5. Range of beta for given unobserved selection
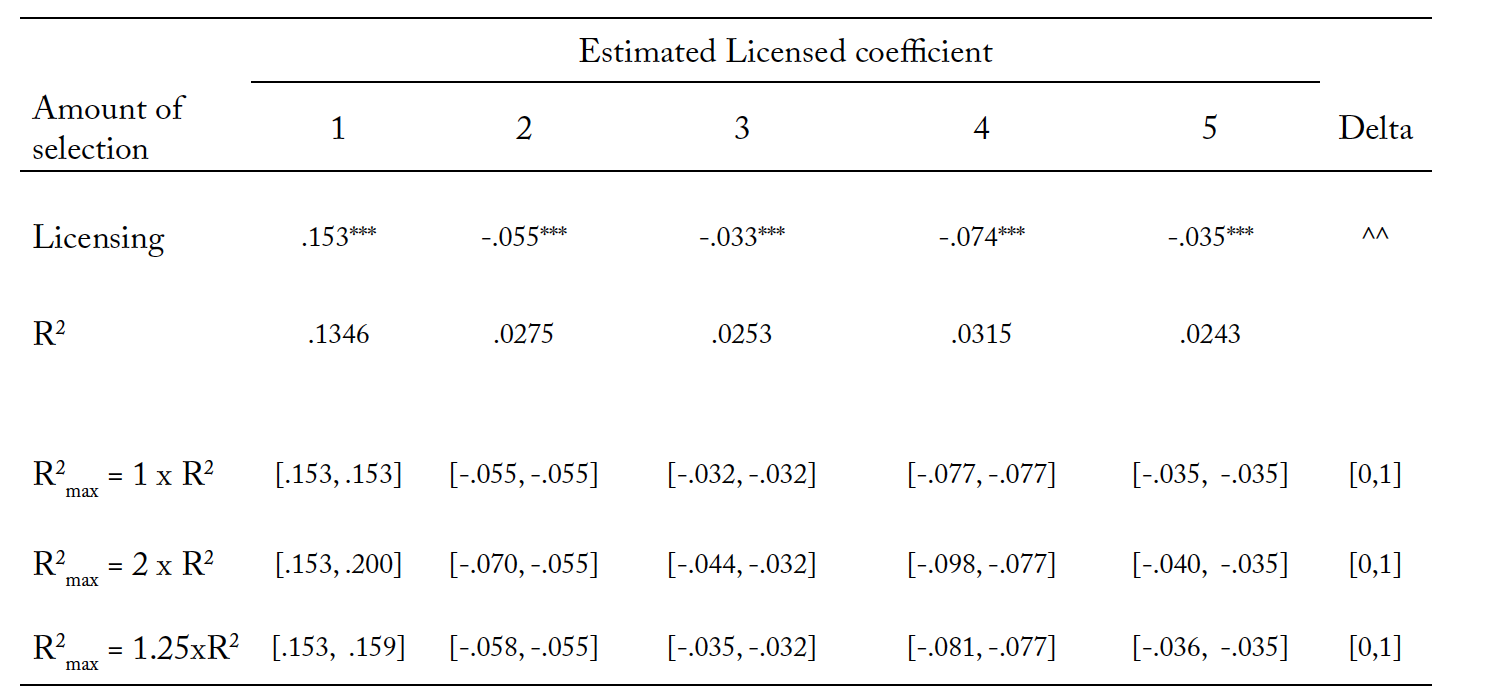
Methodology based on Oster (2019) and implemented using Stata’s command psacalc on OLS regressions based on model (1) and various dependent variables. Licensing is defined as in the following:
- National statute database: https://www.ncsl.org/research/labor-and-employment/occupational-licensing-statute-database.aspx;
- Gittleman, Klee, and Kleiner I (2018): have a self-reported license in SIPP 2014 issues by federal, state or local government.
- Gittleman, Klee, and Kleiner II (2018): have a self-reported license in SIPP 2014 (eprocert = ‘yes’).
- Blair and Chung (2019): have a federal, state, or local government license in SIPP 2014. Blair and Chung apply the 50-50 rule by occupation- state pairs.
- Cassidy-Dacass (2019): have a government license and use it for working. Based on topical module of SIPP 2008. Occupation-state pairs from SIPP 2008 are mapped into SIPP 2014 using the 50-50 rule and a 6-digit code.
^^Values of delta based on model (1) at the actual R2 and beta of the underlying OLS regression: 4.42 (licensing based on 1.), 112.28 (2), -33.16 (3), 35.49 (4), and 44.96 (5).
Table 6. The effect of licensure on over-education
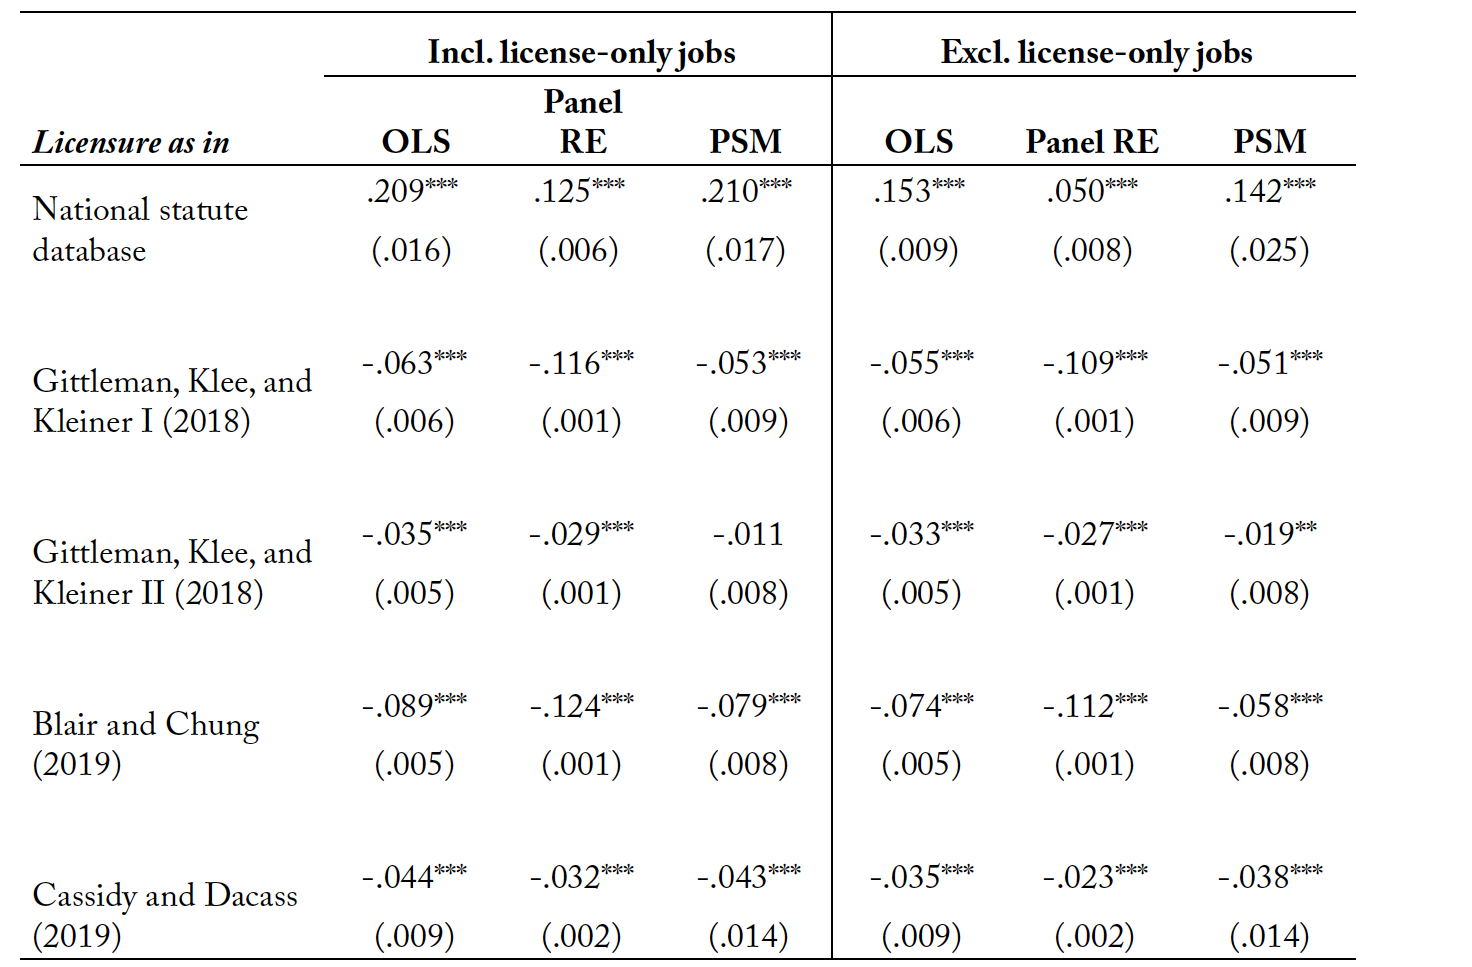
Source: SIPP 2014, 4 waves except for Propensity Score Matching, which is performed on SIPP 2014 wave 1, 1st month (January 2013). OLS and RE estimators applied to model (2) in the main text. Estimates obtained using PSM applying Stata’s teffects psmatch command. PSM based on gender, age, race, marital status, education level, immigration status, state of residence for workers in 18–64 age group earning an hourly wage between $5 and $100. Balance tests carried out by Stata’s command pstest always within the set maximum of B<.25 for matched observations. Sample restricted to workers aged 18–64 earning an hourly wage between $5 and $100. Over-education is defined as having 1 or more level of education above the requirement (job zone) of the job carried out as reported by O*NET database at 4-digit occupational level (see main text). Job zones defined in https://www.onetonline.org/help/online/zones#zone5. Licensing defined as in: National statute database – https://www.ncsl.org/research/labor-and-employment/occupational-licensing-statute-database.aspx; Gittleman-Klee-Kleiner I (2018): have a self-reported license in SIPP 2014 issues by federal, state or local government. Gittleman-Klee-Kleiner II (2018): have a self-reported license in SIPP 2014 (eprocert = ‘yes’). Blair and Chung (2019): have a federal, state or local government license in SIPP 2014 and applies the 50-50 rule by occupation-state pairs. Cassidy-Dacass (2019): have a government license and use it for working. Based on topical module of SIPP 2008. Occupation-state pairs from SIPP 2008 are mapped into SIPP 2014 using the 50-50 rule and a 6-digit code. Standard errors in parentheses. * p < .1, ** p < .05, *** p < .01.
Table 7. The effect of licensure on under-education
Source: SIPP 2014, 4 waves. OLS and RE estimators applied to model (2) in the main text. Sample restricted to workers aged 18–64 earning an hourly wage between $5 and $100. Under-education is defined as having 1 or more level of education below the requirement (job zone) of the job carried out as reported by O*NET database at 4-digit occupational level (see main text). Job zones defined in https://www.onetonline.org/help/online/zones#zone5.
Licensed defined as in: National statute database – https://www.ncsl.org/research/labor-and-employment/occupational-licensing-statute-database.aspx; Gittleman-Klee-Kleiner I (2018): have a self-reported license in SIPP 2014 issues by federal, state or local government. Gittleman- Klee-Kleiner II (2018): have a self-reported license in SIPP 2014 (eprocert = ‘yes’). Blair and Chung (2019): have a federal, state or local government license in SIPP 2014 and applies the 50-50 rule by occupation-state pairs. Cassidy-Dacass (2019): have a government license and use it for working. Based on topical module of SIPP 2008. Occupation-state pairs from SIPP 2008 are mapped into SIPP 2014 using the 50-50 rule and a 6-digit code. Standard errors in parentheses. * p < .1, ** p < .05, *** p < .01.
Table 8. Effects of licensing on over-education–RE estimator with Mundlak correction
Source: SIPP 2014, 4 waves. Jobs that are licensed or not licensed across the entire US are included. Random effects estimator applied to model (2) in the main text. Sample restricted to workers aged 18–64 earning an hourly wage between $5 and $100. Omitted controls include full set of age cohorts, state fixed effects, urban/rural dummy, and Mundlak correction terms. Over-education is defined as having 1 or more level of education above what is required by the job carried out. Minimum level of education for job carried out is obtained from O*NET database, as discussed in main text. Licensed defined as in: (1) National statute database – https://www.ncsl.org/research/labor-and-employment/occupational-licensing-statute-database.aspx; (2) Gittleman-Klee-Kleiner I (2018): have a self-reported license in SIPP 2014 issues by federal, state or local government; (3) Gittleman-Klee-Kleiner II (2018): have a self-reported license in SIPP 2014 (eprocert = ‘yes’). (4) Blair and Chung (2019): have a federal, state or local government license in SIPP 2014 and applies the 50-50 rule by occupation-state pairs. (5) Cassidy-Dacass (2019): have a government license and use it for working. Based on topical module of SIPP 2008. Occupation-state pairs from SIPP 2008 are mapped into SIPP 2014 using the 50-50 rule and a 6-digit code. Standard errors in parentheses. * p < .1, ** p < .05, *** p < .01.
Table 9: The effect of licensing on over-education, by licensure
Source: SIPP 2014, 4 waves. Random effects estimator applied to model (2) in the main text. Sample restricted to workers aged 18–64 earning an hourly wage between $5 and $100. Controls include Mundlak correction terms. Over-education is defined as having 1 or more level of education above the requirement (job zone) of the job carried out as reported by O*NET database at 4-digit occupational level (see main text). Low-education jobs include occupations in job zones 1–3; High-education jobs include occupations in jobs zones 4 and 5 (https://www.onetonline.org/help/online/zones#zone5 and also). Licensed defined as in:
- National statute database – https://www.ncsl.org/research/labor-and-employment/occupational-licensing-statute-database.aspx;
- Gittleman-Klee-Kleiner I (2018): have a self-reported license in SIPP 2014 issues by federal, state or local government.
- Gittleman-Klee-Kleiner II (2018): have a self-reported license in SIPP 2014 (eprocert = ‘yes’).
- Blair and Chung (2019): have a federal, state or local government license in SIPP 2014 and applies the 50-50 rule by occupation-state pairs.
- Cassidy-Dacass (2019): have a government license and use it for working. Based on topical module of SIPP 2008. Occupation-state pairs from SIPP 2008 are mapped into SIPP 2014 using the 50-50 rule and a 6-digit code.
Standard errors in parentheses. * p < .1, ** p < .05, *** p < .01.
Table 10. The effect of licensing on over-education, by job zone
Source: SIPP 2014, 4 waves. Random effects estimator applied to model (2) in the main text. Sample restricted to workers aged 18-64 earning an hourly wage between $5 and $100. Controls include Mundlak correction terms. Over-education is defined as having 1 or more level of education below the requirement (job zone) of the job carried out as reported by O*NET database at 4-digit occupational level (see main text). Job zones defined in https://www.onetonline.org/help/online/zones#zone5. Licensed defined as in:
- National statute database – https://www.ncsl.org/research/labor-and-employment/occupational-licensing-statute-database.aspx;
- Gittleman-Klee-Kleiner I (2018): have a self-reported license in SIPP 2014 issues by federal, state or local government.
- Gittleman-Klee-Kleiner II (2018): have a self-reported license in SIPP 2014 (eprocert = ‘yes’).
- Blair and Chung (2019): have a federal, state or local government license in SIPP 2014 and applies the 50-50 rule by occupation-state pairs.
- Cassidy-Dacass (2019): have a government license and use it for working. Based on topical module of SIPP 2008. Occupation-state pairs from SIPP 2008 are mapped into SIPP 2014 using the 50-50 rule and a 6-digit code.
Standard errors in parentheses. * p < .1, ** p < .05, *** p < .01.
References
Adalet McGowan, M., and Andrews, D. (2015). Skill mismatch and public policy in OECD countries.Paris: OECD.
Akresh, I. R. (2008). US immigrants’ labor market adjustment: Additional human capital investment and earnings growth. Demography, 44(4), 865–881.
Alba-Ramirez, A. (1993). Mismatch in the Spanish labor market: Overeducation? Journal of Human Resources, 28(2), 259–278.
Altonji, J. G., and Pierret, C. R. (2001). Employer learning and statistical discrimination. Quarterly Journal of Economics, 116(1), 313–350.
Banerjee, R. and Phan, M. (2014). Licensing requirements and occupational mobility among highly skilled new immigrants in Canada. Relations industrielles/Industrial Relations, 69(2), 290–315.
Batalova, J., Fix, M., and Pierce, S. (2020). Brain waste among US immigrants with health degrees: a multi-state profile. Migration Policy Institute ( July).
Beckhusen, J., Florax, R. J., Poot, J., and Waldorf, B. S. (2013). Attracting global talent and then what? Overeducated immigrants in the United States. Journal of Regional Science, 53(5), 834–854.
Blair, P. Q. and Chung, B. W. (2019). Job market signaling through occupational licensing. British Journal of Industrial Relations, 57(4), 919-943.
Borjas, G. J. (1991). Immigration and self-selection. In Immigration, trade, and the labor market (pp. 29–76).University of Chicago Press.
Büchel, F., and Mertens, A. (2004). Overeducation, undereducation, and the theory of career mobility. Applied economics, 36(8), 803–816.
Chamberlain, G. (1980). Multivariate Regression Models for Paned Data (No. t0008). National Bureau of Economic Research.
Chevalier, A. (2003). Measuring over-education. Economica, 70(279), 509–531.
Chiswick, B. R. and Miller, P.W. (2009). The international transferability of immigrants’ human capital.Economics and Education Review, 28, 162–169.
Dolton, P., and Vignoles, A. (2000). The incidence and effects of overeducation in the U.K. graduate labor market. Economics of Education Review, 19, 179–198.
Duncan, G. J., and Hoffman, S. D. (1981). The incidence and wage effects of overeducation. Economics of Education Review, 1(1), 75-86.
Duncan, B. and Trejo, S. (2009). Immigration and the US labor market. Cream discussion paper series No.08/09.
Eggleston, J. S., and Gideon, M. (2017). Evaluating wealth data in the redesigned 2014 survey of income and program participation. Social, economic, and housing statistics division working paper.
Farronato, C., Fradkin, A., Larsen, B., and Brynjolfsson, E. (2020). Consumer protection in an online world: an analysis of occupational licensing. NBER Working Paper No. 26601.
Federman, M. N., Harrington, D. E. and Krynski, K. J. (2006). The impact of state licensing regulations on low‐skilled immigrants: The case of Vietnamese manicurists. American Economic Review, 96, 237– 41.
Freeman, R. (1976). The Overeducated American. New York: Academic Press.
Gellhorn, W. (1976). The abuse of occupational licensing. University of Chicago Law Review, 44(6), 6–27. Gittleman, M., and Kleiner, M. M. (2016). Wage effects of unionization and occupational licensing coverage in the United States. ILR Review, 69 (1), 142–72.
Gittleman, M., Klee, M., and Kleiner, M. (2018). Analyzing the Labor Market Outcomes of Occupational Licensing. Industrial Relations 57, 57–100
Gomez, R., Gunderson, M., Huang, X. and Zhang, T. (2015). Do immigrants gain or lose by occupational licensing? Canadian Public Policy, 41(Suppl. 1), S80–97.
Guvenen, F., Kuruscu, B., Tanaka, S., & Wiczer, D. (2020). Multidimensional skill mismatch. American Economic Journal: Macroeconomics, 12(1), 210–44.
Halaby, C. N. (1994). Overeducation and skill mismatch. Sociology of Education, 67(1), 47–59.
Hartog, J. (2000). Over-education and earnings: Where are we, where should we go?. Economics of Education Review, 19(2), 131–147.
Ingram, S. (2019). Occupational licensing and the earnings premium in the United States: Updated evidence from the Current Population Survey. British Journal of Industrial Relations 57(4), 732–763.
Johnson, J. and Kleiner, M. (2020). Is occupational licensing a barrier to interstate migration? American Economic Journal: Economic Policy, 12(3), 347–373.
Kleiner, M. (2006). Licensing Occupations: Ensuring Quality or Restricting Competition. Kalamazoo, MI: W. Upjohn Institute for Employment Research.
Kleiner, M. and Bryson, A. (2019). Re-examining advances in occupational licensing research: Issues and policy implications. British Journal of Industrial Relations 57(4), 721–731.
Kleiner, M. and Krueger, A. (2013). Analyzing the extent and influence of occupational licensing on the labor market. Journal of Labor Economics 31, S173–S202.
Kleiner, M., and Kudrle, R. T. (1997). Does regulation improve outputs and increase prices?: The case of dentistry. NBER Working Paper No. 5869.
Kleiner, M. and Soltas, E. (2019). A welfare analysis of occupational licensing in U.S. states. NBER Working Paper No. 26383.
Kleiner, M., and Xu, M. (2019). Occupational licensing and labour market flexibility. SSRN paper: https://ssrn.com/abstract=3437136. Accessed 23 March 2020.
Kler, P. (2005). Graduate overeducation in Australia: A comparison of the mean and objective methods. Education Economics, 13(1), 47–72.
Kugler, A. D., and Sauer, R. M. (2005). Doctors without borders? Relicensing requirements and negative selection in the market for physicians. Journal of Labor Economics, 23(3), 437–465.
LaLonde, R. J., & Topel, R. H. (1992). The assimilation of immigrants in the US labor market. In Immigration and the work force: Economic consequences for the United States and source areas (pp. 67–92). University of Chicago Press.
Leland, H. E. (1979). Quacks, lemons, and licensing: A theory of minimum quality standards. Journal of Political Economy, 1328–1346.
Leuven, E., and Oosterbeek, H. (2011). Overeducation and Mismatch in the Labor Market. In Handbook of the Economics of Education (Vol. 4, pp. 283–326). Elsevier.
Madamba, A. B., and De Jong, G. F. (1997). Job mismatch among Asians in the United States: Ethnic group comparisons. Social Science Quarterly, 78(2): 524–542.
McGuinness, S. (2006). Overeducation in the labour market. Journal of Economic Surveys, 20(3): 387–418. McMillen, D. P., Seaman, P. T., and Singell Jr, L. D. (2007). A mismatch made in heaven: A hedonic analysis of overeducation and undereducation. Southern Economic Journal, 73(4), 901–930.
National Academies of Sciences, Engineering, and Medicine. (2018). The 2014 Redesign of the Survey of Income and Program Participation: An Assessment. National Academies Press.
National Center for O*NET Development (2008). Procedures for O*NET Job Zone Assignment. https:// www.onetcenter.org/dl_files/JobZoneProcedure.pdf. Accessed 23 March 2020.
Oster, E. (2019). Unobservable selection and coefficient stability: Theory and evidence. Journal of Business and Economic Statistics, 37(2), 187–204.
Peterson, B. D., Pandya, S. S., and Leblang, D. (2014). Doctors with borders: Occupational licensing as an implicit barrier to high skill migration. Public Choice, 160(1–2), 45–63.
Rivera-Batiz, F. L. (2007). How do migrants from Latin America and the Caribbean fare in the US labour market? World Economy, 30(9), 1399–1429.
Robst, J. (1995). Career mobility, job match, and overeducation. Eastern Economic Journal, 21(4), 539–550. Roy, A.D. (1951). Some thoughts on the distribution of earnings. Oxford Economic Papers, 3(2), 135–146. Rubb, S. (2003). Overeducation: a short or long run phenomenon for individuals? Economics of Education Review, 22(4), 389–394.
Rubin, D.B. (2001). Using propensity scores to help design observational studies: Application to the tobacco litigation, Health Services & Outcomes Research Methodology 2, 169–188.
Sicherman, N. (1991). “Overeducation” in the labor market. Journal of Labor Economics, 9(2), 101–122. Tani, M. (2018). Selective Immigration, Occupational Licensing, and Labour Market Outcomes of Foreign-Trained Migrants. IZA Discussion Paper No. 11370, 1–40.
Tani, M. (2017). Local signals and the returns to foreign education. Economics of Education Review, 61, 174–190.
Tani, M. (2014). Is the point system an effective policy instrument? Yes or no. IZA World of Labour. http://wol.iza.org/articles/using-a-point-system-for-selecting-immigrants. Accessed 23 March 2020.
Tsang, M. C. (1987). The impact of underutilization of education on productivity: A case study of the US Bell companies. Economics of Education Review, 6(3), 239–254.
Tsang, M. C., and Levin, H. M. (1985). The economics of overeducation. Economics of Education Review, 4(2), 93–104.
Warren, L. H., and Edwards, A. (2017). Poverty Dynamics in the 2014 Survey of Income and Program Participation. In November 2017 Meeting of the Southern Economic Association. Available at https://www.census.gov/content/dam/Census/library/workingpapers/2017/demo/SEHSD-WP2017-52.pdf.
White House (2015). Occupational licensing: A framework for policymakers. Report prepared by the Department of the Treasury Office of Economic Policy, the Council of Economic Advisers and the Department of Labor, 7.
Wiswall, M. (2007). Licensing and Occupational Sorting in the Market for Teachers. New York University, Working Paper.
Wooldridge, J. M. (2010). Econometric analysis of cross section and panel data. MIT press.
Zhang, T. (2019). Effects of occupational licensing and unions on labor market earnings in Canada. British Journal of Industrial Relations 57(4), 791–817.