
1 Introduction
The growing immigrant population in developed countries presents a complex landscape: while immigrants contribute to economic activity and add to cultural diversity, they also stir social and political tensions.1See, Dustmann et al. (2005), Card et al. (2012), Halla et al. (2017), Sequeira et al. (2020), Bazzi et al. (2023) and Calderon et al. (2023), among others. A less explored aspect of this demographic shift is the enfranchisement of immigrants or the lack thereof, a topic that has been recently gaining attention.2In the United States, noncitizen voting rights at the local/municipal elections exist in Vermont, Washington, DC, and Maryland, and they are under consideration in New York, Illinois, Maine, and Massachusetts (Ashford, 2022). Similar policies are also under discussion in Sweden and Switzerland. The inability of immigrants to vote results in their concerns being marginalized by politicians and provides fertile ground for xenophobic rhetoric. Meanwhile, naturalization—a potential gateway to integration (Hainmueller et al., 2017; Gathmann and Keller, 2018; Gathmann and Garbers, 2023)—remains a long and challenging process.3In September 2021, the US government processed immigrant applications for Mexican family-based visas filed in February 1999 and employment-based visas for skilled workers from India filed in January 2014 (Visa Bulletin, Number 57, Volume X, US Department of State). Adding complexity to the issue is the native population’s hesitancy to extend voting privileges before naturalization to immigrants. Such reluctance often stems from fears of losing political leverage and further compounds resistance to new immigration.
This paper explores the central question: how does the enfranchisement of immigrants recalibrate politicians’ stances in host countries? Politicians face a tough choice. On the one hand, addressing the needs of enfranchised immigrants might offer certain electoral gains given their distinct preferences. On the other, adopting pro-immigration stances may backfire, with the potential escalation of native hostility toward immigrants and a surge in populist sentiment (Barone et al., 2016; Halla et al., 2017; Dustmann et al., 2019; Edo et al., 2019). Further, the existing literature on politicians’ responsiveness to voters’ concerns finds instances of out-group prejudice juxtaposed with in-group favoritism (Butler and Broockman, 2011; Iyer et al., 2012; Butler, 2014). It remains unclear whether the enfranchisement of immigrants influences the political tenor of host countries.
The United Kingdom (UK) provides a unique context to answer this question. Unlike other nations that welcome immigrants, the UK grants immediate voting rights in all elections to those originating from Ireland and the Commonwealth—a set of nations historically intertwined with the British Empire—referred to as the enfranchised group. In contrast, migrants from nations outside this bracket must await UK citizenship before exercising similar democratic privileges (henceforth “disenfranchised”). I exploit within- and across-constituency variation in immigration from enfranchised and disenfranchised countries. To overcome the endogeneity in the location of immigrants, I use a shift-share instrumental variable (IV) approach, in which historical settlement across constituencies interacts with the overall migration inflow by the country (Card, 2009; Tabellini, 2020). The underpinning rationale remains that immigrants are inclined toward geographical clustering in their new homeland, with newcomers naturally gravitating toward areas that are densely populated by their ethnic counterparts.
I analyze the incumbent’s response to immigration using data on the universe of UK Parliament speeches and voting behavior on immigration bills between 1972 and 2011. These rich textual data aid in teasing incumbent sentiments with higher granularity. To find parliamentary speeches about immigrants, I use a dictionary-based approach. Quantitatively, I compute the fraction of parliamentary days per year where each member of Parliament (MP) talked about immigrants. Qualitatively, I estimate the sentiment score of those speeches using the valence norms associated with the speech text, where higher scores indicate positive sentiment. Last, I compute an average probability that an MP voted in favor of and against immigrants in amendments to the immigration bills tabled in Parliament.
I next investigate how the political discourse and voting patterns are influenced by the demographic changes caused by both enfranchised and disenfranchised immigrants within a constituency. I measure immigration as the changes in the fraction of foreign-born individuals over the constituency population. The foreign-born population is bifurcated into the enfranchised and disenfranchised groups, with the UK-born population identified as natives. The UK Parliament meets for about 155 days a year. On average, an MP talks about immigrants on 7.8 percent of parliament days (12 days). The average share of the foreign-born population is 8.8 percent, with 4.8 percent enfranchised and 4 percent disenfranchised.4Immigrants from India, Pakistan, and Bangladesh comprise 34 percent of the enfranchised group. European immigrants to the UK constitute 46 percent of the disenfranchised group. Source: Author’s calculations using censuses 1981, 1991, 2001, and 2011.
First, I analyze the effect on speeches. I find that a 1 standard deviation increase in the enfranchised immigration share of the population (equivalent to 5 percentage points) leads to a 1.4 percentage point increase in the share of parliamentary days on which MPs mention immigrants (an 18 percent, or a two-day, increase). The MPs also talk about immigrants positively: the valence norms increase by 0.22 standard deviations. The amplified speeches attributable to enfranchised immigration predominantly stem from the increased use of terms pertinent to immigrants from the enfranchised countries. In contrast, a 1 standard deviation increase in the disenfranchised immigration share leads to a 2.3 percentage point reduction in the share of parliament days on which MPs talk about immigrant issues. However, the sentiment is less positive: the valence norms decrease by 0.22 standard deviations.
Second, I analyze voting on bills. I find that a 1 standard deviation increase in enfranchised immigration leads to MPs being 12.3 percentage points more likely to vote for amending a bill against immigration (27 percent higher probability on a mean of 0.459). Additionally, they are 9.5 percentage points less likely to vote for amending a bill in favor of immigration. I find the opposite results for the MPs exposed to disenfranchised immigration.
I carry out several robustness checks to alleviate concerns about the identification strategy and threats to the exclusion restriction. I do not find differential pre-trends, and the two-state least squares (2SLS) results are robust to excluding ethnically close enfranchised immigrants (from Australia, New Zealand, Canada, and Ireland) and including controls for party vote shares, stock of immigrants, observable characteristics of immigrants, and the constituencies where MPs with ethnic-minority background contest. The data on parliamentary speeches are robust to excluding words related to future migrants. The results are robust to alternative versions of the estimation strategy, an alternative construction of the IVs, lagged immigration flows, and trends in baseline population shares, economic activity, and political conditions. In addition, I recover the effect of immigration shocks on outcomes through shift exposure as suggested by Borusyak et al. (2022).
I explain the opposite results in speeches and voting using politicians’ electoral benefits and costs and immigrants’ political engagement. An evaluation of data from the European Social Survey shows that enfranchised and disenfranchised immigrants share similarities in demographic and socioeconomic attributes. The historical connections do not make enfranchised immigrants more politically informed or trust UK institutions, and disenfranchised immigrants reported no feelings of discrimination stemming from voting restrictions. The political inclusion of immigrants makes MPs directly accountable for their representation. While addressing immigrant voters’ concerns can fortify politicians’ reputations, they face potential electoral repercussions from natives’ hostility, a sentiment reflected in data from the European Social Survey and studies like (Grossman and Zonszein, 2021, 2022). In the UK context, Blinder and Allen (2016) find that natives’ preference to reduce immigration goes as far back as the 1970s, and concerns are similar for both EU and non-EU immigration.
Analyzing the political attitude questions from the survey, I find that enfranchised immigrants display a 13.6 percent higher likelihood of sociopolitical participation than their disenfranchised counterparts. This divergence is not explained by English proficiency and is most pronounced among immigrants from robust democracies and those without UK citizenship. Meanwhile, these enfranchised immigrants also exhibit consistent election participation. Examining the electoral cost argument, I find that as MPs catered to immigrant interests, a section of natives gravitated toward alternate parties. Over time, constituencies with enfranchised immigration saw a decrease in vote shares for the Labour Party and an increase in vote shares for the other parties, particularly the Green Party and right-wing populist parties, without broad changes in political representation.
However, incumbents tread cautiously. Parliament discussions about immigrants decline in competitive constituencies and are higher in areas with a stronger Labour Party vote share. Incumbents, facing mounting electoral pressures, vote to curb future immigration and align with broader native preferences. Three findings support this. First, using survey data, I find that both types of immigrants are more open to future immigration than natives, even when they have UK citizenship. Second, the incumbents in tightly contested constituencies are more likely to vote to restrict future immigration. Third, incumbents in constituencies with a higher Labour Party vote share are more likely to amend the immigration bill to increase restrictions.
In the case of disenfranchised immigrants, there are no electoral benefits, and the natives’ hostility could explain their negative representation. In contrast, for the enfranchised immigrants, the electoral benefits and higher political engagement explain their positive representation in Parliament. An in-depth analysis of parliamentary speeches reveals that enfranchised immigration leads to a 30 percent increase in the share of parliament days on which incumbents have mentioned immigrants in petitions, private member bills, and questions to ministers. The parliament discussions are higher in constituencies with enfranchised immigration from stronger democracies, solidifying the role of political engagement in shaping narratives. However, voting patterns on immigration bills mirror native sentiments and do not vary across enfranchised immigration from strong or weak democracies.
My research resonates with the burgeoning literature on the political economy of immigrants examining the integration of migrants and its effect on the political landscape, particularly on the surge in populist sentiments (Abramitzky et al., 2012, 2014; Halla et al., 2017; Alabrese et al., 2019; Ricca and Trebbi, 2022). These works largely pivot on the premise that immigrants lack voting rights, with native
reactions spurred by perceived cultural and economic threats. Distinctively, I illuminate how enfranchised immigrants mold politicians’ stances and immigration policies in the host nation. A parallel narrative is shaped by Biavaschi and Facchini (2020), who exploit variation across US states regarding ballot access for foreign-born populations during the early 20th century. Their findings reveal that a more open migration policy garners support in contexts with significant numbers of naturalized US citizens, while this effect is inverted when enfranchisement is curtailed. My paper studies immigration in the contemporary UK, where the enfranchised immigrant population is small, the enfranchisement is independent of naturalization, and curbs on immigration primarily cater to native preferences.
Next, my work offers a fresh perspective on the enfranchisement literature. Seminal works by Acemoglu and Robinson (2000), Acemoglu and Robinson (2001), and Conley and Temimi (2001) postulate that elites expanded voting rights as a countermeasure to threats of revolution and social upheaval. However, the immigrant dynamics in my study differ from the disenfranchised native populations of the early 20th century. The influx rate of immigrants surpasses native population growth, generating demands for representative inclusion and amplifying native hostility. In this setting, curbing immigration becomes a strategy to consolidate power among the native majority and incumbent leaders, aligning with the interest convergence theory by Bell (1980). Moreover, a nascent literature on noncitizen enfranchisement in Europe (Ferwerda et al., 2020; Stutzer and Slotwinski, 2020; Koukal et al., 2021) probes native inclinations to grant voting rights to noncitizens. The UK emerges as an intriguing case study given that the enfranchisement decision was independent of the prevalent economic, political, and immigrant demographics.
Further, recent work analyzing political speeches has found that emotional rhetoric matters in the legislative arena (Osnabrügge et al., 2021; Ash et al., 2021; Card et al., 2022). For the British Parliament, the past literature predominantly spotlighted 19th- and 20th-century speeches (Eggers and Spirling, 2014; Spirling, 2016; Figueroa and Fouka, 2022; Hanlon, 2023). In contrast, I study how changes in population demographics due to immigration affect how politicians represent their constituents in the contemporary period. Last, existing research on politicians’ responsiveness to voters has mainly focused on one-time field experimental audit studies (Butler and Broockman, 2011; Iyer et al., 2012; Broockman, 2013; Nye et al., 2015; Gell-Redman et al., 2018) and find that legislators respond to those constituents with whom they share personal characteristics such as race and ethnicity. My paper analyzes legislator responsiveness in a nonexperimental, repeated interaction setting over three decades. I find that incumbents respond to even those constituents with whom they do not share their race and ethnicity.
2 Conceptual Framework
In this section, I unpack the microfoundations of the incumbent’s stance toward enfranchised and disenfranchised immigrants. Subsequent sections will test its empirical validity.
A segment of the native population perceives all immigrants as threats, both economically and culturally. Addressing immigrant issues might escalate electoral costs, especially with the emergence of populist parties, as noted by Barone et al. (2016), Halla et al. (2017), Dustmann et al. (2019), and Edo et al. (2019). This hostility is hypothesized to intensify with a rising immigrant count. Since addressing disenfranchised immigrants yields no direct electoral advantage, incumbents typically disregard their concerns. As the disenfranchised grow, the costs rise but benefits remain negligible and uncertain. Thus, the incumbents become increasingly adverse to rising numbers of disenfranchised immigrants.
Contrarily, addressing enfranchised immigrants can be electorally fruitful. However, incumbents risk alienating natives. The logic follows: it is beneficial to engage enfranchised immigrants if the benefits exceed the costs. With an enlarging enfranchised group, both the benefits and risks grow. For incumbents eyeing reelection, the challenge is to balance native and immigrant voter bases. Strategies might involve focusing on shared issues or minimizing native vote loss. One method might be curtailing future immigration—this might not align with immigrant views but could temper majority native antagonism. Thus, incumbents may respond to existing enfranchised immigrants positively as their population grows and simultaneously seek to restrict future immigration. Last, the electoral dynamics also hinge on the prevalent ideological climate. Some constituencies’ pro-immigration ideologies could bolster certain parties, while others might experience a divide.
3 Context: Enfranchisement in the UK
Uniquely, the UK permits certain noncitizens to vote in national elections, a distinction most nations reserve strictly for their citizenry. Notably, some nations have extended voting privileges to noncitizens yet often under tight conditions, either through supranational group agreements or bilateral pacts.5For instance, the European Union, a supranational group, often has multinational agreements allowing for some degree of voting rights reciprocity among member nations. However, the UK’s system is distinct in its enfranchisement of Irish and Commonwealth residents, allowing them voting rights across all governmental tiers immediately upon arrival.
Historically, the foreign-born noncitizen enfranchisement was not a consequence of their significant presence in the UK during the early 20th century. The expansion of voting rights in the 19th and early 20th centuries evolved from a limited group of property-owning men to all British Empire residents in Britain, culminating in the Representation of the People Act of 1928. Concurrently, 1921 saw Ireland become a self-governing dominion within the British fold. A mere five years later in 1926, the Commonwealth of Nations emerged as a voluntary political coalition, with its members pledging allegiance to the Crown and acknowledging each other’s equal stature (Balfour Declaration, approved at the Imperial Conference of 1926).
Over subsequent decades, most countries achieved independence from Britain, establishing their citizenship norms. However, UK-residing individuals from Ireland and the Commonwealth preserved their UK voting rights. In contrast, non-Commonwealth and non-Irish residents can only vote in all UK elections upon attaining UK citizenship. Intriguingly, the Commonwealth’s membership has been dynamic, with countries such as Pakistan, South Africa, Gambia, and the Maldives exiting and later reentering. Meanwhile, nations without historical ties to the British Empire, such as Cameroon, Rwanda, and Mozambique, have joined the Commonwealth and consequently gained voting rights in the UK. Broadly, changes in membership to the Commonwealth do not affect the voting rights of its residents in the UK.6Source: https://www.electoralcommission.org.uk/running-electoral-registration-england/
eligibility-register-vote/what-are-nationality-requirements-register-vote/can-a-commonwealth-citizen-register-vote.
Figure 1. Enfranchised Countries
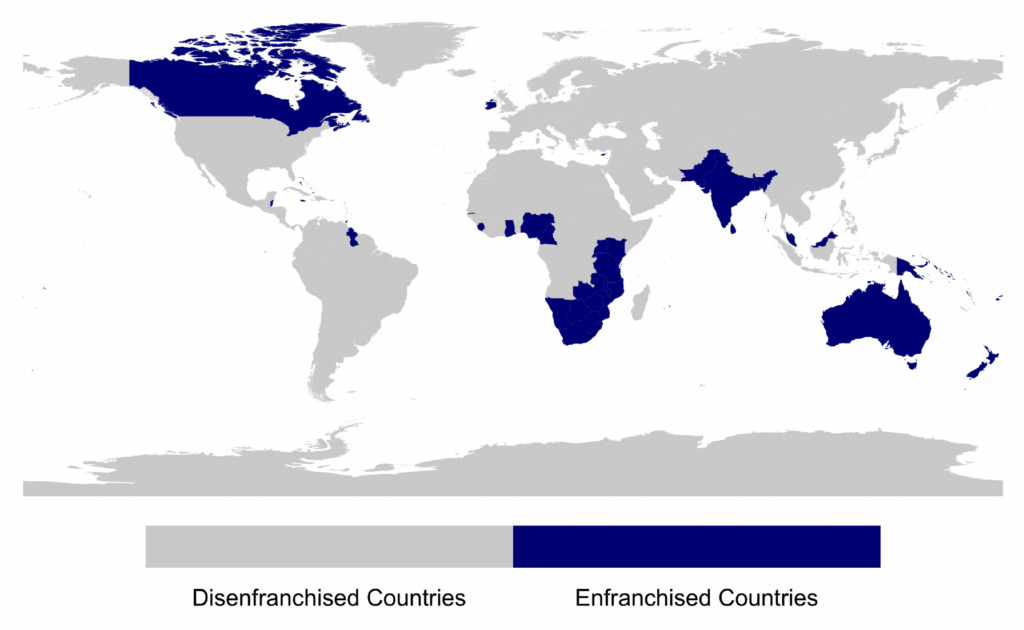
Notes: The map showcases countries whose residents have voting rights in the UK during my study period, based on Commonwealth membership. A complete country list is in Appendix Table A1. Data Source: https://www.gov.uk/register-to-vote and https://thecommonwealth.org/.
Figure 1 shows a world map of the countries, highlighting those whose UK-resident population can vote upon arrival. This enfranchised group exhibits vast diversity, encompassing both developed and developing nations. The Commonwealth currently boasts 54 member nations. The major immigrant-sending countries by region are the Pacific (Australia and New Zealand), Europe (Ireland, Cyprus, and Malta), the Caribbean and Americas (Canada, Bahamas, Dominica, Jamaica, and Barbados), Asia (Bangladesh, India, Pakistan, Malaysia, Singapore, and Sri Lanka), and Africa (Kenya, Nigeria, Uganda, and South Africa). A comprehensive listing of enfranchised nations, organized regionally, is available in Appendix Table A1.
General elections in the UK are theoretically scheduled every five years on the first Thursday of May, using the first-past-the-post voting system. In this system, voters from 650 single-member parliamentary constituencies select their preferred MP, usually from the two predominant parties: the Labour Party and the Conservative Party. Throughout its history, while the UK Parliament has frequently revised its immigration and nationality laws, voting rights for Commonwealth citizens remain unaltered. Notably, a 2008 report by Lord Goldsmith reviewed British citizenship laws and recommended limiting the right to vote in Westminster elections to UK citizens only. The report proposed to rectify the voting rights for noncitizens by phasing out the right of Commonwealth citizens to vote in general elections and confining the voting rights to citizens of those (few) countries that offer reciprocal rights. Despite this, the issue remains untouched, perhaps due to the reluctance of incumbents to alienate a segment of the noncitizen voters.
4 Data
4.1 Census Data
I extract data on foreign-born individuals from the 1981, 1991, 2001, and 2011 censuses, starting with the 1981 Census because it is the first occasion where disaggregated data on foreign-born individuals at the parliamentary constituency level are publicly accessible. Due to the lack of disaggregated data for Scotland and Northern Ireland at the constituency level, all census data-centric analyses presented in this paper focus exclusively on England andWales, which constitute approximately 89 percent of the UK’s population.
The 1981 Census demarcates the foreign-born population into nine categories, consisting of seven subgroups for the enfranchised population: the old Commonwealth (Australia, New Zealand, Canada), East Africa and Other Africa, India, Pakistan, Bangladesh, the Caribbean, and New Other (Cyprus and Far Eastern Colonies). In contrast, the disenfranchised population encompasses Europe and the rest of the world. In subsequent censuses of 1991, 2001, and 2011, there was an increase in the number of subdivisions of the foreign-born population compared to the 1981 Census. A comprehensive mapping of individual country groups throughout these census years is provided in Appendix Table A2. In this paper, the term “immigrants” refers to the foreign-born population.
While county borders have largely persisted during the study’s time frame, the Boundary Commission adjusted intracounty parliamentary constituency boundaries in 1974, 1983, 1997, and 2010. To achieve temporal comparability, I use publicly available data to align the parliamentary constituencies with their parent units, conducting my analysis on these unaltered constituency units. The parliamentary constituencies in England and Wales went from 570 to 192 upon adjusting for consistency. Given the disparity in the count of constituencies amalgamated to constitute a consistent unit, I construct all the variables as a weighted average by the constituency’s electorate size.
Two illustrative examples elucidate the method used to devise stable constituency units. In Warwickshire County’s context (example 1), boundary revisions necessitated the treatment of the entire county as a singular unit. Table A3 provides the chronology of each constituency’s inception and termination, along with its predecessor and successor constituencies. Figure A1 visually represents these boundary alterations. For Somerset County (example 2), despite boundary adjustments, three primary units were discernible among the seven constituencies observed over this period. Boundary shifts are visually represented in Figure A2, with Table A4 elaborating on the specifics of the changes induced by the delimitation commission in 1983 and 2010.
4.2 European Social Survey
Drawn from 28 European nations, the European Social Survey offers a repeated cross-sectional, individual-level perspective on socioeconomic and political values. Between 2002 and 2018, nine biannual survey cycles were executed. The survey’s distinct advantage over other data sets lies in its comprehensive documentation of respondents’ country of birth, enabling the precise identification of immigrants from the two groups. For this study’s purpose, I harness the UK-specific segment of the survey, centering my analysis on respondents born outside the UK.
4.3 Hansard Parliament Speeches
The UK Parliament furnishes the entirety of individual legislative discourse verbatim through Hansard.7https://hansard.parliament.uk. I web scraped Hansard for the years spanning 1972 to 2011 from the House of Commons, the elected legislative chamber. These data amalgamate proceedings of the House of Commons, written ministerial statements, petitions, divisions, and proceedings from both the Commons General Committees and the Public Bill Committees.
For each parliament sitting (day), Hansard catalogs the MP’s name, the speech’s full text, and the broad topic and the subtopic. A single parliamentary day typically unfolds as a series of deliberations on various topics by MPs. I define a parliament speech as the complete speech text for each MP within each broad topic and subtopic on a given parliament day. A representative structure for discerning individual speeches amid these deliberations can be seen in Table A5, with Table A7 offering illustrative excerpts from Hansard’s recorded speeches. Some speeches have a broad topic and a subtopic, while others have a broad topic. Aggregated, the data set encompasses text from 7,436 parliamentary days, totaling around three million distinct speeches.
I match the MP’s name to their parliamentary constituency using information from TheyWorkForYou,8https://www.theyworkforyou.com/. and I map the parliament days to the parliament sessions (via the general election cycle). Overall, I can match 95 percent of the parliament speeches to a constituency. Discrepancies in achieving a full match often arose from ambiguities in common speaker names (e.g., Mr. Smith) to a unique constituency. Within the subsample of data relevant to my analysis (i.e., the speeches about immigrants), the match rate is 97 percent.
4.4 Construction of the Outcome Variables
To understand how MPs talk about immigrants in Parliament, I curate a subset of relevant speeches using a dictionary-based methodology, that is, using words commonly used in the literature to extract speeches about immigrants and constituency (Saalfeld, 2011; Geese et al., 2015; Slapin et al., 2018; Slapin and Kirkland, 2020). Key terms, in essence, encompass the following: immigra*, migra*, foreigner*, asylum*, refugee*, and minorit*. These lexemes filter out parliamentary speeches mentioning immigrants. To distill a granular measure of individual MP speeches tailored to their constituencies, I specifically harness those speeches combining terminologies of both immigrants and constituencies.9For an exhaustive lexicon, refer to Appendix Table A8, which clusters terms under overarching themes: immigrants, visa and nationality, enfranchised nations, disenfranchised nations, refugees, and constituency. Next, I compute three types of outcome variables for each constituency unit and year.
First, I calculate a quantitative measure of speeches. This metric assesses the proportion of yearly parliament days where an MP spoke about immigrants. I call this outcome variable Discussions. One might also think of other quantitative measures such as the volume of the parliament speeches or simply the count of speeches per parliament day or per speech day about immigrants. Owing to the restrictive time frame that MPs possess to vocalize their stances, I focus on the share of speeches about immigrants per year.
Second, I compute the qualitative measures of speeches via sentiment analysis. This measure is conditional on MPs speaking about immigrants. I harness the valence norms advanced by Warriner et al. (2013), a compendium offering valence scores for roughly 14,000 words, graded on a 1–9 scale. The valence score tells us the pleasant emotion conveyed by a word, with higher numbers indicating more positive sentiment. I start by removing the punctuation and converting all the text to lowercase. A subsequent lemmatization phase, aided by the Natural Language Toolkit’s WordNet Lemmatizer (Bird et al., 2009), optimally distills words to their rudimentary forms. Finally, I compute the valence score by taking the mean valence rating of all words in individual speech.
Third, I calculate an average probability of voting on all bills in a given census year. I follow DEMIG (2015) to obtain a list of all acts proposed in the UK Parliament related to immigration during my time period of study.10Table A9 annotates these bills, summarizing them and pinpointing target demographics. The voting on amendments to the bills could be pro- or anti-immigration, depending on the current draft of the bill. I classify the proposed amendment to the bill either in favor (pro-immigrants) or against (anti-immigrants) by hand coding the speech of the MP who started the amendment. I capture the names of MPs who voted in favor (“ayes”) or against (“noes”) those amendments, where ayes would imply voting to amend and noes implies voting to maintain the status quo on the bill. Thus, I measure two outcome variables: amendments in favor and against immigrants on bills tabled in Parliament.
I then analyze the electoral outcomes between the 1970 and 2010 general elections using the election results from the Commons Library research briefings.11Source: https://commonslibrary.parliament.uk/research-briefings/cbp-8647/. The data set includes party-wise vote distribution, turnout, and electorate size for each constituency. I redefine these variables for the 192 parent constituency units using a weighted average by the electorate size of the constituencies. Table A6 provides a mapping of general election dates to census years. There have been 11 general elections in the UK during my study period, all scheduled in the five-year interval.
5 Empirical Framework
5.1 Main Estimation Equation
My research question is, Does enfranchised immigration affect MPs’ speeches and voting related to immigration bills? I employ a constituency-level difference model to answer this question due to the slow changes in my outcome variables over time (Appendix Figure A3) and the six-year waiting period for immigrants to apply for citizenship. My outcome variables are parliament debates and voting (details on the construction are available in Section 4.4). My explanatory variables are enfranchised and disenfranchised immigration. I measure immigration (migration flow) in census year  as a change in the stock of foreign-born population between the census years and
  . Immigration is calculated separately for the foreign-born population from enfranchised and disenfranchised countries.
I regress the change in the outcome in constituency  between years and
  (
( ), on the change in the share of the foreign-born enfranchised population (
 ) and the foreign-born disenfranchised population (
 ) between the census years. The immigration between census year and is mapped to the outcome variables between years and
  . Since the constituency population could be an outcome of immigration, the number of immigrants from each group is scaled by the baseline constituency population (1981 Census).
(1) 
where  represent period fixed effects to account for time-specific characteristics that are similar across constituencies and affect the outcome variable, for example, election years.
  represents the region fixed effects controlling for regional time trends in a levels specification.12England and Wales are divided into 10 regions. A region contain 19 constituencies, on average. Since I am estimating long differences, my specification implicitly accounts for constituency fixed effects and eliminates any time-constant constituency-specific characteristics that may affect the outcome variables and the immigrant allocation in the same way.
  controls for differential trends across municipalities with different initial constituency characteristics (see Section 5.3 for a discussion of these variables). The coefficient of interest,
  , estimates the effect of changes in the fraction of enfranchised immigrants within a constituency over time. This is compared to other constituencies within the same region in a given year, while controlling for changes in the fraction of disenfranchised immigrants. I cluster standard errors at the constituency level.
Consistency of requires that immigration from the enfranchised group () and the disenfranchised group () is strictly exogenous in Equation (1); that is, E( ) = 0 and E(
 ) = 0. A priori, constituencies with MPs more liberal on immigration (enfranchised, disenfranchised, or both) might attract more immigrants, which could bias the coefficient upwards. The reverse can also be true; an influx of immigrants might lead to political movements that influence how MPs speak and vote, and MPs might take a harder stance on immigration, biasing the coefficients downwards. In any case, the endogeneity of and as well as omitted variables will likely make ordinary least squares (OLS) estimates of Equation (1) biased.
5.2 Leave-Out Shift-Share Instrument
To address the endogeneity issue, I construct a modified version of the Bartik instrument (Card, 2001), in which the shifts are assumed to be exogenous (Borusyak, Hull, and Jaravel, 2022). The instrument combines immigrant shares of the different groups in 1981 with subsequent aggregate shocks of immigrants, excluding individuals that eventually settled in a given constituency. Formally,  , where
  is instrumented with
(2) 
where  is the baseline constituency population (where
  ) and
) and  is the share of individuals from country group
  (for each
  ) living in constituency in 1981.
  is the number of immigrants from country group who entered the UK between census years and
  , net of those who eventually settled in the constituency.
I use this leave-out strategy so that local area changes do not contaminate the instrument (similar to Burchardi, Chaney, and Hassan (2019) and Tabellini (2020)). As a robustness check, I also estimate the leave-out instrument at the county level to eliminate any concerns about immigrant pull factors that might be correlated across constituencies within a county.13The 192 parliamentary constituencies of England and Wales are divided into 43 counties. The instrument exploits time-series variation in immigrants entering the UK from the two groups in a given decade and a cross-sectional variation in the share of immigrants from country group living in different constituencies in 1981.
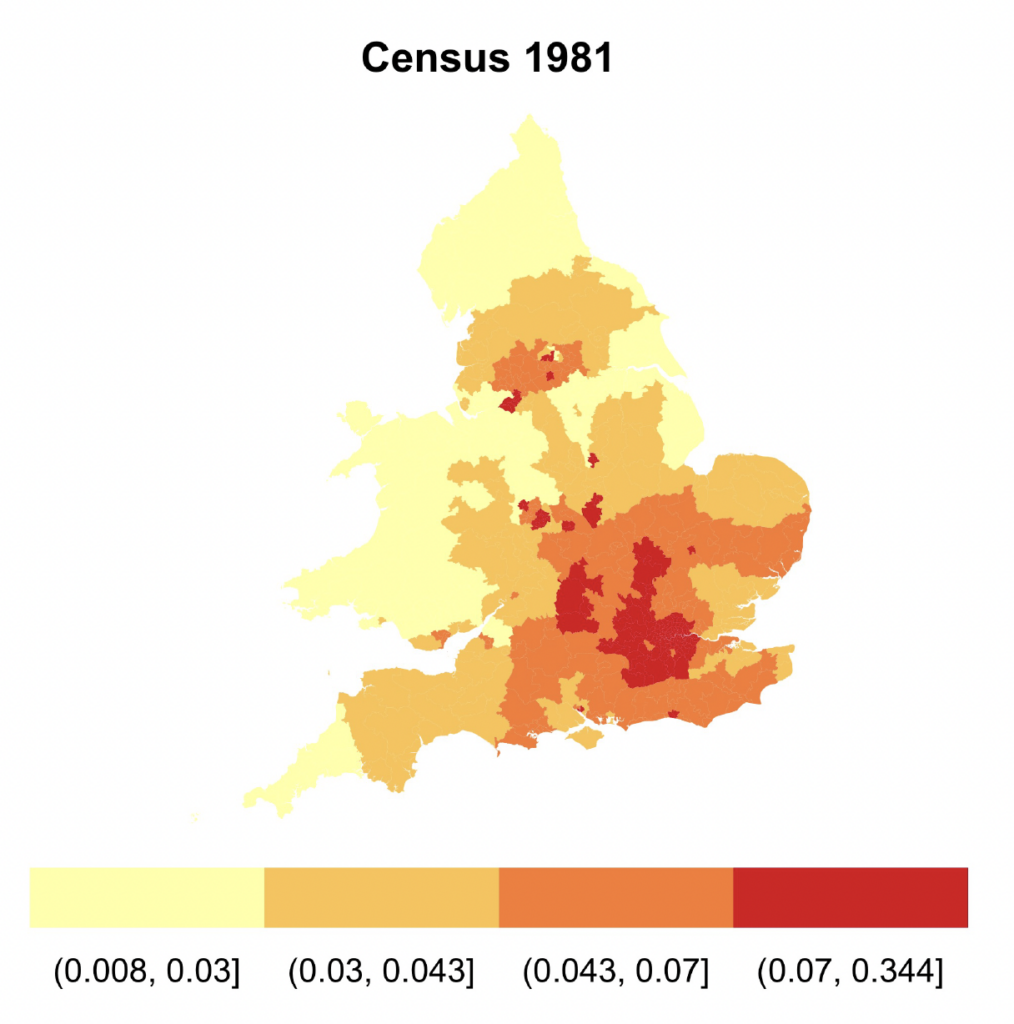
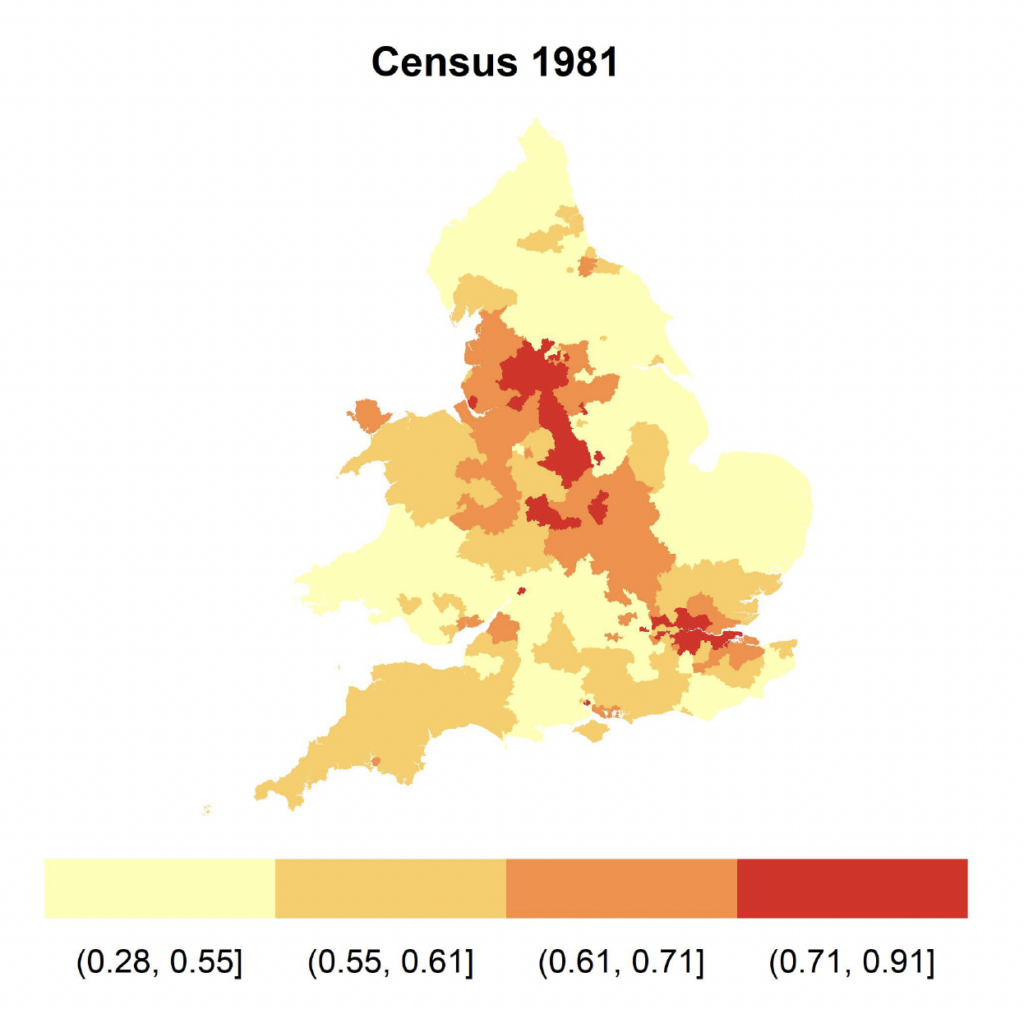
Figure 2 shows the spatial variation (across- and within-constituency) in the share of the foreign-born population and the share of the enfranchised foreign-born population across the 192 constituencies using the 1981 Census. Panel (a) plots the share of the foreign-born population over the total population, divided across quartiles. The London, Birmingham, and Oxford areas have the highest proportion of this population, while constituencies farthest away from these areas have the lowest. Panel (b) plots the share of the enfranchised foreign-born population over the total foreign-born population across quartiles. A given constituency may have a large fraction of the foreign-born population and a large part of that fraction might be enfranchised. Simultaneously, a constituency might have a small proportion of the enfranchised foreign-born population.
5.3 Identification Assumptions
Since most new immigrants tend to settle in places where existing immigrants live, the endogenous variables and the shift-share instrument are directly correlated. Next, the instrument and the error term should not be correlated conditional on the observable covariates. That is, the constituencies that received more immigrants before 1981 must not be on different trajectories of the evolution of economic and political conditions in the subsequent decades. I test the validity of these two identifying assumptions in the following section.
Figure 2. Distribution of Immigrants
(a) Share Foreign-Born
(b) Share Enfranchised Foreign-Born
(c) Share Immigrants over time
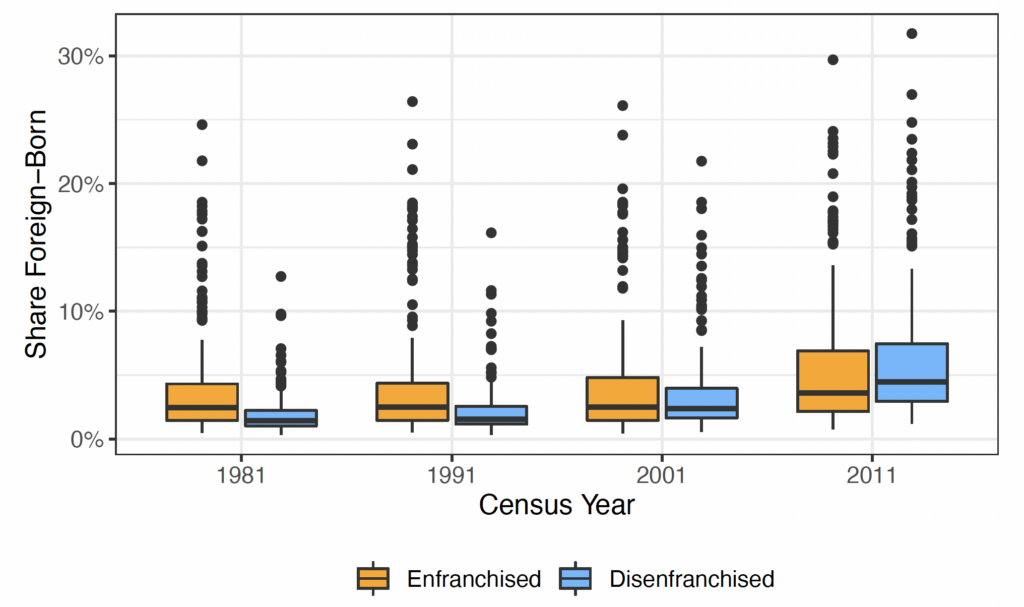
Notes: Panels (a) and (b) from the 1981 Census depict the quartile distribution of immigrants in England and Wales. Panel (a) represents the foreign-born percentage of the total population, while panel (b) shows the enfranchised foreign-born percentage of all foreign-born individuals. Panel (c) presents the shifts in the foreign-born ratio over the 1981, 1991, 2001, and 2011 censuses, segmented by enfranchised and disenfranchised groups using a box plot. Data source: UK Census, 1981–2011.
First, I examine if larger immigrant stocks before 1981 had an independent and time-varying effect on the political or economic conditions in the future periods. I control for the 1981 population shares of the different country groups in my main specification to account for linear trends in the initial distribution of immigrants. The aim is to test if specific immigrant groups (e.g., from India or Bangladesh) were more likely to settle in particular areas to influence the local political and economic conditions by holding the differences within the immigrant-sending country group constant.
Second, there may also be concerns about the exclusion restriction. For example, immigration affects local political movements, such as the rise of a populist party or ethnic-minority candidates contest in the elections. These movements can affect the speeches and votes of MPs. To control for this, I include time-varying economic characteristics of the immigrants, vote shares of parties, a dummy if MPs with an ethnic-minority background contest in the elections, and immigrant stocks as additional controls.
Third, Jaeger, Ruist, and Stuhler (2018) suggests that the instruments might be vulnerable to bias from the dynamic adjustments to past shocks. I include lagged immigrant inflows in the model and instrument with a lagged version of the instrument. This isolates the variation in inflows uncorrelated with current local demand shocks and the adjustment to past supply shocks. Additionally, I test if the initial economic conditions had a time-varying effect on the economic conditions across constituencies by augmenting my baseline specification with the 1981 economic characteristics, such as the share of the economically active population, the fraction of employment by industry (agriculture, manufacturing, construction, etc.), and pre-period population shares.
Fourth, in my context, I allow the initial population shares of the country groups to be endogenously distributed, and the identification follows from the quasi-random assignment of shocks. One may worry that shocks are not randomly assigned. To alleviate this concern, I carry out a placebo regression where I directly test if pre-period changes in the quantity and quality of discussions about immigrants are uncorrelated with subsequent immigration changes predicted by the instrument. In addition, following Borusyak, Hull, and Jaravel (2022), I show a similar inference using the transformed IV regression estimated at the level of shocks that has a numerical equivalence to the shift-share IV regression.
5.4 Individual Surveys
Using the European Social Survey, I analyze the differences between immigrants from the enfranchised and the disenfranchised groups. I estimate the following linear regression:
(3) 
where  is the outcome variable for individual
  residing in region
  surveyed in the survey round year
  The
The  coefficient captures the average differences in the outcome variable for respondents between the two groups after accounting for individual controls (
 education level, employment status, and life satisfaction) as well as region () and time fixed effects (). I use post-stratification and population weights on my estimates to account for the sampling error and the nonresponse bias.
6 Results
6.1 Summary Statistics
Figure 2, panel (c) provides a visual representation of the proportion of enfranchised and disenfranchised foreign-born populations within constituencies over different census years. Displayed as a box plot, the interquartile range is shown by the box’s span, and the median is denoted by the black line contained within. A salient observation from this figure is the absence of dominance by either the enfranchised (illustrated in orange) or the disenfranchised (depicted in blue) groups during any specific census period. By 1981, both categories of immigrants make up a modest 2 to 3 percent of the total population. This figure slightly increases by the 2011 Census, where the average of both groups is around 6 percent. Although a few outlier constituencies, represented in black dots, exhibit a large share of immigrants, they are few and display a balanced representation of both the enfranchised and disenfranchised groups.
Table 1 delves deeper, offering a numerical breakdown of the variables employed in the data analysis. A typical constituency housed an average of 274,000 individuals, with foreign-born citizens comprising roughly 8.8 percent of this number. When further segmented, the enfranchised and disenfranchised foreign-born populations accounted for an average of 4.8 percent and 4 percent, respectively. Between 1981 and 2011, the UK Parliament convened for an average of 155 days annually, with the number of days fluctuating between a minimum of 125 and a maximum of 178. MPs, on an average basis, spoke on 53 percent of these parliamentary days. Within these discussions, immigrant concerns featured on approximately 7.8 percent of the days. The sentiment scores, conditional on the issues being discussed, indicate that the mean sentiment score for immigrant-related speeches across constituencies in a particular year was 5.6. Voting patterns further reveal that 52 percent of MPs were inclined to support amendments beneficial to immigrants, whereas 46 percent voted against them in Parliament.
The F-statistics are presented at the bottom of all tables with 2SLS estimation. The Kleibergen-Paap F-stat, denoted as the KP F-stat, offers an assessment of weak instruments. Simultaneously, F-stat (Enf) and F-stat (DisEnf) represent the Sanderson-Windmeijer partial F-stats that gauge the joint significance of the instruments in two distinct first-stage regressions. Figure 3 graphically depicts the first-stage regressions available in Appendix Table A10. The results from the first-stage suggest the instrument is strong and predictive of the immigrants’ location.
Figure 3. First Stage: Partial Correlations
(a) Enfranchised Immigration
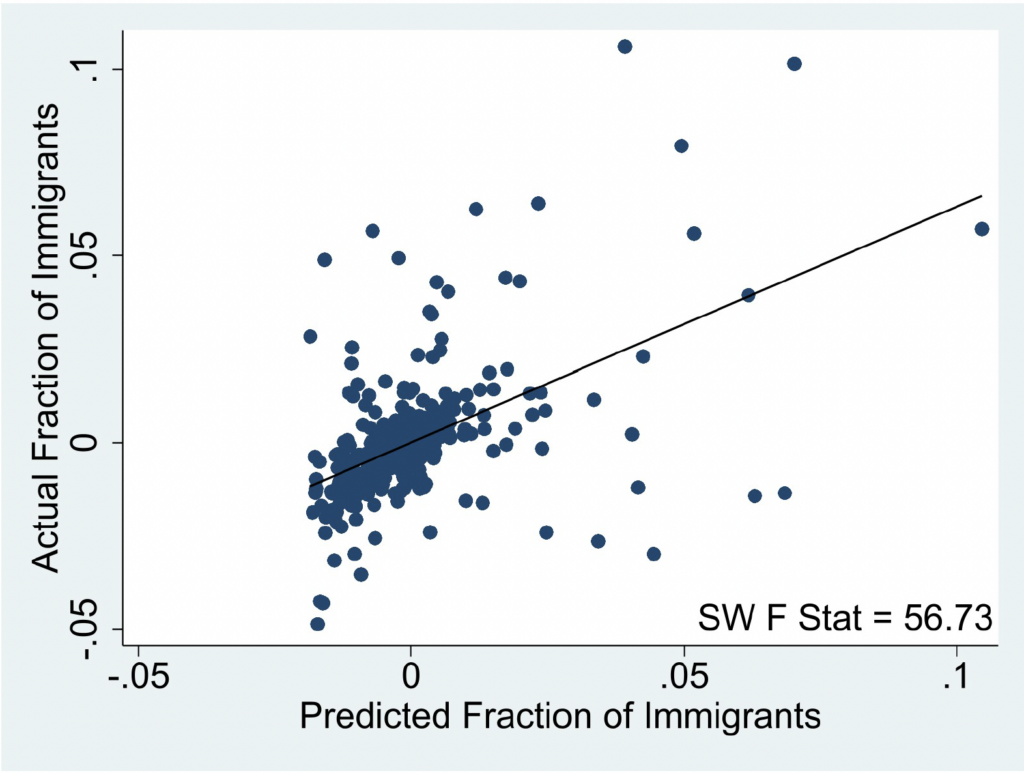
(b) Disenfranchised Immigration
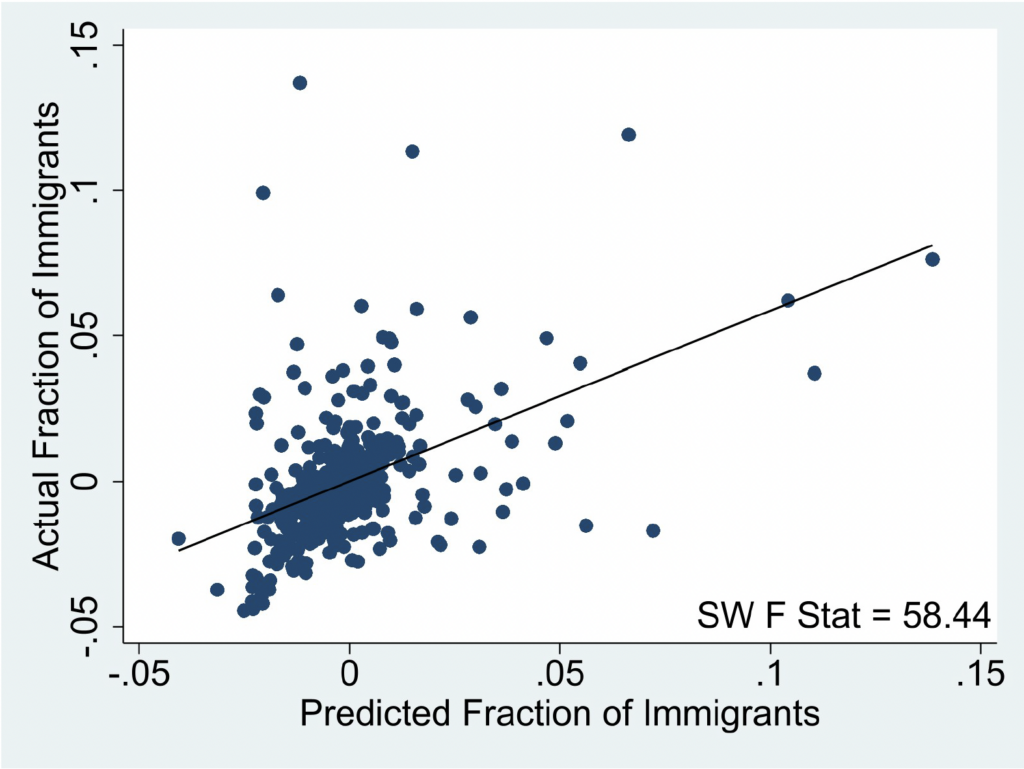
Notes: The figure displays the link between immigrant fractions and the instrument, adjusting for controls and fixed effects. Panel (a) pertains to the enfranchised group, while Panel (b) covers the disenfranchised group. The F-statistic represents the Sanderson-Windmeijer partial F-stat derived from separate first-stage regressions. Data Source: The Census, 1981 − 2011.
6.2 Effect on Parliament Speeches
Until recently, political preferences were gauged predominantly through party manifestos and voting records, as in Dinas and Gemenis (2010); Cage et al. (2021). The rich and nuanced articulation of views in parliamentary speeches offers an avenue less tainted by partisan influences than voting records. This research pivots to explore how the enfranchisement of immigrants affects parliamentary debates about them.
Table 2 shows the paper’s main results. The OLS estimation of Equation (1) is captured in columns 1 and 4, while the 2SLS estimation is shown in columns 2, 3, 5, and 6. A discernible pattern emerges: OLS point estimates for the enfranchised group are consistently lower than their 2SLS counterparts. This hints at a negative selection effect, wherein enfranchised immigrants may engage more with the political system, affecting local policies and resource allocation in a way that benefits the community at large. The resultant political speeches, shaped by the political participation of settlers, may perpetuate these effects over time, making the OLS underestimate the effects. In contrast, without political participation, the disenfranchised immigrants do not influence local politics, and the OLS estimates are higher than the 2SLS ones.
Quantitative Effects. Columns 1, 2, and 3 present results on the outcome variable Discussions. On average, the MPs spoke about immigrants on 7.8 percent of parliament days. Column 1 (OLS) suggests that higher enfranchised immigration increases parliament discussions about immigrants, and the results are reversed for disenfranchised immigration, although both coefficients are insignificant. The 2SLS analysis in column 2 suggests a tangible impact: a 1 standard deviation increase in enfranchised immigration augments the proportion of parliamentary days centered on immigration by 1.2–1.4 percentage points (15 to 18 percent relative to the mean outcome variable in levels). These discussions appear tailored to a higher use of words for the enfranchised countries and not the disenfranchised countries (Appendix Table C3, column 4). Conversely, the discussions contract by 2.3 percentage points for a similar increment in disenfranchised immigration (column 3).
For context, it is illuminating to juxtapose these discussions with other parliamentary debates. In the UK Parliament, over one year, MPs on average dedicated 34 days (22.3 percent) to constituency concerns, 7 days (4.4 percent) to the National Health Service, and 12 days (8.1 percent) to taxes. The findings in Table 2, column 3 imply that a 5 percent increase in enfranchised immigrants translates to an additional 2.17 days of immigration-centric discussions. Overall, for a constituency that receives 5 percent more immigrants and in which 50 percent are enfranchised, there is a decrease in the frequency of mentions of immigrants in parliament debates by 1.4 days.
Qualitative Effects. In columns 4, 5, and 6 the “Valence” measure provides standardized valence scores. There is a drop in the sample size because not all MPs spoke about immigrants in Parliament every year.14Table A11 replicates Table 2 by replacing the missing valence scores with the last available score for each constituency. I find almost similar results, suggesting that missing data are not a significant concern. Column 4 (OLS) suggests that higher enfranchised immigration correlates with more positive speeches about immigrants, with an inverse relationship for disenfranchised immigration. However, both coefficients are not significant. The 2SLS analysis shows that a 1 standard deviation surge in enfranchised immigration increases the valence scores by 0.22 standard deviations; that is, the MPs talk more positively when they mention immigrants. I find that an increase in disenfranchised immigration leads to a fall in the valence scores by a similar magnitude; that is, incumbents spoke less positively over time.
In Table 2, columns 3 and 6, I augment the baseline specification with several control variables: party vote shares, the stock of immigrants, a dummy for constituencies where ethnic-minority candidates contest elections, and immigrants’ observable characteristics (age, gender, marital status, employment, and educational levels).15I compute the average values of these variables using individual data from the cohorts of immigrants who arrived during each census year from the British Household Panel Survey (1991–2008) and the UK Household Longitudinal Study (2009–2019). Details are provided in Appendix Section B. If immigration impacts these variables, then some of the changes in the outcome variables might be mediated through them. Reassuringly, for enfranchised immigration, neither the economic nor the statistical significance of the coefficients are affected. Additionally, I find that dropping the enfranchised immigrants who come from countries that are most ethnically close to natives (Ireland, Australia, Canada, and New Zealand) does not affect the results (Appendix Table A12).
Figure 4. Robustness of Results
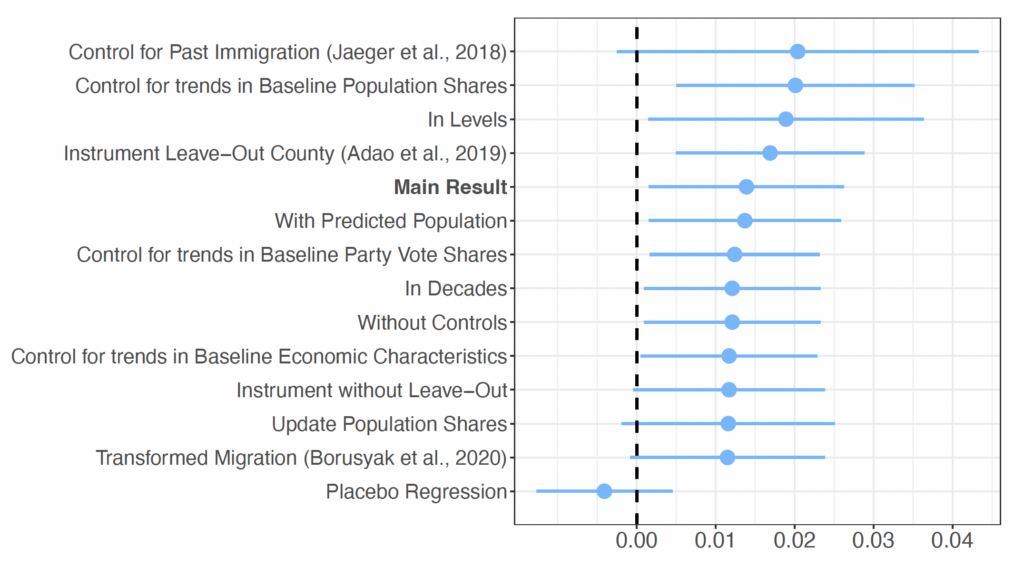
Notes: This figure aggregates the point estimates from the various regression results discussed in the Appendix Section C. It serves as a visual summary of the robustness checks and alternative estimation strategies conducted to validate the main findings of the paper.
Robustness. Appendix Section C examines various threats to identification and discusses multiple robustness checks. I summarize them in this paragraph and depict all the point estimates and 95 percent confidence intervals in Figure 4.
The main results in Table 2 remain stable even when individual controls are introduced individually (Appendix Table C2). Appendix Table C3 shows the robustness of the results when certain categories of words used to identify speeches are excluded. Moreover, it confirms that the increase in parliamentary discussion is specific to immigrants from enfranchised countries. In Appendix Table C1, I test for various alternative versions of the estimation strategy, such as in levels rather than in long differences, estimating decadal changes rather than yearly changes, and using predicted population to construct the instrument as opposed to historical data from 1981. The findings show that the main results hold under various specifications, including when examining the effect of the share of enfranchised immigration (Appendix Table C4).
Appendix Table C5 presents the robustness of the IV strategy by constructing an alternative version of the instruments, such as a traditional Bartik instrument without the leave-out strategy and a leave-out version of the instrument at the county level to alleviate any concerns that pull factors are correlated across the constituency units. With new information from each census, I increase the number of country groups in the enfranchised and disenfranchised immigration groups and use new networks to predict immigration. This robustness alleviates any concerns that fewer country groups could be problematic and that immigrant networks from the 1980s may not be a reliable forecast of immigrant settlements in subsequent years.
Appendix Table C6 reveals that including control variables like the 1981 share of employment across various industries does not significantly alter the results. Furthermore, accounting for specific baseline immigrant groups and initial political conditions does not impact the point estimates. In addition, considering the lagged immigrant flows, I find that current immigration is the main driver of the effects observed rather than historical migration patterns (Jaeger et al., 2018). A placebo regression confirms that the changes in immigration are not influencing the outcome variables, supporting the view that the shocks are randomly assigned. Last, I observe a similar inference using the shock-level transformation that has a numerical equivalence to the shift-share instrument as suggested by Borusyak et al. (2022).
6.3 Effect on Political Landscape
In this subsection, I examine how the political discourse around immigration translates into electoral consequences for incumbents. The rise of anti-immigrant populist parties and their association with immigration has been previously documented (Halla et al., 2017; Dustmann et al., 2019; Guriev and Papaioannou, 2022). This subsection further probes into the electoral implications of these phenomena by exploring the nexus between different immigrant groups and shifts in party vote shares. Table 3 provides a comprehensive analysis of these patterns. Here, I segment vote shares into four categories: the Labour Party (column 1), the Conservative Party (column 2), regional parties (specifically, the Liberal Democrats16The party is a federation of the English, Scottish, and Welsh Liberal Democrats. The largest among them, the English Liberal Democrats, is a federation of 11 regional parties in England. and Plaid Cymru in column 3), and a conglomerate of other parties that encompasses populist groups, the Green Party, and independent contenders (column 4).17The House of Commons Library reports votes shares for the Green Party and the UK Independence Party (UKIP) separately from the 2005 general election but combines votes shares for the UKIP, the Green Party, and independent candidates as other votes before the 2005 election. For consistency, I combine them across all years.
The data reveal a nuanced narrative. Specifically, a surge in enfranchised immigration corresponds to an uptick in vote shares for other parties, primarily the populist and Green factions. This suggests a distinctive shift among natives in constituencies where incumbents projected a favorable stance on immigrants. Such natives displayed a propensity to migrate away from the Labour Party—a traditionally pro-immigration entity—to alternative political options. Conversely, in constituencies witnessing a rise in disenfranchised immigration, the narrative diverges. Incumbents in these areas already exhibited less positivity toward immigrants. Consequently, the data do not capture notable shifts in vote shares for the “other” parties cluster (column 4). Instead, there is a significant drop in the Conservative vote share and an increase in the Labour vote share.
To understand these dynamics holistically, it is pivotal to explore the backdrop against which these shifts transpired. Importantly, these alterations in party vote shares did not materialize due to natives’ domestic migratory patterns between constituencies (Appendix Table A13, column 1). Furthermore, electoral participation remained relatively stable in these constituencies, albeit enfranchised immigration leads to a slight 1.4 percent decline in turnout, translating to a modest 0.009 percentage point dip (Table A13, column 2).18While immigration could influence both local and national politics, I focus on MPs’ actions because the local elections have a meager turnout of natives (around 25 to 30 percent). The European immigrants are enfranchised at the local elections, but their turnout is even lower than the enfranchised immigrants. In Parliament, enfranchised immigration did not affect the share of seats across political parties (Table A13, columns 4–7). However, in areas with pronounced disenfranchised immigration, Conservative MPs conceded their seats predominantly to their Labour and regional party counterparts.
While the overarching party allegiance of constituencies remains unchanged, I probe further into the potential increase in the descriptive representation of ethnic-minority candidates. Since the descriptive representation will take some time,19Immigrants need UK nationality to contest for a seat in Parliament. Also, the majority of the ethnic-minority MP in Parliament are mostly second- or third-generation immigrants. I employ a modified version of Equation (1) to scrutinize variations in this descriptive representation over a 10-year horizon, contingent on preceding immigration trends. The empirical findings indicate that enfranchised immigration augments the likelihood of ethnic-minority candidates’ representation in the subsequent decade (Appendix Table A14). Contrarily, the disenfranchised counterparts do not exert a similar influence. Reassuringly, I do not find the quantitative and qualitative effects on parliament speeches to be any different among those constituencies where ethnic-minority candidates did or did not contest (Table A15).
To encapsulate, the dynamics suggest a complex interplay. Incumbents, despite their favorability toward enfranchised immigrants, face an electoral conundrum. While natives gravitate toward alternative political options, the core political landscape—reflected by the party affiliations of MPs—remains unchanged. This stability suggests that incumbents might be recalibrating their strategies, aligning policies that resonate with both natives and immigrants, or potentially mitigating anti-immigrant sentiments among the electorate. This strategic positioning mirrors findings from Feigenbaum and Hall (2015), where US legislators adeptly navigated economic dislocations from Chinese imports, ensuring that such perturbations did not jeopardize their reelection prospects. To further deconstruct these dynamics, I shift focus to the legislative sphere, particularly voting patterns on immigration bills.
6.4 Voting on Immigration Bills
The voting behavior of MPs is of paramount interest as it manifests tangible action beyond mere participation in discussions about immigration. However, the dynamics of such behaviors can be influenced by intraparty controls. As illustrated by Slapin and Kirkland (2020), incidences of rebellion within UK parties are relatively rare. In Table 4, I present the impact of immigration on MPs’ voting tendencies regarding pro- and anti-immigrant amendments to the bills.
A noteworthy finding is that a 1 standard deviation surge in enfranchised immigration enhances the likelihood of MPs amending bills to tighten future immigration rules by 12.3 percentage points (column 4). Furthermore, the propensity of MPs to vote against pro-immigrant amendments—effectively preserving the bill’s status quo—increases by 9.5 percentage points, with a similar 1 standard deviation uptick in enfranchised immigration.20In Appendix Table C3, I provide evidence that my main results are robust to excluding speeches with words related to future immigrants. These results suggest that incumbents cater to the preferences of enfranchised immigrants while concurrently limiting prospective immigration. At the same time, a 1 standard deviation increase in disenfranchised immigration makes MPs 14.1 percentage points more likely to vote for amendments favorable to immigrants and 12.6 percentage points less likely to vote against immigrant interests (column 4). However, this result remains statistically insignificant. Overall, the magnitudes observed indicate that these immigration patterns substantially influence the UK’s immigration policies.21Overall, except for a few bills at the start of the period, most immigration bills did not target any particular nationality.
The opposition to immigration from the MPs with higher enfranchised immigration may be due to a preference for existing enfranchised immigrants to close the door to future immigrants. At the same time, an increase in the vote share for alternative parties reflects increased resistance from natives, accompanied by a higher cultural distance between enfranchised immigrants and the native population. Such policy shifts also serve as a tactical move by incumbents to placate constituents harboring anti-immigration sentiments, often forming the majority. On the other hand, incumbents discern no palpable electoral gains from disenfranchised immigrants, but the analysis period from the 1990s to 2011 saw an integration of the UK with the European Union. Thus, supporting immigration could be seen as fostering stronger economic ties. Below, I summarize several pieces of evidence supporting these arguments.
First, using data from the European Social Survey, I find that existing immigrants (from both groups), when juxtaposed with natives, are considerably more receptive toward incoming immigrants (Appendix Table A16). Remarkably, this openness persists even among immigrants who have acquired UK citizenship. Second, in electoral territories marked by heightened competition (narrower victory margins), the significance of both immigrant and native votes becomes even more pronounced. Here, incumbents tread with caution, seeming less inclined to represent enfranchised immigrants when the margins are thin and similarly abstaining from proposing restrictions on future immigration (Appendix Table A17). Yet, when their positions are more secure, owing to wider win margins, they appear more responsive to the inclinations of both enfranchised immigrants and natives.
Third, incumbents tend to resonate more favorably toward enfranchised immigrants in constituencies where the Labour Party enjoys substantial support. This pro-immigration sentiment seems to be bolstered by a voter base that aligns with such views (Appendix Table A18). However, the political landscape remains fluid. With the Labour Party’s vote share ebbing in some regions, MPs lean toward more restrictive immigration policies, mirroring the desires of the native majority (column 6). A similar and opposite pattern is also visible for the constituencies with higher Conservative Party vote shares (Appendix Table A19).
In summary, enfranchisement might be a conduit for the political integration of immigrants, evoking favorable reactions from incumbents. However, immigrants have limited electoral weight, and incumbents respond to enfranchised immigrants only when it is not costly to do so, compensating by restricting future immigration. The following subsection strives to distinguish the two immigrant groups and elucidates why politicians might be more attuned to enfranchised immigrants.
6.5 Enfranchised versus Disenfranchised Immigrants
I begin with an examination of first-generation immigrants’ sociodemographic characteristics using the European Social Survey, comparing enfranchised and disenfranchised groups. The balance statistics, including means for both groups and p-values of the outcome variable’s regression, are presented in Table A20, along with adjustments for potential sampling errors and nonresponse bias. Approximately 53 percent of the surveyed foreign-born participants are enfranchised, with noticeable differences in age and cohabitation status between the two groups but similarities in education, labor force participation, and life satisfaction. Contrary to expectations, enfranchised immigrants do not exhibit greater political enthusiasm or news engagement, and both groups show similar levels of democratic contentment and trust in the UK’s institutions. However, enfranchised immigrants display slightly more confidence in political participation (Appendix Figure A4). Moving forward, the next sub-section explores why politicians might favor enfranchised immigrants, considering constitutional obligations and ethical considerations.
6.6 Political Engagement of Immigrants
I use the European Social Survey to investigate sociopolitical activities among immigrants in the UK, focusing on actions such as contacting officials, working in political groups, displaying campaign materials, signing petitions, participating in demonstrations, and boycotting products. Enfranchised immigrants show a significantly higher likelihood of engaging in sociopolitical activities, particularly in signing petitions (Appendix Table A21).
I also explore the influence of immigrants’ democratic backgrounds, finding that those from stronger democracies exhibit increased political and civil engagement after arriving in the UK. Further, enfranchised noncitizens are more inclined to sign petitions, but this gap narrows upon acquiring UK citizenship. In addition, I find that up to 10 years since arrival, only 32 percent of the immigrants have UK citizenship, thus providing more confidence that political engagement is due to enfranchisement rather than to citizenship.
The analysis extends to electoral involvement, showing that enfranchised immigrants with UK citizenship align closely with native voting patterns, while disenfranchised immigrants participate less (Appendix Table A22). These findings are paralleled by similar research in Norway and France, emphasizing the role of early access to political institutions and voter registration processes in fostering immigrant political participation (Braconnier et al., 2017; Ferwerda et al., 2020; Bratsberg et al., 2021).
6.7 From Political Inclusion to Parliament Discussions
The survey evidence might carry a social desirability bias, but the data underscore the enhanced political involvement of enfranchised immigrants due to their inclusion. In this subsection, I study whether MPs react to immigrant political engagement by examining parliament speech through 2SLS estimation. The focus is on whether MPs, under immigrant political engagement, allocate more parliamentary time to petitions, member bills, and ministerial queries that mention them. Changes in this time distribution would signify direct influence from political engagement.
Table 5 presents the findings. Columns 1 and 2 indicate no shifts in the extensive margins of parliamentary speeches, neither in total words per session (column 1) nor in the yearly frequency of MP participation (column 2).22There is also no perceptible shift in the overall speech distribution related to immigrants across the group of words (Figure A5). Columns 3–5 present changes in the intensive margin. Column 3 echoes column 2 of Table 2, detailing the effect of enfranchisement on Discussions.
Columns 4 and 5 then dissect these changes further: column 4 tackles time dedicated to petitions, direct questions, and private member bills, while column 5 explores other immigrant-related discussions. Column 4 verifies that incumbents indeed respond to enfranchised immigrants’ active political presence, as seen in a notable 43 percent spike in parliamentary debates. If immigrant political activity indeed prompts incumbent reactions, it stands to reason that heightened engagement leads to more pronounced responses. This hypothesis gains traction when considering heterogeneity by immigrants from strong versus weak democracies (Appendix Table A23, columns 2 and 4). At the same time, there is no such effect on MPs’ voting behavior, which predominantly caters to natives’ preferences.
7 Conclusion
In an era marked by significant global demographic shifts due to immigration, the challenge of political representation for these new populations takes center stage. This study, set against the backdrop of the UK and its unique enfranchisement practices, examines how the political integration of immigrants reshapes the nation’s political landscape over three decades. The results underscore that enfranchisement amplifies immigrants’ political engagement and prompts incumbents to address immigrant issues more frequently and positively. Yet, the politicians’ voting patterns often resonate more with the majority (natives) sentiments to curb further immigration.
This study, at its core, shows that immigrant enfranchisement is both a matter of democratic representation and an influence on the political tenor of host nations. Though deeply rooted in the UK’s sociopolitical fabric, it offers invaluable insights into broader global contexts. As the world grapples with evolving migration patterns, some countries such as the United States, Sweden, and Switzerland are exploring the idea of local-level enfranchisement of foreign-born noncitizens. The findings here not only shed light on the potential outcomes of such policy moves but also emphasize the inherent complexities of integrating and politically including immigrants in the democratic processes.
A Appendix Tables and Figures
Figure A1. Constituency Boundary Changes (Warwickshire County)
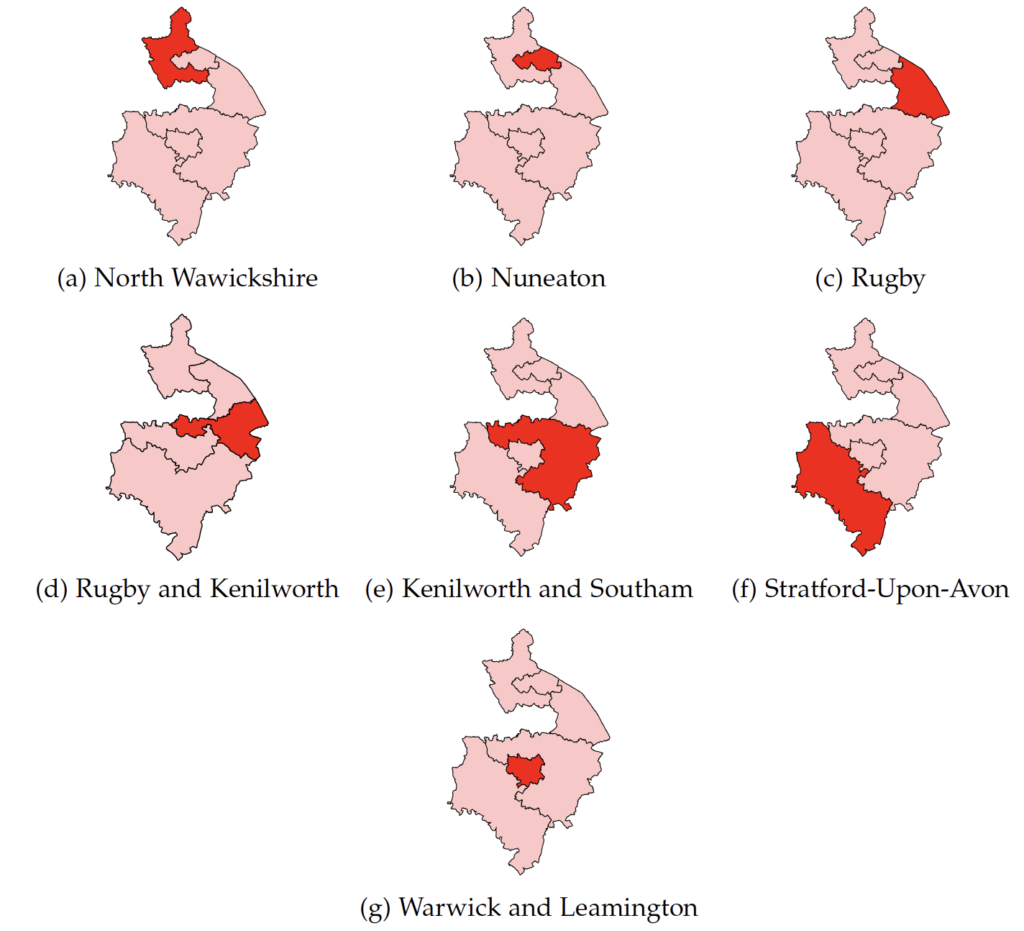
Notes: The figure shows changes in the parliamentary constituency boundaries for Warwickshire County by the Delimitation Commission in 1983 and 2010. As there were substantial changes to the boundaries, I combine all constituencies to create a parent unit that has consistent boundaries between the Census of 1971 and 2011. Data Source: Delimitation Commission Reports of 1974, 1983, 1997, and 2010.
Figure A2. Constituency Boundary Changes (Somerset County)
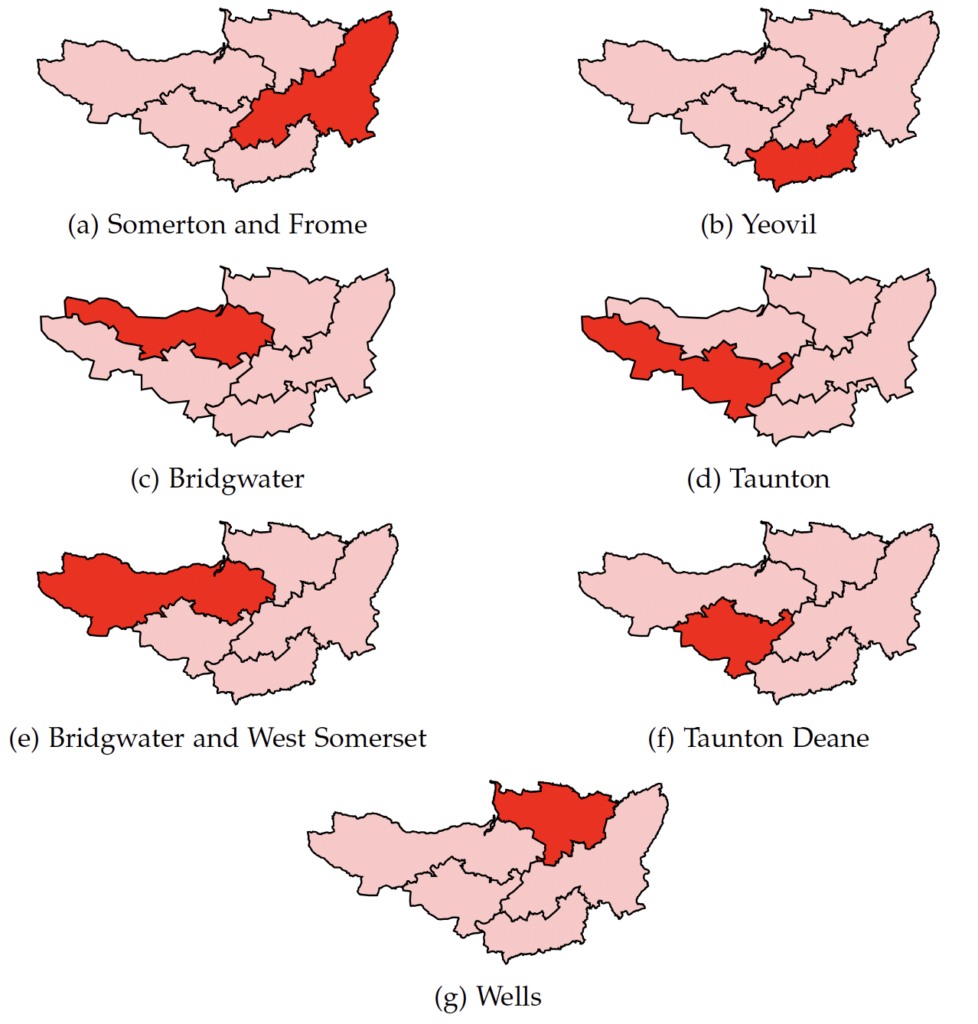
Notes: The figure shows changes in the parliamentary constituency boundaries for Somerset County by the Delimitation Commission in 1983 and 2010. Somerton and Frome constituency (Figure [a]) was created in 1983 from Yeovil constituency (Figure [b]). I combine both to create a parent unit that is stable between Census 1971 and 2011. The 2010 Delimitation Commission altered the boundaries for the Bridgwater constituency (Figure [c]) and Taunton constituency (Figure [d]) to create the Bridgwater and West Somerset constituency (Figure [e]) and Taunton Deane constituency (Figure [f]). I combine these four constituencies to create a parent unit that is stable between Census 1971 and 2011. The boundaries for the Wells constituency remained unchanged and remains a stable constituency unit. Data Source: Delimitation Commission Reports of 1974, 1983, 1997, and 2010.
Figure A3. Parliament debates over time
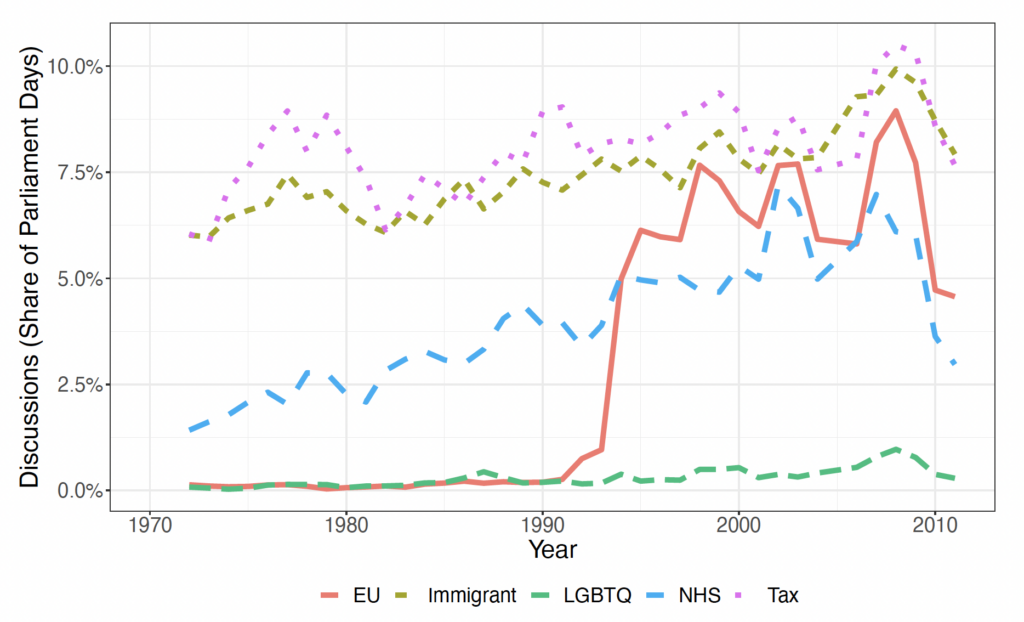
Notes: The figure plots the outcome variable “Discussions”, i.e. the share of parliament days related to debates on EU, immigrants, LGBTQ, NHS, and Tax. Data Source: Text of Speech from the UK Parliament Hansard, 1972 − 2011.
Figure A4. Political Attitudes across Immigrant groups
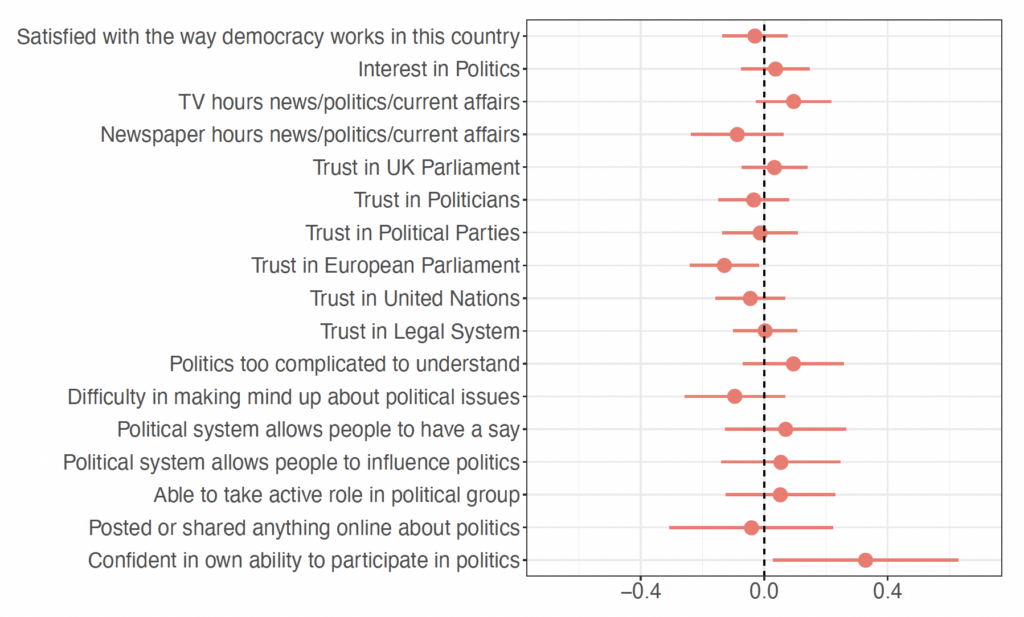
Notes: The figure plots the coefficient and 95% confidence interval on the indicator variable for an immigrant from the enfranchised group. The y-axis shows standardized outcome variables in the regression. Post-stratification and population weights are applied. Data Source: The European Social Survey, Waves 1 to 9.
Figure A5. Immigrant Speeches across Word Groups
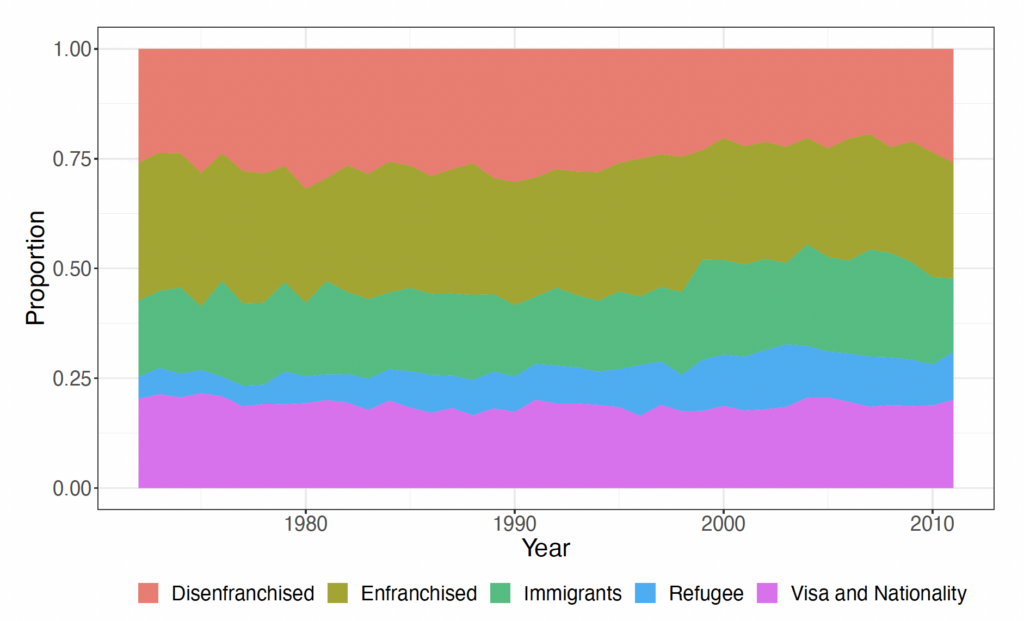
Notes: The figure shows the distribution of speeches for immigrants across the word groups over the years. Data Source: Text of Speech from the UK Parliament Hansard, 1972 − 2011.
B Appendix: Other Surveys
While the European Social Survey provides a representative sample of immigrants in the UK, here I supplement additional evidence using the UK Household Longitudinal Study (2009–2019) and the British Household Panel Survey (1991–2008). I mainly rely on the European Social Survey as in the other two surveys, the country of birth for about a third of the foreign-born respondents is categorized as ”other
country,” which introduces more measurement errors. Table C1 provides a balance statistics test between the share of immigrants from the enfranchised (Enf) and the disenfranchised (DisEnf) group on their observable characteristics. I classify respondents based on their country of birth and focus exclusively on those not born in the UK.
These surveys are not without limitations. For instance, some questions are not consistently posed across different survey periods. Specifically, 33.8 percent of the sample had their country of birth listed as another country. I use ethnicity data for those listed under “other country” to improve the accuracy of my classifications, and I mark the remaining as disenfranchised; therefore, some imprecision remains.
My findings indicate that enfranchised immigrants are, on average, four years older than disenfranchised immigrants. They also have similar gender ratios and are more likely to be married. Both groups show comparable levels in areas like highest educational attainment, work hours, employment rates, driving license ownership, and job satisfaction. Enfranchised immigrants generally arrive in the UK three years earlier than their disenfranchised counterparts and are more likely to face challenges with English proficiency. Overall, despite the data limitations, the findings remain similar to using the European Social Survey.
C Appendix: Robustness Checks
In this section, I discuss threats to identification and present several robustness checks to test the strength of the results presented in the paper.
C.1 Altering Controls and Outcome Variable
In Table 2, which presents the main results, I introduce all control variables together in the estimation: party vote shares, the stock of immigrants, a dummy for constituencies where ethnic-minority candidates contest elections, and observable characteristics of the immigrants (age, gender, marital status, employment, and educational levels). One potential concern is that if immigration impacts these variables, then some of the changes in the outcome variables might be mediated through them. Table C2 shows that the results are robust to including individual controls one at a time, and the coefficient of enfranchised immigration remains stable across columns.
Another concern might be the words used to extract speeches about immigrants. In Appendix Table C3, I provide evidence that my main results are robust to excluding speeches with words related to ethnicity, race, and refugees; visa and nationality; and those involving discussion of immigration bills (future immigrants). The point estimates across all columns remain almost similar. In addition, the last two columns of Table C3 show that the increase in parliament discussion due to enfranchised immigration is specific to immigrants from enfranchised countries (column 4) and not from immigrants from disenfranchised countries (column 5).
C.2 Alternative Estimation Strategy
Next, I examine alternative versions of the estimation strategy to test the robustness of the results (Table C1). I redo the main results by transforming the primary outcome variables in levels, including constituency fixed effects and regional time trends (columns 1 and 2) rather than in 10-year differences. Next, since the explanatory variable changes at each census, while the outcome variable varies each year, in column 3, I show the robustness of the main estimation equation for just three time periods (three census years) by undertaking an analysis in decades.
In column 4, I show the robustness of the results using predicted population shares rather than the 1981 population shares. Finally, to analyze the effect of the share of enfranchised immigration, I use an alternative specification that looks at changes in the main outcome variables on immigration and the share of enfranchised immigration (Table C4). A constituency with 50 percent enfranchised immigrants and 50 percent disenfranchised immigrants, or when the share of enfranchised immigration is 0.5, still shows null results.
C.3 Alternative Versions of Instruments
In the main results, I use a leave-one-out version of the shift-share instrument at the constituency level. Here, I present the robustness of the instrumental variable strategy by constructing an alternative version of the instruments (Table C5). Column 1 uses predicted immigrants using the traditional Bartik instrument without the leave-out strategy. In column 2, I predict the share of immigrants using a leave-out version of the instrument with a larger geographical region (county) to alleviate any concerns that pull factors are correlated across the constituency units (Adao et al., 2019).
As my identification relies on exogenous shocks, I update the migrant networks as new information becomes available in each census (column 3); that is, I increase the number of country groups in the enfranchised and disenfranchised immigration and use new networks to predict immigration. This robustness alleviates any concerns that a smaller number of country groups might be problematic and that 1980s immigrant networks might not be a strong predictor of the immigrant’s settlement in the later periods. Following Borusyak et al. (2022), column 4 shows that the transformed instrumental variable regression at the estimated at level of shocks has a numerical equivalence to the shift-share instrumental variable regression (column 3).
C.4 Pre-Period Characteristics
In Table C6, I address the concerns that 1981 immigrant settlements and other constituency-specific characteristics are correlated and might have had a time-varying effect on economic and political conditions. In column 1, I augment the baseline specification with the 1981 share of employment by different industries such as agriculture, manufacturing, construction, transport, interacted with year dummies. The results suggest that these controls do not have any effect on my results.
I then test if specific immigrant groups that settled in particular constituencies impacted the economic and political conditions in the future periods; that is, pre-period shares of immigrants were not independent of cross-constituency pull factors systematically related to 1981 settlers’ country of origin (Goldsmith-Pinkham et al., 2020). I find that including the 1981 population shares from each country group as a control variable, and controlling for initial political conditions, does not affect my point estimates (columns 2 and 3).
In column 4, I include lagged immigrant flows and instrument them with lagged versions of the instrument (Jaeger et al., 2018). The point estimates increase, suggesting that most of the effects are driven by current immigration and are not capturing the effects of previous migration waves. Finally, as a placebo regression, I find no correlation between pre-period changes in the outcome of interest and the change in immigration predicted by the instrument (column 5). Thus, the shocks are randomly assigned and do not affect the outcome variables.
References
Abramitzky, R., L. P. Boustan, and K. Eriksson (2012): “Europe’s tired, poor, huddled masses: Self-selection and economic outcomes in the age of mass migration,” American Economic Review, 102, 1832–56.
——— (2014): “A nation of immigrants: Assimilation and economic outcomes in the age of mass migration,” Journal of Political Economy, 122, 467–506.
Acemoglu, D. and J. A. Robinson (2000): “Why did theWest extend the franchise? Democracy, inequality, and growth in historical perspective,” The Quarterly Journal of Economics, 115, 1167–1199.
——— (2001): “A theory of political transitions,” American Economic Review, 91, 938–963.
Adao, R., M. Kolesár, and E. Morales (2019): “Shift-share designs: Theory and inference,” The Quarterly Journal of Economics, 134, 1949–2010.
Alabrese, E., S. O. Becker, T. Fetzer, and D. Novy (2019): “Who voted for Brexit? Individual and regional data combined,” European Journal of Political Economy, 56, 132–150.
Ash, E., M. Morelli, and M. Vannoni (2021): “More laws, more growth? evidence from us states.”
Ashford, G. (2022): “Noncitizens’ Right to Vote Becomes Law in New York City,” New York Times.
Barone, G., A. D’Ignazio, G. De Blasio, and P. Naticchioni (2016): “Mr. Rossi, Mr. Hu and politics. The role of immigration in shaping natives’ voting behavior,” Journal of Public Economics, 136, 1–13.
Bazzi, S., A. Ferrara, M. Fiszbein, T. Pearson, and P. A. Testa (2023): “The Other Great Migration: Southern Whites and the New Right,” The Quarterly Journal of Economics, 138, 1577–1647.
Bell, D. A. (1980): “Brown v. Board of Education and the interest-convergence dilemma,” Harvard Law Review, 518–533.
Benjamini, Y. and Y. Hochberg (1995): “Controlling the false discovery rate: a practical and powerful approach to multiple testing,” Journal of the Royal Statistical Society: Series B (Methodological), 57, 289–300.
Biavaschi, C. and G. Facchini (2020): “Immigrant franchise and immigration policy: Evidence from the Progressive Era,” CEPR Discussion Paper No. DP14684.
Bird, S., E. Klein, and E. Loper (2009): Natural language processing with Python: analyzing text with the natural language toolkit, O’Reilly Media, Inc.
Blinder, S. and W. Allen (2016): “UK public opinion toward immigration: Overall attitudes and level of concern,” Migration Observatory Briefing, COMPAS, University of Oxford.
Borusyak, K., P. Hull, and X. Jaravel (2022): “Quasi-experimental shift-share research designs,” The Review of Economic Studies, 89, 181–213.
Braconnier, C., J.-Y. Dormagen, and V. Pons (2017): “Voter registration costs and disenfranchisement: experimental evidence from France,” American Political Science Review, 111, 584–604.
Bratsberg, B., J. Ferwerda, H. Finseraas, and A. Kotsadam (2021): “How settlement locations and local networks influence immigrant political integration,” American Journal of Political Science, 65, 551–565.
Broockman, D. E. (2013): “Black politicians are more intrinsically motivated to advance blacks’ interests: A field experiment manipulating political incentives,” American Journal of Political Science, 57, 521–536.
Burchardi, K. B., T. Chaney, and T. A. Hassan (2019): “Migrants, ancestors, and foreign investments,” The Review of Economic Studies, 86, 1448–1486.
Butler, D. M. (2014): Representing the advantaged: How politicians reinforce inequality, Cambridge University Press.
Butler, D. M. and D. E. Broockman (2011): “Do politicians racially discriminate against constituents? A field experiment on state legislators,” American Journal of Political Science, 55, 463–477.
Cage, J., C. Le Pennec, and E. Mougin (2021): “Money and Ideology: Evidence from Candidate Manifestos,” Available at SSRN 3894330.
Calderon, A., V. Fouka, and M. Tabellini (2023): “Racial Diversity and Racial Policy Preferences: The Great Migration and Civil Rights,” The Review of Economic Studies, 90, 165–200.
Card, D. (2001): “Immigrant inflows, native outflows, and the local labor market impacts of higher immigration,” Journal of Labor Economics, 19, 22–64.
——— (2009): “Immigration and inequality,” American Economic Review, 99, 1–21.
Card, D., S. Chang, C. Becker, J. Mendelsohn, R. Voigt, L. Boustan, R. Abramitzky, and D. Jurafsky (2022): “Computational analysis of 140 years of US political speeches reveals more positive but increasingly polarized framing of immigration,” Proceedings of the National Academy of Sciences, 119.
Card, D., C. Dustmann, and I. Preston (2012): “Immigration, wages, and compositional amenities,” Journal of the European Economic Association, 10, 78–119.
Conley, J. P. and A. Temimi (2001): “Endogenous enfranchisement when groups’ preferences conflict,” Journal of Political Economy, 109, 79–102.
DEMIG (2015): “DEMIG POLICY, Online Edition. Oxford: International Migration Institute,” Tech. rep., University of Oxford.
Dinas, E. and K. Gemenis (2010): “Measuring parties’ ideological positions with manifesto data: A critical evaluation of the competing methods,” Party politics, 16, 427–450.
Dustmann, C., F. Fabbri, and I. Preston (2005): “The impact of immigration on the British labour market,” The Economic Journal, 115, F324–F341.
Dustmann, C., K. Vasiljeva, and A. Piil Damm (2019): “Refugee migration and electoral outcomes,” The Review of Economic Studies, 86, 2035–2091.
Edo, A., Y. Giesing, J. ¨Oztunc, and P. Poutvaara (2019): “Immigration and electoral support for the far-left and the far-right,” European Economic Review, 115, 99–143.
Eggers, A. C. and A. Spirling (2014): “Ministerial responsiveness in Westminster systems: Institutional choices and House of Commons debate, 1832–1915,” American Journal of Political Science, 58, 873–887.
Feigenbaum, J. J. and A. B. Hall (2015): “How legislators respond to localized economic shocks: evidence from Chinese import competition,” The Journal of Politics, 77, 1012–1030.
Ferwerda, J., H. Finseraas, and J. Bergh (2020): “Voting rights and immigrant incorporation: Evidence from Norway,” British Journal of Political Science, 50, 713– 730.
Figueroa, V. and V. Fouka (2022): “Fundamentals as Drivers of Moral Change: The British Abolitionist Movement.”
Gathmann, C. and J. Garbers (2023): “Citizenship and integration,” Labour Economics, 82, 102343.
Gathmann, C. and N. Keller (2018): “Access to citizenship and the economic assimilation of immigrants,” The Economic Journal, 128, 3141–3181.
Geese, L., W. Goldbach, and T. Saalfeld (2015): “Mobility and Representation: Legislators of Non-European Origin in the British House of Commons, 2001– 2015,” in Mobility and Biography, De Gruyter Oldenbourg, 83–110.
Gell-Redman, M., N. Visalvanich, C. Crabtree, and C. J. Fariss (2018): “It’s all about race: How state legislators respond to immigrant constituents,” Political Research Quarterly, 71, 517–531.
Goldsmith-Pinkham, P., I. Sorkin, and H. Swift (2020): “Bartik instruments: What, when, why, and how,” American Economic Review, 110, 2586–2624.
Grossman, G. and S. Zonszein (2021): “Voted In, Standing Out: Public Response to Immigrants’ Political Accession,” OSF Preprints. September, 19.
——— (2022): “Turnout Turnaround: Ethnic Minority Victories Mobilize White Voters,” .
Guriev, S. and E. Papaioannou (2022): “The political economy of populism,” Journal of Economic Literature, 60, 753–832.
Hainmueller, J., D. Hangartner, and G. Pietrantunon (2017): “Catalyst or Crown: Does Naturalization Promote the Long-Term Social Integration of Immigrants?” American Political Science Review, 111, 256–276.
Halla, M., A. F. Wagner, and J. Zweimüller (2017): “Immigration and voting for the far right,” Journal of the European Economic Association, 15, 1341–1385.
Hanlon, W. W. (2023): “How Much Influence Does Government Have Over the Legislative Agenda? Evidence from the UK, 1810-2004.”
Iyer, L., A. Mani, P. Mishra, and P. Topalova (2012): “The power of political voice: women’s political representation and crime in India,” American Economic Journal: Applied Economics, 4, 165–93.
Jaeger, D. A., J. Ruist, and J. Stuhler (2018): “Shift-share instruments and dynamic adjustments: The case of immigration,” Tech. rep., Working Paper.
Koukal, A. M., P. Schafer, and R. Eichenberger (2021): “Enfranchising noncitizens: What drives natives’ willingness to share power?” Journal of Comparative Economics.
Nye, J. V., I. Rainer, and T. Stratmann (2015): “Do black mayors improve black relative to white employment outcomes? Evidence from large US cities,” The Journal of Law, Economics, & Organization, 31, 383–430.
Osnabrügge, M., S. B. Hobolt, and T. Rodon (2021): “Playing to the Gallery: Emotive Rhetoric in Parliaments,” American Political Science Review, 1–15.
Ricca, F. and F. Trebbi (2022): “Minority Underrepresentation in US Cities,” Tech. rep., National Bureau of Economic Research.
Saalfeld, T. (2011): “Parliamentary questions as instruments of substantive representation: Visible minorities in the UK House of Commons, 2005–10,” The Journal of Legislative Studies, 17, 271–289.
Sequeira, S., N. Nunn, and N. Qian (2020): “Immigrants and the Making of America,” The Review of Economic Studies, 87, 382–419.
Slapin, J. B. and J. H. Kirkland (2020): “The sound of rebellion: Voting dissent and legislative speech in the UK house of commons,” Legislative Studies Quarterly, 45, 153–176.
Slapin, J. B., J. H. Kirkland, J. A. Lazzaro, P. A. Leslie, and T. O’Grady (2018): “Ideology, grandstanding, and strategic party disloyalty in the British Parliament,” American Political Science Review, 112, 15–30.
Spirling, A. (2016): “Democratization and linguistic complexity: The effect of franchise extension on parliamentary discourse, 1832–1915,” The Journal of Politics, 78, 120–136.
Stutzer, A. and M. Slotwinski (2020): “Power sharing at the local level: Evidence on opting-in for non-citizen voting rights,” Constitutional Political Economy, 1–30.
Tabellini, M. (2020): “Gifts of the immigrants, woes of the natives: Lessons from the age of mass migration,” The Review of Economic Studies, 87, 454–486.
Warriner, A. B., V. Kuperman, and M. Brysbaert (2013): “Norms of valence, arousal, and dominance for 13,915 English lemmas,” Behavior research methods, 45, 1191–1207.