
 Policy Commons
Introduction
In developing countries, the state often fails to deliver the public goods it has promised. This failure is frequently rooted in state capacity constraints. The link between public good provision and state capacity is highlighted in the model by Besley and Persson (2009), where the government’s ability to provide public goods is constrained by its ability to enforce the rule of law (legal capacity) and to collect taxes (fiscal capacity). Although the model allows the government to expand its legal and fiscal capacity through investments, the feasibility of such investments in a developing country is questionable because the model assumes there is no waste. We know that money spent on public goods in developing countries does not always translate into actual public goods. An audit of Indonesian road construction showed that 24% of funds were pocketed (Olken 2007). In India, spending on schools did little to improve education because a quarter of teachers were absent (Muralidharan et al. 2017). This evidence about public goods spending invites questions about whether developing countries use tax revenues to improve state capacity. Evidence from Pakistan shows that such investments can improve tax revenues, but they can also fail to raise revenue, instead giving tax collectors more bargaining power to extract bribes from taxpayers (Khan et al. 2016). Can developing countries improve state capacity, or will the investments be squandered?
To examine whether developing countries use tax revenues to develop state capacity, I turn to Haiti during the 1930s and 1940s. In 1942, the Haitian government unexpectedly reformed its income tax law. This reform had two important features. First, it was a response to the US entering World War II. US mobilization substantially decreased Haiti’s customs receipts, the government’s main source of revenue, forcing it to reform internal taxes to compensate for the loss. Thus the reform was a response to a stimulus exogenous to conditions within Haiti. Second, the reform significantly increased internal revenues without changing appropriations laws. The preexisting appropriations law reserved a portion of revenues from internal sources for use by the Haitian Internal Revenue Service (HIRS). The 1942 tax reform increased taxes collected from income tenfold and doubled internal revenues. Thus the reform produced an exogenous shock to the revenue available for HIRS.
This exogenous shock to HIRS was important because HIRS played a key role in the country’s fiscal and legal capacity. Although Haiti’s main instrument of fiscal capacity was its customs houses, its second-most-important instrument was HIRS, which collected internal taxes. But the capacity of HIRS was low. In some areas of the country, collection rates on some taxes were as low as 22%. HIRS was also important for legal capacity. Through HIRS, the government ran a rental program for government-owned land. As with fiscal capacity, capacity to administer the land rental program was low. While the capacity to administer the program might have been sufficient in the program’s earlier years, it was challenged by a demand shock induced by refugees fleeing the Dominican Republic after the Trujillo massacre (Palsson 2018). Program applicants faced long delays, and budget constraints prevented the government from investing in the program.
The 1942 tax reform, then, allows me to test the Besley and Persson model. The model predicts that the exogenous increase in tax revenues will have at least three effects. First, the tax revenue shock should increase fiscal capacity, which would be seen through an increase in future tax revenues. Second, the shock should improve legal capacity. Third, it should increase revenues collected on the properties protected under the expanded legal capacity.
To test these predictions, I collected data on tax revenues and property rentals from 1932 to 1949. Tax revenue data come from Annual Reports made by Haiti’s Fiscal Department. Property rental data come from state-owned property leased to households. The Haitian government published the property data in its gazette, Le Moniteur, from which I collected the universe of properties approved. The property rental data are used for testing the expansion in legal capacity, and the tax revenue data are used for testing the expansions in both fiscal and legal capacity.
I test the first prediction—that the shock will increase fiscal capacity—by looking at the time series of internal revenues from nonincome sources such as property and excise taxes. After the tax revenue shock, nonincome revenues suddenly increased. The increase in nonincome tax revenues matches an increase in salary expenditures on HIRS personnel. The results suggest that the government indeed invested in fiscal capacity and that it saw a subsequent increase in tax revenues. Both results are consistent with the model.
To test the second prediction—that the shock will increase legal capacity—I look at delays between when a property was requested and when it was approved. For properties requested between 1939 and 1941 (the years directly before the reform), the average delay was 30 to 40 months. A major contributor to such long delays was the demand surge caused by the refugees from the Dominican Republic. To see how the tax revenue shock affected delays, I use a hazard analysis, which can account for changes in state capacity that occur while properties are under review. The survival curves show that after the tax reform, the probability that approval would take longer than eight months dropped from 85% to 20%. Moreover, the large reduction in delays occurred while request volume remained high. Such a change suggests that the tax revenues were used to increase the state’s capacity to administer the land rental program.
Finally, to test the third prediction—that the shock will increase taxes collected on properties protected by the legal capacity expansion—I look at rents collected on the rental properties. If the government does not provide renters with adequate protection, then they are free to leave and stop paying rent; thus, rents are a sufficient proxy for the level of protection. Using a synthetic control analysis, I show that the precincts where refugees requested properties also increased rents paid on those properties. To prove that the increase in rents was caused by the titles granted under the capacity increase and not by an appreciation in land values, I look at a placebo test with taxes collected on mortgages, which would show a similar pattern to that of rents if the causal mechanism were land values. The placebo test shows there was no differential increase in mortgage taxes in the precincts in question.
This paper differs from previous research on state capacity because it looks at how countries develop capacity. Recent work in development economics has examined the immediate effects of increasing state capacity, but such research focuses on capacity expansions linked to monitoring technologies, such as delivering transfer payments with biometric smart cards (Muralidharan et al. 2016) or monitoring extension agents with GPS-enabled cell phones (Dal Bo et al. 2018). Other work has looked at the role of state capacity in development by examining cross-country evidence or using historical variation to explain differences in state capacity (see Johnson and Koyama 2017 for a survey of this literature). This paper’s contribution is to test how states expand capacity.
This paper also has important implications for refugee policy. First, greater capacity makes countries more flexible to accept refugees and mitigate the negative effects. For instance, when refugees from the 2010 Haiti earthquake entered the Florida school system, the schools had enough capacity to absorb them with no negative impacts on the nonrefugee students (Figlio and Özek 2017). In contrast, this paper shows that refugees from the Dominican Republic overwhelmed the low-capacity Haitian government and negatively affected natives. And it is important to distinguish state capacity from development. Like in Haiti, Uganda had a similar, but successful, program—it gave refugees agricultural land that created significant benefits (Zhu et al. 2018)—but it was a success because Uganda had the capacity to run the program. A second implication concerns the fiscal impact of refugees. Some evidence shows that when refugees first arrive they draw more from government resources than they contribute, but in the long run they are net contributors (Evans and Fitzgerald 2017). While refugees in developing countries do increase demand for goods and services (Alix-Garcia et al. 2018), this paper shows that we should not expect refugees to increase government revenues in countries that already struggle with tax collections.
Theoretical Foundation
The theoretical foundation for this paper comes from Besley and Persson (2009). They model the interaction between fiscal and legal capacity and describe how the country’s political economy affects how the government invests in state capacity. Besley and Persson divide state capacity into two components: legal and fiscal capacity. In their paper, investing in state capacity involves building infrastructure and institutions. So legal capacity “reflects legal infrastructure such as building court systems, employing judges, and registering property,” and fiscal capacity is “the build-up of institutions such as an administration (like the IRS in the United States) for the collection of income taxes, a system for the monitoring of tax compliance, etc.” While these definitions map directly into the empirical work in this paper, Johnson and Koyama (2017) give more general definitions. Legal capacity is the state’s ability to “enforce its rules across the entirety of the territory it claims to rule,” and fiscal capacity is the state’s ability to “garner enough tax revenues from the economy to implement its policies.”
Since the Besley and Persson model includes several mechanisms that are not relevant to this paper, I distill the model to the causal mechanisms I am testing and summarize it in Figure 1. The state has tax revenue and can choose to spend it in three ways. One way is by supplying a public good that increases the population’s utility today. The other two ways deal with investing in state capacity, through either improving fiscal capacity or expanding legal capacity. The benefit of investing in state capacity is greater tax revenues in the future for providing the public good. The Besley and Persson (2009) model is a two-period model, so future tax revenue is spent entirely on the public good, but clearly in an infinite-horizon model the government would have the option of spending more on state capacity investments.
Figure 1. Diagram of the Besley and Persson (2009) Model
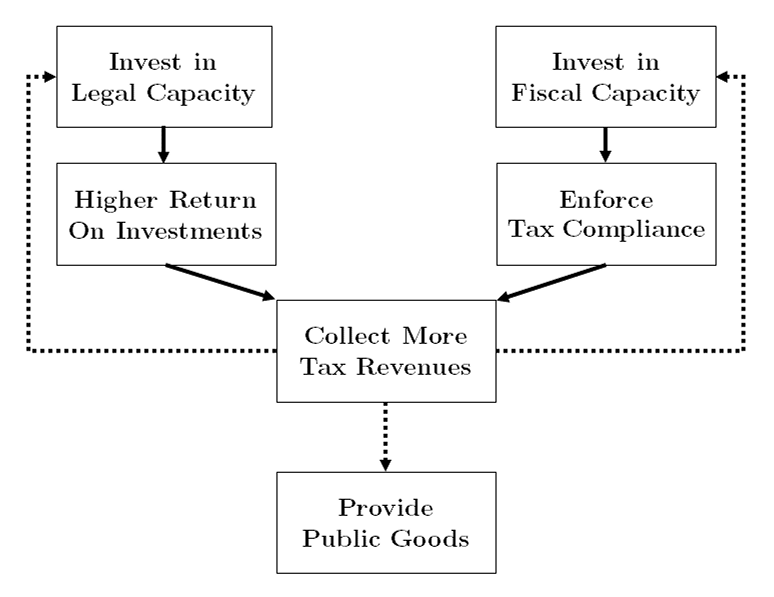
Note: The Besley and Persson (2009) model has other features, such as a credit market with collateral, but this diagram is meant to preserve the model’s higher-level features. Dashed lines indicate that the government can choose where to send tax revenues, while solid lines indicate direct casual relationships.
In this paper I test the model using an exogenous increase in tax revenues. Given an exogenous increase in tax revenues, the model has testable hypotheses for whether the revenues improved state capacity.
Testable prediction 1: an exogenous increase in tax revenues from one source will increase future revenues from other tax sources. Governments collect taxes from various sources. For example, they collect income taxes, property taxes, and excise taxes. Furthermore, they collect fees such as vital statistics fees or document fees. If the government faces no capacity constraint, or if the government is incapable of increasing fiscal capacity, then an exogenous increase in revenues from income taxes should not affect revenues from property taxes. But if the government invests in fiscal capacity, and if the government previously faced a capacity constraint, then we should see revenues from income taxes cause an increase in revenues from property taxes as well as from other tax sources.
Testable prediction 2: an exogenous increase in tax revenues will improve the provision of property rights. Increasing legal capacity in the Besley and Persson model means improving property protections. Improving property protections could mean reducing the probability of theft or punishing those who steal. But it could also involve improving property titling. As de Soto (2000) showed, a key barrier to protecting property is the long, bureaucratic process of getting property titles. Thus, one way to invest in legal capacity would be to improve the processing speed for property titles.
Testable prediction 3: an exogenous increase in tax revenues will increase taxes collected from the newly titled properties. While this seems like the same prediction as prediction 1, there is an important nuance. The Besley and Persson model shows how governments can increase tax revenues by improving legal capacity. For a simple example of the causal mechanism, consider the decision to purchase a laptop computer. In a world with weak property rights protections (i.e., one with low legal capacity), the marginal consumer invests in a $200 laptop. But in a more secure world (i.e., one with higher legal capacity), the consumer chooses a $1,000 model. If sales tax is 10%, then by increasing legal capacity, the state went from collecting $20 in taxes to collecting $100. Improving legal capacity increased tax revenues without changing taxes or fiscal capacity.
If legal capacity truly improves, then we should see a differential increase in tax revenues from the titled properties. This is especially true if the taxpayer has outside options besides investing in the titled property. In many developing countries, the outside option to owning or renting titled land is squatting. Titled land may provide better protections, but if users must pay higher taxes to access the protections, they will weigh the costs of taxes against the increase in protection. If the benefits from property protections do not justify the taxes, then users can leave the property and take the outside option of squatting. Thus, tax revenues only differentially increase if the legal capacity has legitimately expanded.
All three predictions can be tested empirically. I test them in Haiti during the 1930s and 1940s.
Haiti’s Trujillo Refugees and the Response to World War II
Haiti in the 1930s and 1940s experienced a unique sequence of events that allow researchers to test the predictions. Because of World War II, the Haitian government experienced the tax revenue shock needed for the test. Additionally, the government was already shouldering the burden of a refugee shock that strained its capacity.
The 1942 Tax Reform
At the close of 1941, when the US mobilized in response to Pearl Harbor, the Haitian government faced a budget crisis. Customs revenues accounted for approximately 90% of the Haitian government’s revenues [Look at and cite 1939 Annual report], but America’s entrance into the war restructured Haiti’s trade, diverting high-tariff imports such as cars and cement. Customs receipts in 1941–1942 were lower than at any point in the previous 20 years, including every year of the Depression. Because the government relied so much on customs, the first year of US involvement shrank the budget by 5% (Banque nationale de la Republique d’Haiti 1942 p. 62). Anticipating the drop, the Haitian government rushed to find new revenues.1Before many weeks of war had passed, it became evident that new methods would have to be devised and special arrangements made in order to enable the country to ride out the storm” (Banque nationale de la Republique d’Haiti 1942 p. 2). The search for new sources of revenue included appealing to the US for help, receiving a line of credit from the US Export-Import Bank, and passing a special tax on coffee, the country’s largest export (Banque nationale de la Republique d’Haiti 1942 pp. 2–3, 7). But such measures were insufficient.
Table 1. Income Tax and Total Internal Taxes Collected by the Haitian Government, 1932-1946
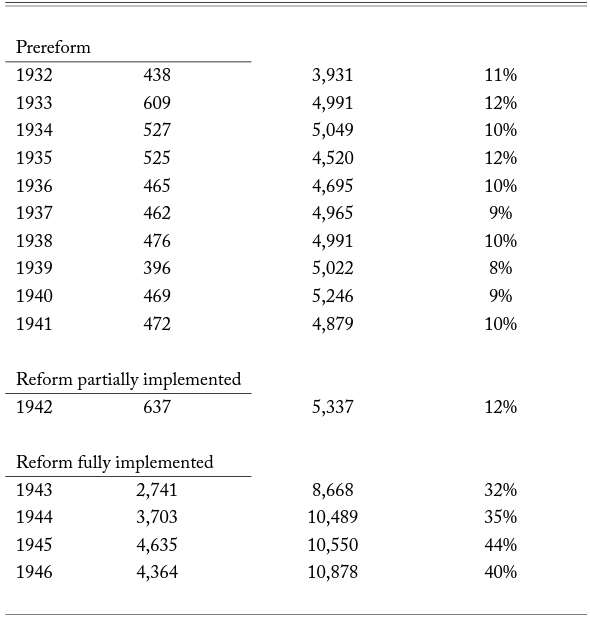
Note: Figures are in thousands of gourdes. Data come from the Annual Reports of the Fiscal Representative.
Desperate for revenue, the government resorted to reforming its tax on income. The government added more tax brackets and increased rates at each level. For instance, the top tax rate under the old law was 6%, but under the new law it soared to 15%. The reform immediately increased tax revenues. As shown in Table 1, income tax receipts increased almost tenfold from the 1930s to the 1940s. Before the reform, the income tax was an important source of government revenue, but it only accounted for about 10% of all internal revenues. After the reform, the income tax became the most important source of internal revenue and accounted for 40% of revenues.
The emergency tax reform seems to have solved the budget crisis. But stabilizing the government’s revenue was only one benefit of the reform. An unintended consequence was the boon to the internal revenue service.
Figure 2. Budget and Expenditures for the Haitian Internal Revenue Service, 1930-1948
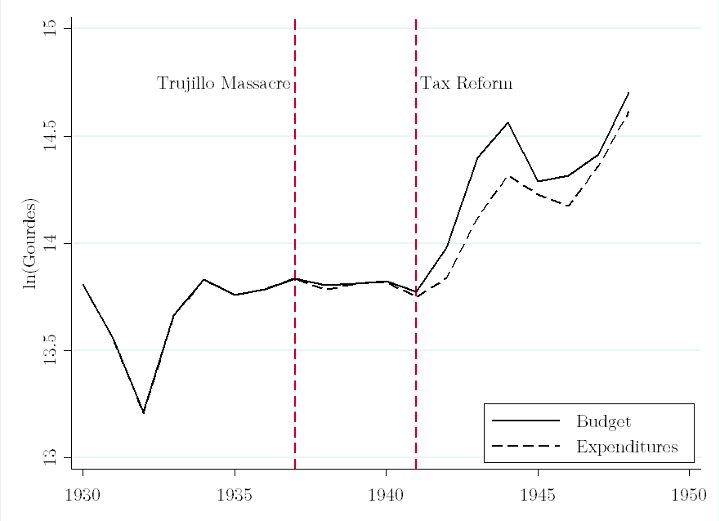
Note: Data come from the Annual Reports of the Fiscal Representative.
The Haitian Internal Revenue Service had a small budget, a result of an appropriations law that tied funding to internal revenues instead of customs. The appropriations law gave HIRS 15% of the government’s internal revenues. But before 1942, internal taxes accounted for only about 10% of the government’s meager revenues (Banque nationale de la Republique d’Haiti 1942 p. 15). While receiving a small portion of the smallest part of the government’s revenues was a disadvantage to HIRS, it did provide one advantage: the budget was predictable. Internal revenues were more consistent than customs receipts; indeed, the HIRS budget was unaffected by the plunge in customs revenues that came with US mobilization in 1942.
Indeed, the shift to increasing internal revenues was a boon to HIRS. From 1934 to 1941, as shown in Figure 2, the nominal budget for HIRS was flat, hitting a low of HTG 945,000 (USD 189,000) and a high of HTG 1,022,000 (USD 204,000). But because the income tax was an internal tax, and because the reform rapidly boosted the revenue collected, the budget for HIRS soared. By 1944 the budget had doubled to over HTG 2,112,000 (USD 422,000). Moreover, before the reform, expenditures were constrained by the budget. But after the reform, as shown in Figure 2, the budget expanded so quickly that expenditures could not keep pace.
Land Rentals and the Trujillo Massacre Refugees
For decades HIRS had run a land rental program through which it leased government-owned land to the public. But the program struggled. Program officials complained that the program’s tax collection agents were inexperienced and inefficient or, even worse, interns (Haiti Bureau du representant fiscal 1933 pp. 128–29). From 1926 to 1931, the program employed 80–90 rural agents responsible for collecting communal taxes. By 1933, that number had jumped to 151, but the administrators had little confidence in the new hires. Moreover, only a fraction of the agents worked in the regions outside the western population center: the three regions bordering the Dominican Republic in the East employed 36 agents total in 1933, and only 17 in 1931. Personnel shortages affected the program’s ability to collect taxes. Recovery rates—that is, rent collected versus rent due—varied greatly across districts and years, with rates ranging from 84% down to 22%. The median recovery rate was about 50%.2Figures come from annual reports submitted to the US secretary of state during the US occupation of Haiti (1915-1934): for example, Haiti Bureau du representant fiscal (1930).
Under normal circumstances, the change to the program’s budget might not have made much of a difference. But the budget increase was especially helpful because the country was four years into a refugee crisis that had imposed a hefty demand shock on the land rental program.
In October 1937, President Rafael Trujillo of the Dominican Republic ordered the Dominican army to massacre ethnic Haitians living in his country. The massacre was focused along the border in the northwestern region of the Dominican Republic, but the entire country felt its effects. Between the 1936 and 1950 censuses, at least 30,000 Haitians disappeared from the Dominican Republic (Palsson 2018), of which about 12,000 died in the massacre (Vega 1995). Palsson (2018) discusses the causes and consequences of the massacre, but the important detail for this paper is that many of the Haitians fleeing the Dominican Republic settled in Haiti. Many of the refugees were repatriated Haitians, but a significant portion were Dominicans of Haitian descent who had never been to Haiti. The magnitude of the refugee shock is unknown, but Palsson (2018) suggests that it increased the population of districts near the refugee camps by 8%.
Despite the large refugee population movements, Haiti’s government, led by President Sténio Vincent, did little to support them or to confront the Dominican Republic. The government started refugee camps near the border in the North and South (see Figure 3) to coordinate aid, but failed to provide the promised services (Lundahl 1979 pp. 303–4). Refugees were pictured in Life magazine waiting in long lines to get basic goods from the government.3Life, ”The U.S. Is Invited to Arbitrate a Massacre in its Front Garden,” December 6, 1937, pp. 74–77. Vincent did not strengthen border security or threaten Trujillo (Smith 2009 pp. 31–32). Even when diplomacy yielded a commitment from Trujillo to pay a meager USD 750,000 indemnity, the actual payment fell to USD 525,000, of which little went to the refugees (Heinlet al. 1996 p. 482). In fact, Vincent went out of his way to avoid conflict with Trujillo by appealing to the US for mediation (Roorda 1996).
Figure 3. Location of Haiti’s Refugee Camps and Tax Precincts, 1937
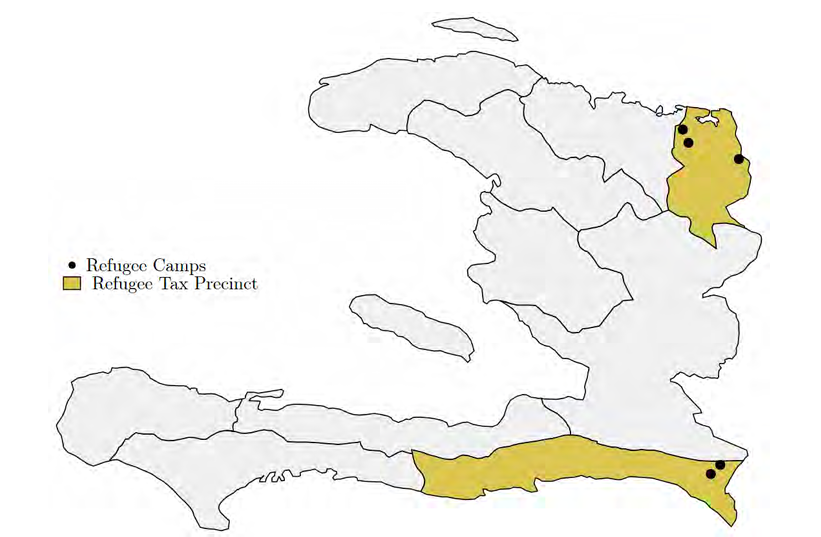
Note: The map shows the 10 tax precincts during this period (1934-1949). The two colored precincts contain the refugee camps and are the treated precincts in the synthetic control analysis in Section 5.3.
Observers have made a compelling case that President Vincent did not respond because his administration was protecting rents for him and the elite, but this view is incomplete without also considering state capacity. Vincent planned to seek reelection, and an aggressive response could have plunged his country into disastrous conflict, threatening his political prospects and future rents (Smith 2009 p. 32). Rather than worrying about the border confrontation, Vincent seemed more concerned with the threat to the elite’s rents in Port-au-Prince, allocating more soldiers to protect the capital than the border. His reluctance to act might have also had a racial element, since the political elite were light-skinned mulatre and the victims were dark-skinned noirs (Heinl et al. 1996 pp. 482–83). But the focus on rent extraction ignores the government’s capacity constraints. Some researchers recognize state capacity as a barrier to Haiti’s ability to create a credible military threat against the Dominican Republic (Heinl et al. 1996 p. 482; Smith 2009 pp. 31–32), but if capacity constrained the military response, then it likely also constrained the humanitarian response.
Although the government failed to adequately provide aid through its refugee camps, the camps were not the only form of aid the refugees relied on. The refugees also applied for properties under the rental program (Palsson 2018). It is this demand for property that will allow us to test the state’s legal capacity.
Data on Land Requests and Tax Revenues
Tax Revenues
Data on tax collection and personnel expenditures come from the Fiscal Department’s Annual Reports. The reports were created by US officials overseeing the US occupation of Haiti. From 1932 to 1949, the reports contained consistent and detailed information on tax collections across the country’s 10 precincts (shown in Figure 3). The data include how much each precinct collected on the properties it leased, which allows me to look directly at the effect of the refugees and capacity on tax collection.
Land Rental Program
Data on land rental requests come from notifications published in the government’s gazette, Le Moniteur. The law required the government to publish a notification in Le Moniteur once it approved a lease in case there were competing claims. Palsson (2018) uses data on the universe of agricultural properties published from 1928 to 1950 for (N = 5,792). In this paper, I expand the data to include notifications from the same period for urban properties (N = 1,519) and for properties where the type is not specified (N = 1,280).
Together, the data include 8,591 properties leased over 22 years. Each notification contains key descriptive information about the requested land, such as the district (commune) where it was located, when it was requested, and when it was approved.
The notifications also contain the dates for when the tenant requested the land and when the government approved the request. For each property, I calculate the processing delay, which is the number of months between request and approval. Before the massacre, the average delay for requests never exceeded 9 months, but after the massacre the average delay increased to almost 40 months. Delays stayed high until the income tax reform’s implementation, after which they dropped to the premassacre levels.
Testing the Besley and Persson Model
As outlined in Section 2, the Besley and Persson model has three testable implications. First, a tax revenue shock will improve fiscal capacity. Second, a tax revenue shock will increase legal capacity. Finally, a tax revenue shock will increase taxes collected from property. Below I test the three predictions.
Prediction 1: Fiscal Capacity
The first prediction from the Besley and Persson (2009) model, as outlined above, states that the increase in income tax revenues will increase future tax revenues. To examine this prediction, we can look at what happened to all nonincome sources of internal revenue. These revenues come from sources such as excise taxes on alcohol, vital statistics fees, and land rental payments. Increasing taxes on income should not directly affect taxes collected from these other sources. But if the additional revenue collected from income taxes is invested in state capacity, then revenues from these sources should increase.
Figure 4. Nonincome Sources of Haiti’s Internal Revenue, 1930-1949
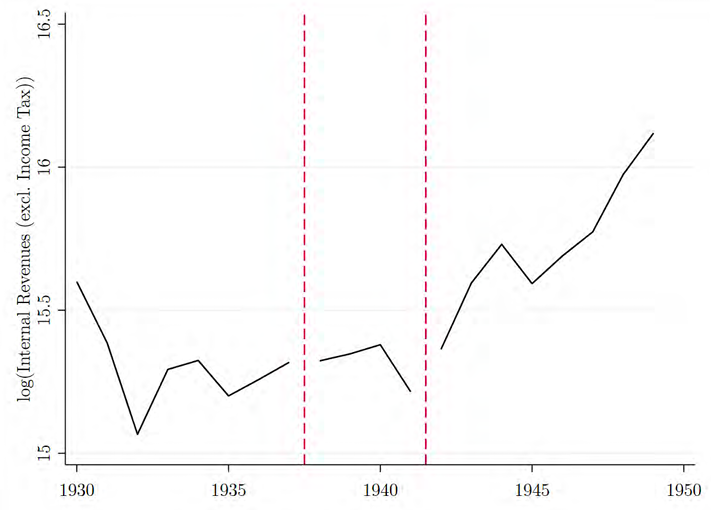
Note: Data come from the Annual Reports of the Fiscal Representative. All internal revenue sources are included except for income taxes.
The annual internal revenues (excluding income taxes) collected from 1930 to 1949 are plotted in Figure 4. From 1933 to 1941, nonincome sources of revenue experienced some variation but were effectively flat over the four years. But after the tax reform, there was a significant jump in revenues collected. And revenues continued to increase through 1949, when they reached an all-time high. The trend in Figure 4 is consistent with the Besley and Persson (2009) model.
The causal mechanism behind the increase in revenues should be an expansion in fiscal capacity. Ideally, to test the mechanism, a researcher would use a measure of fiscal capacity. But fiscal capacity is often measured with tax revenues, and using tax revenues would be tautological in this case. Since one way to expand fiscal capacity is to hire more tax collectors, I can use personnel expenditures. Figure 5 shows the evolution of salary outlays for personnel at HIRS. The data display a pattern similar to that of tax revenues in Figure 4: flat ahead of the reform, with a large and sustained increase after the reform.
Prediction 2: Legal Capacity
The second prediction from the Besley and Persson model states that the government will use the tax revenue shock to invest in legal capacity. Using the property rental program delays as a proxy for legal capacity, the evidence suggests the government undersupplied land because of capacity constraints and that the tax revenues coincided with an expansion in capacity. But one can get more insight by looking at how the capacity expansion affected the land rental program.
Figure 5. Haitian Internal Revenue Service (HIRS) Salary Outlays, 1930-1949
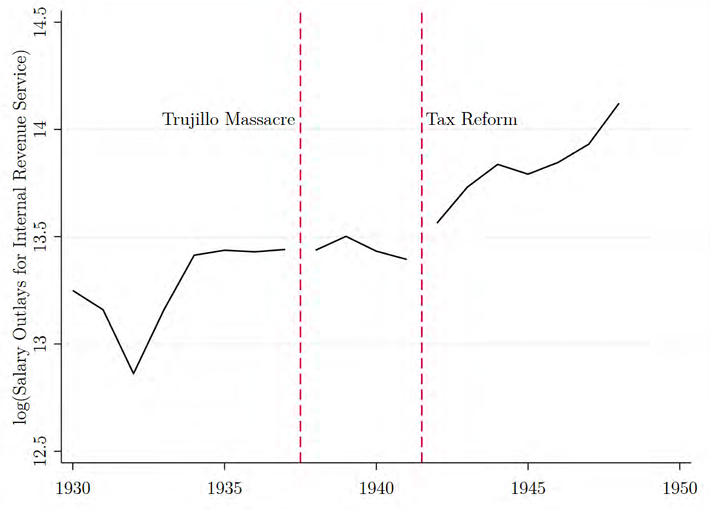
Note: Data come from the Annual Reports of the Fiscal Representative.
Figure 6. Haiti’s Number of Outstanding Property Requests, 1928-1950
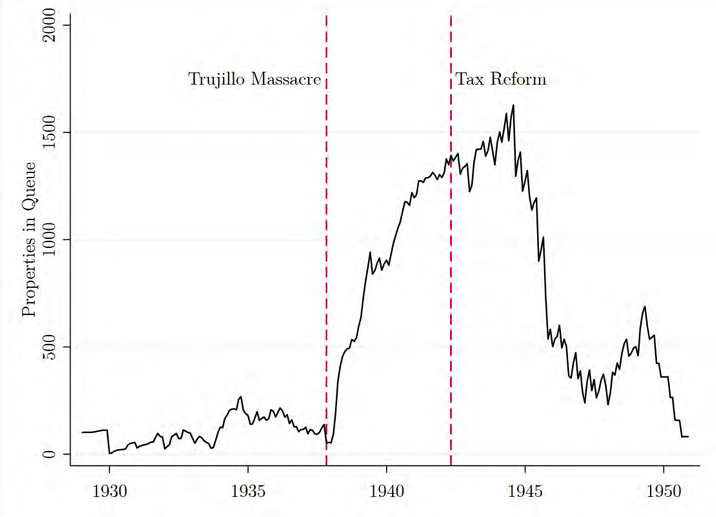
Note: Data come from calculations based on property approvals announced in Le Moniteur.
The data show a clear effect on demand from the refugees and evidence that the tax reform helped the program. From the information on the date requested and date approved, I can calculate how many properties were being processed in any month. Figure 6 shows the time series for the number of properties in queue. Before the 1937 massacre, the average number of properties in queue per month was between 50 and 100.4Palsson (2018) uses a difference-in-differences strategy to show that the refugees caused the increase in requests, an analysis replicated in the appendix with the expanded data. But after the massacre, requests quickly jumped and the queue expanded, peaking at over 1,500 properties in 1944. After 1945, the queue declined as the government processed properties. This decline could be related to the tax reform, but from the time series it looks as if it happened much later. But the graph does not account for whether property requests increased at this time as well, which is why I turn to the hazard analysis.
Since the program’s efficacy is determined by how quickly it processes requests, I estimate a Cox hazard model, where the hazard for property request i being processed is given by
(1) 
where  is the hazard function (failure is defined as the government processing the request);
  is the base rate hazard;
  is the number of months in the queue; and
  are the included covariates for property request
  . The covariates include permanent features of the property request — its type (urban or rural) and the number of properties in the queue when the property was requested—as well as time-varying features—a dummy for whether is after the massacre and another dummy for whether is after the tax reform.
The effects of the increase in tax revenue and the influx of refugees are captured with the time-varying dummy variables. The indicators vary over time because the property request sits in a queue. So if a property request was submitted in July 1937, the dummy variable for whether the massacre had occurred would equal zero; but if the request was still in the queue in November 1937, the dummy variable would equal one. Similarly, the tax reform dummy is equal to zero for months before May 1942 and to one for May and all months after. Thus the hazard function accounts for the events happening while the request was still being processed, which is important for capturing the dynamics of the changes.
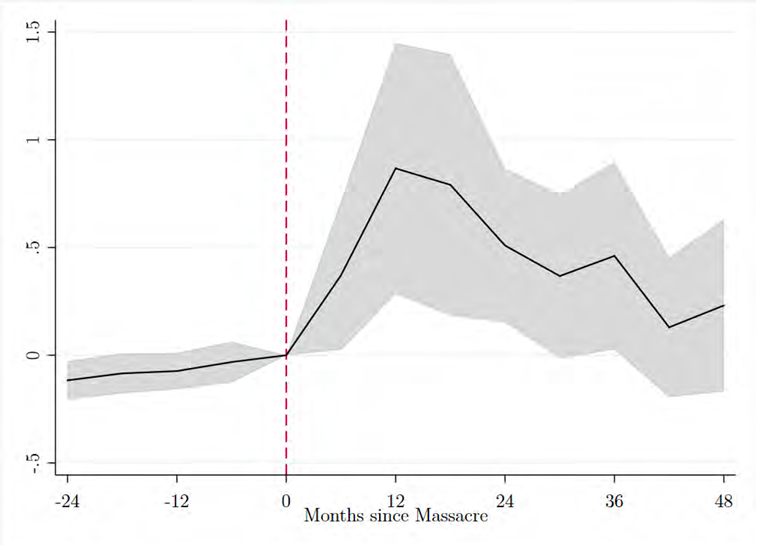
The primary interest of the analysis is to see how the revenue shock and refugee influx affected the processing time for requests. From the hazard model, we can derive survival curves (where death means the property was processed) evaluated at three different points: before the massacre, between the massacre and the tax reform, and after the tax reform.5Note that these three points correspond to three combinations of dummy variables. Before the massacre, both dummy variables equal zero. Between the massacre and the reform the massacre dummy equals one but the reform dummy equals zero. And after the reform both the massacre and reform dummies equal one. The three survival curves are plotted in Figure 7. Note that a decrease in survival rates indicates the government is processing requests faster, while an increase in survival rates indicates the government is struggling. Before the massacre, the solid line indicates there was a 20% chance that approval would take longer than eight months. Between the massacre and the tax reform, survival rates increased substantially. The probability that approval would take longer than eight months increased to 85%, and there was a 20% chance that it would take longer than four years. But once the tax reform increased the government’s capacity, the curve returned to premassacre levels. The return to the premassacre survival curve, even as more requests enter, suggests there might be an equilibrium level of state capacity relative to the demands placed on it. The massacre moved the government away from this equilibrium, but the tax reform allowed the government to return to it.
Figure 7. Probability That Property Is Still Pending Given the Number of Months Since Requested
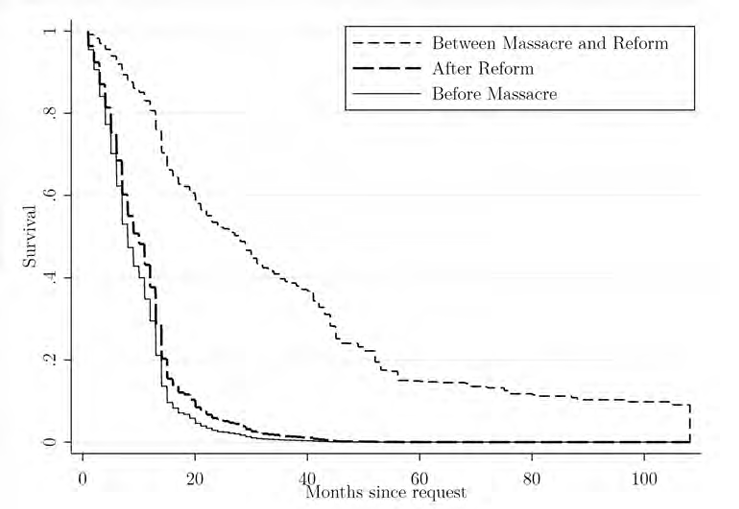
Note: The survival curves are derived from a Cox proportional hazard model that controlled for property type, the number of properties in the program’s queue at the time of the request, and dummy variables for when the massacre and reform occurred.
Although I propose the shift in survival curves was caused by capacity constraints, there are alternative hypotheses that could also explain the shifts. For instance, the government might have restricted land supply to increase rents or to downplay any risk of retaliation from the Dominicans. But there are two pieces of evidence that strongly suggest the increase in delays was a capacity problem.
The first evidence that there were significant capacity constraints is that the increase in delays occurred for all properties requested throughout the entire country, not just in the areas affected by refugees. Suppose the government intentionally increased delays to extract rents. Potential rents would be highest in the districts with the highest demand, and therefore we should see longer delays for properties requested by refugees. I can test this hypothesis with the following regression analysis:
(2) 
where  indicates the delay between the request and processing for property in district
  at time ;
  is a dummy variable that equals one if the district is within 20 kilometers of a refugee camp (\citealp{Palsson2017} shows that these districts were the relevant treatment group);
  indicates that the property was requested after the massacre;
  are property-specific covariates, such as the type (rural, urban, or unknown); and
  and
and  are district and time fixed effects. The coefficient of interest is
  , which describes how much longer requesters of properties near refugee camps had to wait compared to requesters of properties farther away after the massacre happened. Note that is a descriptive statistic and is not meant to identify a causal effect. If delays increased because the government was extracting rents from the refugees by restricting supply, then we would expect to be greater than zero. We would expect the same result if the government refused to process properties on the border because it did not want to threaten the Dominican Republic.
Table 2. Testing Relationship between Delays and Potential Rents
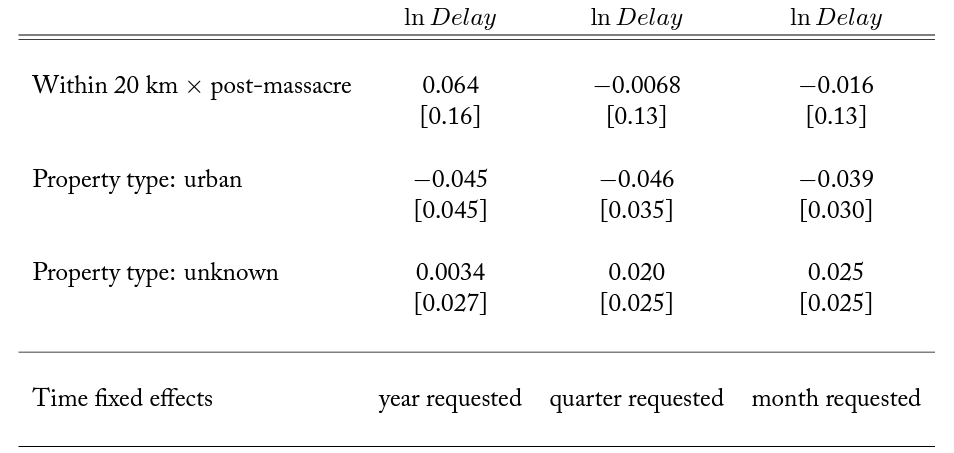
Note: The dependent variable is the natural log of the delay. All regressions contain district fixed effects. The sample size for all regressions is 8,591 plots. Standard errors are clustered at the district level (103 clusters).
Table 2 tests the hypothesis. Initially, it appears that the prediction is true: controlling for the type of property, the district where it was located, and the year it was requested, properties located close to refugee camps in the post-massacre period had longer delays, though the difference is not statistically significant. But once we narrow the time-requested fixed effects, the difference dissipates. For similar properties requested in the same month (e.g., March 1939), there is no difference in delays for the one located near a refugee camp. If anything, refugee camp properties were processed quicker, though again there is no statistically significant difference. Therefore, the delays do not seem to be related to the potential to extract rents.
Second, a capacity constraint best explains an anomaly in delays for properties requested immediately around the massacre. The anomaly is seen when comparing the difference in average delays for agricultural and urban properties in the months just before and after the massacre. Refugees primarily demanded agricultural plots, which required more resources to survey and appraise: urban properties were systematically processed faster than agricultural properties, as seen in Table 2. Comparing the rural and urban properties allows us to observe the immediate effect of refugees on delays. I estimate the following regression:
(3) 
where  indicates the processing delay for property in month ;
  indicates whether property was an agricultural property; and
  and are district and time fixed effects. The coefficient
  gives the difference in delays between agricultural and urban properties in month . The sample period is limited to requests made from November 1937 to October 1939, a two-year window centered on the massacre.
Figure 8. Difference in Delay between Urban and Rural Properties before and after the Massacre
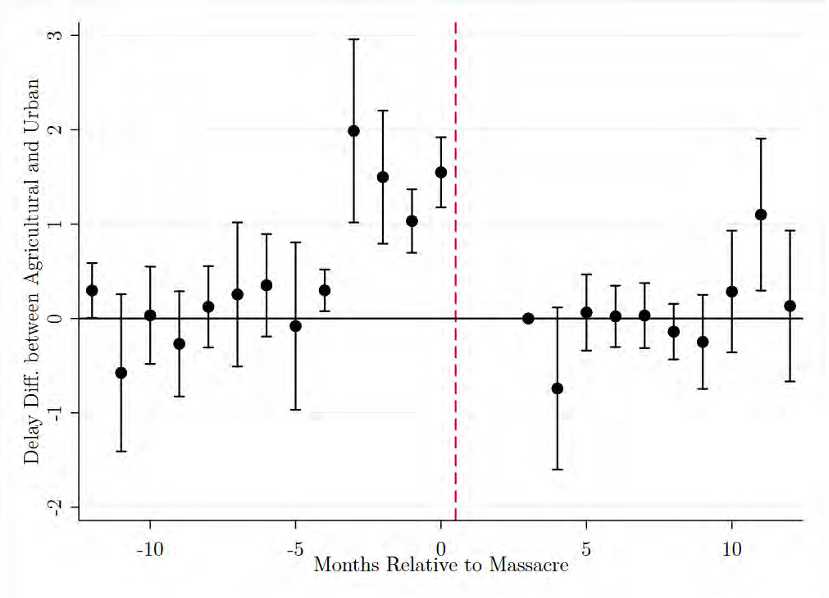
Note: The omitted month is three months after the massacre (January 1938). No agricultural properties were requested in November or December 1937 (one and two months after the massacre).
Figure 8 plots the for all months from the above regression. The difference in delays between agricultural and urban properties stays consistent throughout most of the surrounding months, except for an anomaly for plots requested in the four months before the massacre. For such requests, delays for agricultural properties spiked: instead of waiting ten months, tenants had to wait five years.
The premassacre spike in delays can be explained by the government diverting its limited capacity to address the needs of the refugees. When the average process time was seven months, plots requested in July 1937 were still being processed when the refugees entered in October. The government had few employees to administer the program and survey properties. The urgency of the refugee crisis required the government to send its few employees to help with the requested plots. Thus, the requests that were still being processed were put on hold until the government could cover the refugees’ needs. Table 2 suggests that over time the government shifted resources to help refugees until the marginal benefit equaled the marginal cost, adding enough employees to address the refugees’ needs without abandoning the nonrefugee areas.
The survival curves show that the refugees strained the government’s capacity and that the tax reform increased capacity. Before the refugees arrived, the government was in a capacity-request equilibrium. But the refugee shock pushed the government out of the equilibrium by flooding it with requests. Because the government did not expand capacity, delays increased. But once World War II forced the government to change its income tax law, the government invested the extra tax revenue in expanding capacity. The government returned to the pre-refugee capacity-request equilibrium.
The evidence from delays also speaks to the effect refugees have on natives. The natives who requested land just before the refugees arrived were then hurt by the burden the refugees put on the government. Moreover, Table 2 shows that delays in refugee districts were no different from delays in nonrefugee districts, which means natives all over the country felt the refugees’ effects and were forced to wait for property. While a utilitarian values the refugees’ welfare as much as the natives’, it is easy to see that the delays could affect the country’s political economy and spur a backlash.
Prediction 3: Taxes Collected from Property
The third prediction from the Besley and Persson model says that the increase in tax revenues should increase future tax revenues from the properties protected under the expansion in legal capacity. In this case, we should see more revenues collected from the rental properties. While it seems obvious that rental revenues should increase, an increase was not guaranteed. Tenants were not obligated to remain on the rented land. Many farmers avoided taxes through squatting. If tenants felt that the rent they were paying did not justify the protections they received, they could exercise their outside option and squat somewhere else. Rental revenue will only increase if the property is protected—that is, if legal capacity has expanded.
To test this hypothesis, I compare tax precincts with and without refugees using a synthetic control analysis. The data on tax collections are available only at the tax precinct level; there were 10 tax precincts in the country during this period. Of these 10, only two hosted refugee camps (see Figure 3). Thus, the small sample size makes a difference-in-differences approach difficult. Fortunately, a generalized version of difference-in-differences is available in the synthetic control approach (Abadie et al. 2010). Synthetic control and difference-in-differences are similar, except that in difference-in-differences the analysis attributes equal weight to all control observations whereas the synthetic control weights control observations to best match the treatment group. Although I focus on the results from the synthetic control analysis, the appendix contains the results from a difference-in-differences analysis and compares them to those of the synthetic control analysis, revealing similar results.
Because I have limited data, constructing the synthetic control is straightforward. Because the precincts are treated by the refugees before the tax reform, I use October 1937 as the treatment date. The analysis, then, will look at how the precincts behave when the refugees arrive and whether there was a change in 1942 concurrent with the tax reform. The synthetic control weights are estimated from taxes collected from October 1933 to September 1937. Receipts are transformed with a logarithmic transformation and normalized to zero in 1937 (the financial year before the refugees arrived).
The synthetic control analysis shows that the refugees had a large and sustained impact on public land rental receipts, and the effect was magnified by the tax reform’s effect on capacity. Figure 9(a) plots the treatment and synthetic control. From 1933 to 1937, the two groups followed similar patterns. But after 1937, the precincts diverged. Between the refugees’ arrival in 1938 and the tax reform in 1941, refugee precincts’ revenues from land rentals were about 20% higher than nonrefugee precincts (P values are significant and are reported in Table 3). Then, when the tax reform passed, refugee precincts increased yet again, by about 20%, widening the gap between the two types of precincts. As nonrefugee districts collected more rental revenue, the gap narrowed, but stayed large in 1949.
The evidence in Figure 9(a) is consistent with the increase in tax revenues being invested in legal capacity. But one factor that could confound the analysis is if there was a separate economic shock that also increased land values and was coincident with both the timing of the reform and the location of the refugees. For instance, US mobilization may have increased demand for goods produced in the refugee precincts, which subsequently increased land values. Such a concern is valid but fails to explain why there are unmistakable shifts not just when the US mobilized but also when the refugees first arrived. Regardless, to address this concern, I have done a placebo synthetic control analysis, replacing the dependent variable with documentary recording fees—that is, fees collected from recording mortgages and property transfers. Looking at recording fees is a great placebo test because, like the rental receipts, the fees are related to the value of land, but the refugees did not have the assets to get mortgages or buy property.
Figure 9(b) displays the treatment and synthetic control units using property transfer receipts as the dependent variable. The patterns found for property transfer receipts are distinct from the patterns found for land rental receipts. There were no shocks in recording fees that were unique to refugee precincts, neither following the refugees’ entrance nor after the tax reform. The post-1942 increase affected all precincts equally. This is consistent with the evidence I found when testing prediction 1 (above). An increase in fiscal capacity improved the state’s ability to collect taxes from property transfers, but only an increase in legal capacity could create the unique increase in rental revenues found in refugee precincts.
Figure 9. Effect of Refugees on Receipts from Haitian Public Land Rentals, 1930-1949

Note: The graphs display the treatment and synthetic control units. Panel (a) displays land rental receipts, the variable of interest, and panel (b) shows property transfer receipts, the placebo. The dark red line indicates when treatment was assigned in the synthetic control analysis (when the refugees arrived). The light red line indicates the 1942 tax reform, though the analysts did nothing to account for it.
Conclusion
The Besley and Persson model describes how states invest in capacity so that they can provide public goods. While the model is often cited, it has been difficult to test. In this paper, I test some of the model’s core features using an exogenous shock to tax revenues in Haiti in 1942. I find evidence to support the model: the Haitian government invested the tax revenue in expanding fiscal and legal capacity.
Although the paper provides evidence that the government used a tax revenue shock to invest in state capacity, there is reason to question the external validity. The refugee shock could have made expanding legal capacity more urgent. Indeed, the evidence from Figure 7 shows that capacity returned to the pre-refugee levels, indicating there was an equilibrium level of capacity. If a government receives a tax revenue shock when it is in equilibrium, then it may not invest in capacity.
Speaking of the refugees, the paper has important implications for refugee policy. In the US, some evidence suggests that the government supports refugees in the short run, but in the long run the refugees compensate for it through their taxes (Evans and Fitzgerald 2017). The implications of Figure 9 are important. Refugees increased tax revenues, but their full contribution was limited by capacity constraints. Once the government had capacity to distribute properties and collect rents, revenues increased even more. Low-capacity countries that accept refugees may not be able to handle the influx unless it is accompanied by an increase in capacity. Policy makers should consider that refugees have different marginal impacts for low- and high-capacity countries. Since most refugees move to neighboring countries, such considerations should be given priority in resettlement programs.
Appendix
Confirming Refugee Effect on Property Requests
Figure A1. The Trujillo Massacre’s Effect on Land Requests for Haitian Districts within 20 Kilometers of a Refugee Camp
Note: The shaded area represents 95% confidence intervals.
Palsson (2018) shows that the Trujillo refugees increased requests for government land rentals in Haiti, but the analysis was limited to only agricultural properties. Since this paper expands the sample to urban and unknown properties, I repeat the difference-in-differences analysis. The treatment group in the difference-in-differences analysis is districts that are close to a refugee camp (i.e., within 20 kilometers). The data are condensed into six-month periods, and the following regression is estimated:
(4) 
where  is the number of requests per 1,000 inhabitants in commune in the six-month period ,
  is a commune fixed effect, and is a period fixed effect. The
  is an interaction between treatment status (district is within 20 kilometers of a refugee camp) and the six-month period ; hence, the are the differences in requests between treatment and control districts in period . The coefficients are estimated for each period before and after the massacre to test for pretreatment trends. Because in many years equals zero, the dependent variable is transformed using the inverse hyperbolic sine, which is similar to the logarithmic transformation but evaluated at zero(Burbidge et al. 1988). To account for serial correlation, standard errors are clustered at the commune level. The results are plotted in Figure A1 and confirm (a) that there were no pretreatment differences in request trends and (b) that the refugees had a large, causal impact on requests.
Comparing Synthetic Control to Event Study
The synthetic control analysis presented in Section 5 provides convincing evidence that the refugees and the capacity expansion had significant effects on tax revenues. But a weakness of the synthetic control analysis is that researchers have some degree of freedom in selecting the synthetic control. To assuage concerns about researcher bias, I also estimate a difference-in-differences event study and compare the estimated treatment effects to those of the synthetic control. To test for refugee effects on tax receipts, I run the following regression:
(5) 
where  is, for tax precinct in year , the tax receipts from land rentals (though in other situations below, the dependent variable will be taxes in other categories). The regression includes fixed effects for the year () and the precinct (). The
  variable is an indicator for whether the tax precinct hosted a refugee camp, and the gives, for year , the difference in receipts between refugee and nonrefugee tax precincts. Because there are only 10 precincts, I obtain confidence intervals for using the wild bootstrap-t methods described in Cameron et al. (2008) and implemented in Stata by Judson Caskey.
Table 3. Treatment Effect Estimates for Synthetic Control and Difference-in-Differences Analysis
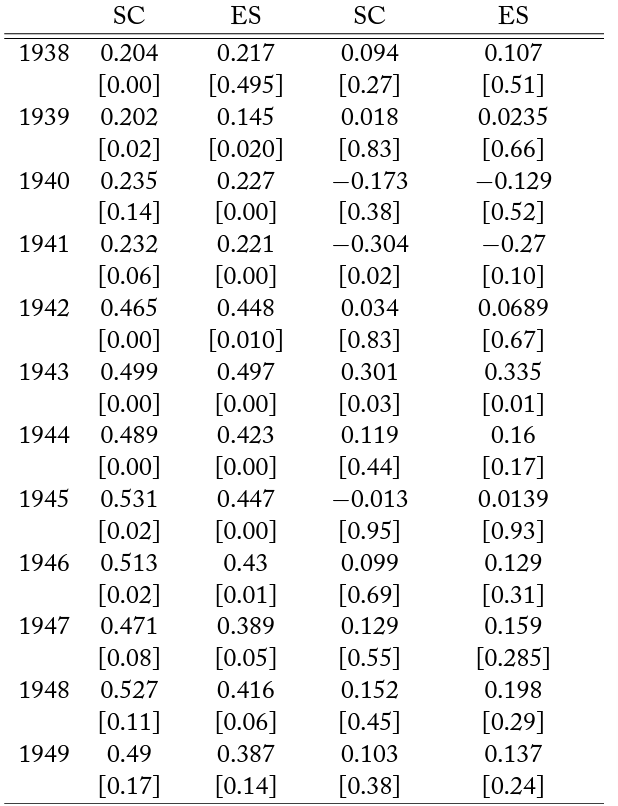
Note: P values are in brackets. The column headers indicate the approach used to estimate the treatment effects–SC means synthetic control and ES means event study.
References
Abadie, A., Diamond, A., and Hainmueller, J. (2010). Synthetic control methods for comparative case studies: Estimating the effect of California’s tobacco control program. Journal of the American Statistical Association, 105(490):493–505.
Alix-Garcia, J., Walker, S., Bartlett, A., Onder, H., and Sanghi, A. (2018). Do refugee camps help or hurt hosts? The case of Kakuma, Kenya. Journal of Development Economics, 130:66–83.
Banque nationale de la Republique d’Haiti (1942). Annual Report of the Fiscal Department for the Fiscal Year October 1941–September 1942. Port-au-Prince, Haiti: Imprimerie de l’Etat.
Besley, T. and Persson, T. (2009). The origins of state capacity: Property rights, taxation, and politics. American Economic Review, 99(4):1218–1244.
Burbidge, J. B., Magee, L., and Robb, A. L. (1988). Alternative transformations to handle extreme values of the dependent variable. Journal of the American Statistical Association, 83(401):123–127.
Cameron, A. C., Gelbach, J. B., and Miller, D. L. (2008). Bootstrap-based improvements for inference with clustered errors. The Review of Economics and Statistics, 90(3):414–427.
Dal Bo, E., Finan, F., Li, N. Y., and Schechter, L. (2018). Government decentralization under changing state capacity: Experimental evidence from Paraguay. NBER Working Paper 24879.
de Soto, H. (2000). The Mystery of Capital: Why Capitalism Triumphs in the West and Fails Everywhere Else. Basic Books.
Evans, W. N. and Fitzgerald, D. (2017). The economic and social outcomes of refugees in the United States: Evidence from the ACS. NBER Working Paper 23498.
Figlio, D. N. and Özek, U. (2017). Unwelcome guests? The effects of refugees on the education outcomes of incumbent students. NBER Working Paper 23661.
Haiti Bureau du representant fiscal (1930). Annual Report of the Financial Adviser-General Receiver for the Fiscal Year October 1929–September 1930. Evening Post Job Printing Office, Inc.
Haiti Bureau du representant fiscal (1933). Annual Report of the Financial Adviser-General Receiver for the Fiscal Year October 1932–September 1933. Evening Post Job Printing Office, Inc.
Heinl, R. D., Heinl, N. G., and Heinl, M. (1996). Written in Blood: The Story of the Haitian People, 1492–1995 (rev. and exp. ed.). Houghton Mifflin Co.
Johnson, N. and Koyama, M. (2017). States and economic growth: Capacity and constraint. Explorations in Economic History, 64:1–20.
Khan, A. Q., Khwaja, A. I., and Olken, B. A. (2016). Tax farming redux: Experimental evidence on performance pay for tax collectors. The Quarterly Journal of Economics, 131(1):219–271.
Lundahl, M. (1979). Peasants and Poverty: A Study of Haiti. Croom Helm.
Muralidharan, K., Das, J., Holla, A., and Mohpal, A. (2017). The fiscal cost of weak governance: Evidence from teacher absence in India. Journal of Public Economics, 145:116–135.
Muralidharan, K., Niehaus, P., and Sukhtankar, S. (2016). Building state capacity: Evidence from biometric smartcards in India. American Economic Review, 106(10):2895–2929.
Olken, B. (2007). Monitoring corruption: Evidence from a field experiment in Indonesia. Journal of Political Economy, 115(2):200–249.
Palsson, C. (2018). Small farms, large transaction costs: Incomplete property rights and structural change in Haiti. Working Paper.
Roorda, E. P. (1996). Genocide next door: The Good Neighbor Policy, the Trujillo regime, and the Haitian massacre of 1937. Diplomatic History, 20(3):301–319.
Smith, M. J. (2009). Red and Black in Haiti: Radicalism, Conflict, and Political Change, 1934–1957. University of North Carolina Press.
Vega, B. (1995). Trujillo y Haiti (vol. 2: 1937–1938). Fundación Cultural Dominicana.
Zhu, H., Taylor, J. E., Gupta, A., Filipski, M., Valli, J., and Gonzalez-Estrarda, E. (2018). Economic impacts of giving land to refugees. Working Paper.