


 NJ.com
 SSRN
SSRNIntroduction
According to the National Institute of Health, more than 660,000 people suffer from kidney failure in the United States (NIH 2016). End-stage renal disease (ESRD) is an irreversible condition that results from chronic kidney failure, requiring either a kidney transplant or dialysis for the patient to survive. Dialysis is a procedure replicating the function of kidneys—external equipment artificially cleans patient blood and removes excess fluid. From the 1980s through the mid-2000s, the incidence of ESRD increased, and it has since leveled off (NIH 2016). This increase was driven primarily by the aging of the population, an increase in the prevalence of diabetes, an increase in the survival rate from heart disease, and a more widespread acceptance and use of dialysis as a treatment option (Dor et al. 2007).
Despite the increased usage of hemodialysis as a treatment, it still suffers from some technical inefficiencies (Dor et al. 2007). Hemodialysis workers often complain about their inability to check on patients due to their workload. Understaffing can lead to quality deterioration. This can take the form of infections or an inability to detect complications sufficiently early to recommend the appropriate intervention.
Policy makers in New Jersey tried to remedy this potential quality deterioration by introducing a unique regulation. In 2005, New Jersey implemented a rule requiring that each renal-hemodialysis clinic employ a nurse to serve in an administrative capacity and that this nurse (“administrative nurse”) not be involved in any aspect of treatment or the provision of care. It is the only state in the nation to have this regulation. It was designed to protect patients by ensuring division of labor at hemodialysis clinics such that the nurse supervising treatment (“charge nurse”) would not be distracted by administrative duties.
In this study, we estimate the impact of the New Jersey regulation. Hiring additional staff may help to ensure patients receive more care from clinic staff, but requiring that the charge nurse never serve in an administrative capacity may increase the cost of operating the clinic without providing benefit for the patients receiving treatment. In order to test which of these effects is stronger, we use the synthetic control method (SCM) to compare patient outcomes in New Jersey to a weighted average group of control states that produce a “synthetic New Jersey” meant to mimic New Jersey but without the nurse-staffing rule. We find no evidence that the mandate improved the quality of care offered by hemodialysis clinics.
Background
Dialysis facilities typically are open eighty to ninety hours a week to accommodate patient and transportation schedules. Staffing models at dialysis clinics are similar to that of a hospital. The senior authority is an administrator chosen by the board of directors to whom all other employees answer. The administrator is not required to have a nursing degree. Every facility also employs a medical director responsible for ensuring it adheres to medical protocols and quality of care. During hours of operation, the clinic is staffed by technicians, who administer the treatments, and a supervising charge nurse. Technician staffing is necessary to ensure that every patient is attended to properly and medications are given as needed. Federal regulations do not demand the administrator be physically present during all hours of operation, and they do not mandate a minimum number of hours. When the administrator is absent, the facility is supervised by the director of nursing. Most clinics throughout the country have a full-time director of nursing and a part-time administrator who serves several facilities. For example, five clinics located in a single area might have the same administrator. Each clinic, however, is fully staffed with caregivers and always staffed with a director of nursing who supervises the technicians and may also provide care as needed.
While at first glance hemodialysis may seem similar to other health care procedures, it differs from traditional health care in several important ways (Rastogi and Chertow 2018). In hemodialysis, one caregiver (a technician, a licensed practical nurse, or, rarely, a registered nurse) treats and monitors several patients undergoing treatment in the same area—a distinction of key interest for this study. Health care providers have a long-term relationship with patients since hemodialysis is treatment for a chronic condition. Additionally, research has shown that factors besides the staff ratio play a substantial role in patient outcomes (Rastogi and Chertow 2018).
Hemodialysis is typically delivered in specialized hemodialysis clinics that can be operated as either nonprofit or for-profit, although more than 90 percent are for-profit (Brooks et al., 2006). The question of whether the two types provide different levels of care has been examined in previous research. For-profit clinics tend to use fewer resources in providing hemodialysis than nonprofits. This could be caused by a hard budget constraint forcing for-profits to operate with greater efficiency, or it could be that for-profits reduce costs to maximize profit at the expense of optimizing patient health outcomes. While earlier studies (McClellan et al. 1998; Port et al. 2000) found that for-profit hemodialysis clinics have a lower survival rate for patients, they suffer from severe limitations as a result of the inability to perform randomized control trials. Thus, their results may be driven by selection bias. Using an instrumental-variables estimation that alleviates this concern, Brooks et al. (2006) find no evidence of a relationship between patient outcomes and whether a dialysis clinic is for-profit.
Quality may also differ depending on whether the hemodialysis clinic is an independent location or a part of a chain of clinics. Since 1991, the changing mix of clinics caused by increasing mergers and acquisitions has been a concern (Rettig and Levinsky 1991). Acquisition may improve efficiency and quality through greater specialization and dispersion of knowledge between clinics, or it may diminish quality through a lack of competitive pressure. While the quality of hemodialysis services has improved in both independent and chain clinics, quality improvements increased at a slower pace in clinics purchased by a chain compared to those that remained independent (Erickson et al. 2019).
There is conflicting evidence that an increase in spending has a measurable effect on the quality of services provided. Wennberg et al. (2002) finds little evidence of an improvement in outcomes from increases spending. Using a panel data set of twelve countries, Dor et al. (2007) find evidence of a minor reduction in health outcomes associated with increases in spending. The authors conclude that no simple change could drastically improve patient outcomes; rather, improvement requires a mix of policies. McClellan (2010) suggests that to improve patient outcomes, hemodialysis clinics should encourage physician engagement with patients, foster interpersonal relationships between the hemodialysis team and patients, and match patients with experienced and high-quality dieticians.
Another potential way to improve quality pursued by a handful of states, including New Jersey, has been regulation that mandates a specific minimum ratio between hemodialysis-clinic staff and patients. While different states require different ratios, each implemented these regulations with the purpose of ensuring that nurses dedicate time to each patient. In 2017, California lawmakers unsuccessfully sought to pass a law mandating a ratio between staff and patients and requiring forty-five minutes between rounds of patients (Rastogi and Chertow 2018).
Federally, the Centers for Medicare and Medicaid Services has no staffing requirements for hemodialysis clinics. However, some in the health care industry worry that clinics are understaffed and this potentially reduces the quality of care. As a result, eight states have implemented their own rules requiring specific minimum ratios between staff and patients. To date, there is no evidence that the rules have an impact on the quality of care, despite policy makers’ intention of providing safe and effective treatment for patients (Rastogi and Chertow 2018).
New Jersey regulators in 2005 implemented a new rule requiring each dialysis clinic employ a director of nursing services that is prohibited from interacting with and treating patients.1Subchapter 5 Section 8.43A-5.1, 8.43A-24.6(a), and 8.43A-24.7. New Jersey is already one of eight states (along with Georgia, Maryland, Massachusetts, Oregon, South Carolina, Texas, and Utah) that have staffing-ratio requirements (Rastogi and Chertow 2018). The details of each state’s regulation can be found in table 1. While maintaining a certain staffing ratio increases the cost for clinics, the New Jersey rule imposes a unique burden. Since dialysis clinics are open more than eighty hours a week, clinics in New Jersey are forced to hire two additional full-time administrative nurses (or full-time equivalents) that are not permitted to provide care to patients. According to the Bureau of Labor Statistics, the median annual salary for a registered nurse in New Jersey in 2018 was $61,750 excluding benefits (BLS 2019). Conservatively, this means an additional cost of more than $120,000 a year for dialysis clinics in New Jersey.
Table 1. Details on nurse-staffing ratios in the United States
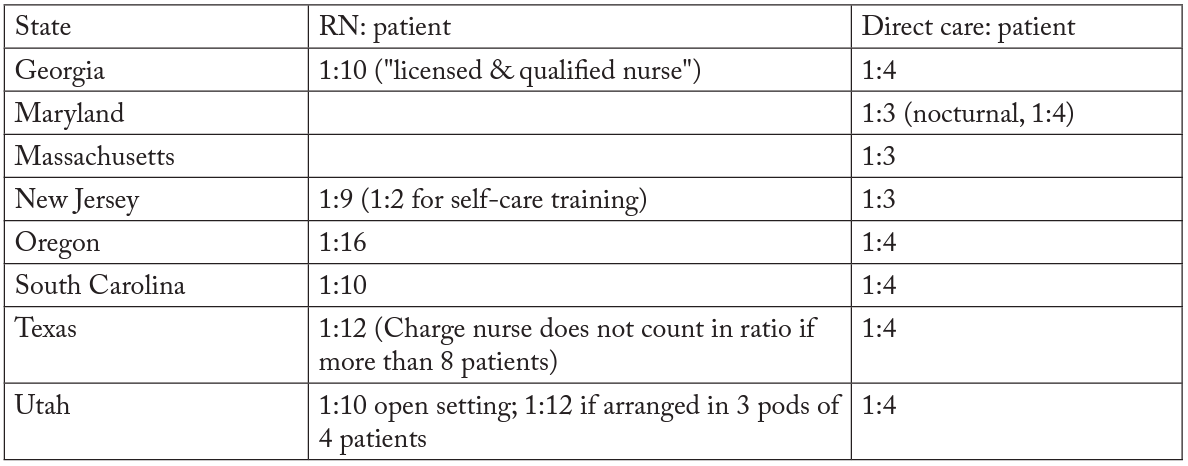
Source: “Dialysis staff ratio bill” 2017
After accounting for the unintended consequences of new regulations, the regulations may result in more costs than benefits. In the case of New Jersey, the rule’s unintended consequences could offset (or more than offset) the rule’s positive effect on patient health outcomes. As noted, the cost of operating a clinic increases. For smaller, independent clinics, increasing the cost of operation accelerates the trend of acquisition by hemodialysis-clinic chains. Not only does this increase the resources used in hemodialysis treatments, but it slows quality improvement (Erickson et al. 2019). Additionally, it may lead to fewer locations receiving hemodialysis treatment, thus reducing access for patients. Combined, these effects reduce the potential gains from increasing staffing in dialysis clinics.
Data
We develop a panel of annual data for all states covering the years 1995 through 2015. The selection of years was restricted by the availability of the data, but we believe that ten years of data before and after the treatment is sufficient. Our primary data source is the United States Renal Data System (USRDS). The USRDS maintains a database of ESRD patients and their characteristics. It gathers data from multiple sources, including the Centers for Medicare and Medicaid Services (CMS), the Organ Procurement and Transplantation Network (OPTN), the Centers for Disease Control (CDC), and the US Census Bureau. The CMS reports data on incidence and mortality rates. The USRDS breaks down data by gender, race, ethnicity, and cause of ESRD. State-level annual-income data were obtained from the Bureau of Economic Analysis (BEA), and the Consumer Price Index was gathered from the Bureau of Labor Statistics (BLS).
Our key outcome variables are the death rate per thousand patient years, ESRD hemodialysis facilities per thousand patients, and the hospital admission rate per thousand patient years for ESRD patients. The number of hemodialysis clinics per thousand patients is only available from 1999 to 2015, and the hospital admittance rate is limited to 2004–15.
We excluded Georgia, Maryland, Massachusetts, Oregon, South Carolina, Texas, and Utah from our data. Each of these states, like New Jersey, has set (or previously set) staff-to-patient ratios during the sample period. After removing observations from these seven states and New Jersey, we were left with forty-two states. Table 2 presents the summary statistics for our sample. All three measures of hemodialysis-clinic quality vary substantially between states. The mean death rate per thousand patient years for hemodialysis patients in our sample was 234 and ranged from a low of 131 to a high of 364. The number of hemodialysis facilities per thousand patients was nineteen and ranged from eight to fifty-two. The hospital admittance rate per thousand patient years had a mean of 1,855, with a low of 908 and a high of 2,613. Nearly 70 percent of the hemodialysis patients in our sample were over the age of fifty-five. African Americans amounted to 27 percent of the hemodialysis patients in our sample. African Americans are overrepresented because they have a higher risk of health issues that result in kidney failure.2For more information, see https://www.kidney.org/news/newsroom/factsheets/African-Americans-and-CKD Diabetes was the cause of 43 percent of ESRD of the patients in our study, but in some states it was as high as 64 percent.
Table 2. Summary statistics
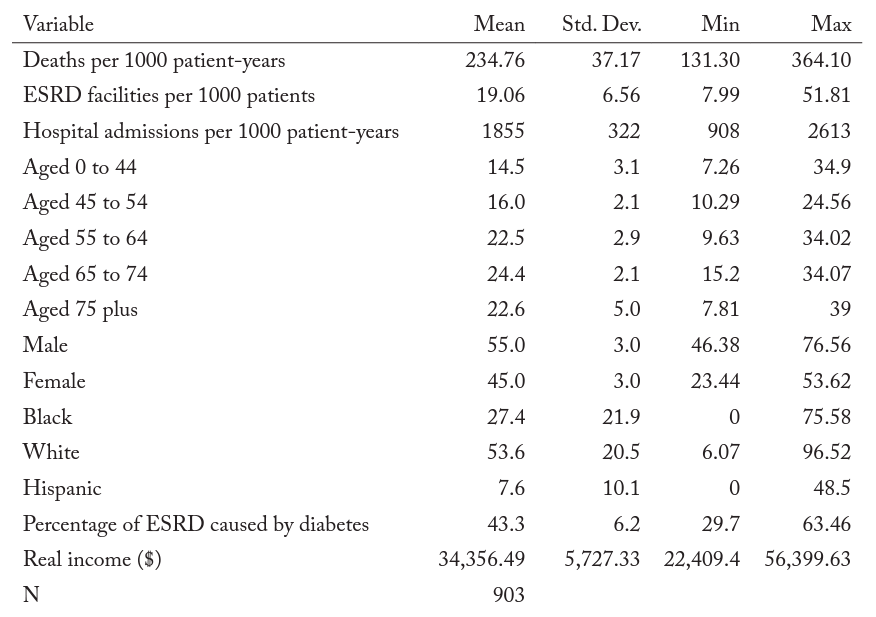
Note: Most data are gathered from the USRDS. Data on the Consumer Price Index are gathered from the BLS. Data on personal income are gathered from the BEA.
Figure 1 compares the trend of the death rate per thousand patients for New Jersey and the mean of the remaining forty-two states forming our control-group pool. New Jersey begins the period with a higher death rate, and the death rate declines a bit more quickly there than in the other states. In general, the death rate in New Jersey is higher than control states. Why did the death rate decline nationally? One likely explanation is that the use of fistula placements in dialysis patients nationwide more than doubled from 1999 to 2012 (“Dialysis patient” 2015). Professionals consider fistulas a safer alternative to catheters to administer dialysis treatment. Research consistently indicates that patients receiving dialysis via fistula are less likely to be infected than patients receiving dialysis via catheter (Momeni et al. 2017; Vasalotti et al. 2012). A simple comparison of trends makes separating the effect of the increased use of fistulas from New Jersey’s new rule difficult.3We are not aware of any evidence of New Jersey increasing its use of fistulas more quickly than other states. In addition, w`e are not aware of significant differences in fistula usage in New Jersey relative to comparison states throughout the sample period.
Figure 1. Death-rate trends: New Jersey versus the US comparison-state mean
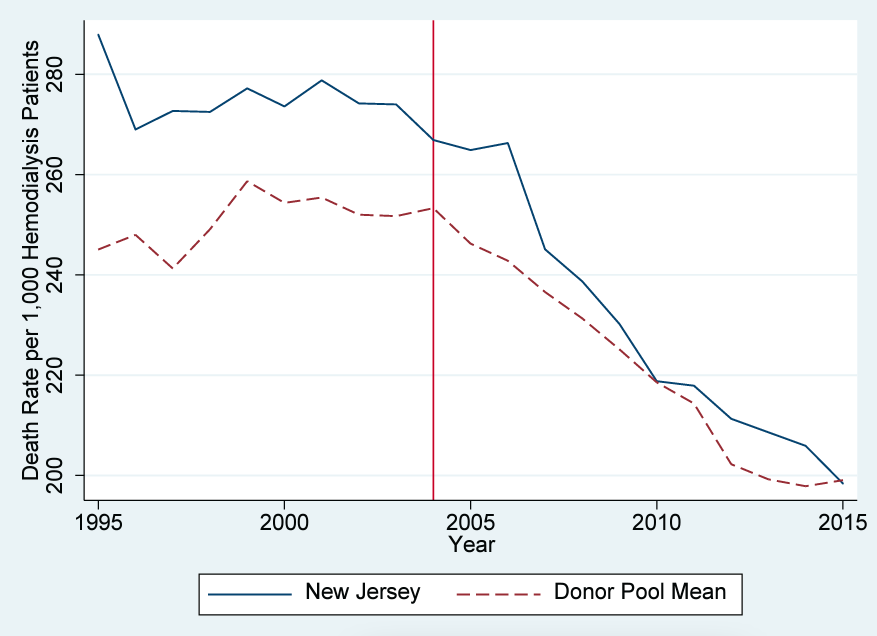
Note: Most data are gathered from the USRDS. Data on the Consumer Price Index are gathered from the BLS. Data on personal income are gathered from the BEA. The donor pool excludes Georgia, Maryland, Massachusetts, Oregon, South Carolina, Texas, and Utah.
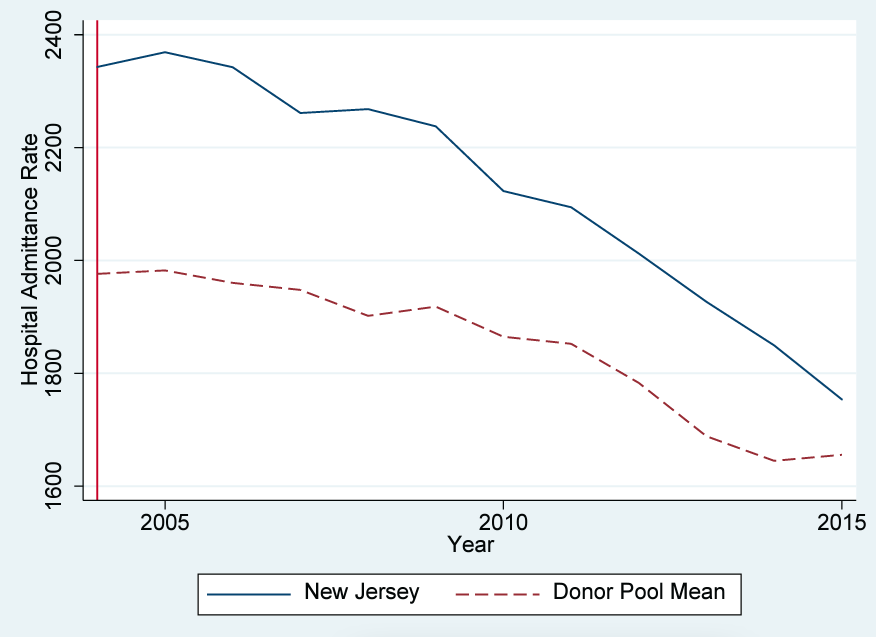
ESRD hemodialysis facilities per thousand patients is shown in figure 2. New Jersey experienced some increase before 2005, then growth leveled and the number remained generally stable. The average for the control group is much higher than New Jersey and is relatively constant over the sample period. Finally, figure 3 shows the hospital admittance rate for hemodialysis patients. Both New Jersey and control states experienced significant declines in the hospitalization rate. This national trend is also likely attributable to increased usage of fistulas (as opposed to catheters) over the timeframe. New Jersey began the period substantially higher than the rest of the United States and experienced a slightly greater decline in hospitalization than comparison states. Nevertheless, hospitalization rates were substantially higher than in comparison states in 2015, ten years after passage of the rule. In summary, because of changing national trends it is difficult to identify evidence of an effect of New Jersey’s mandate.
Figure 2. Number-of-facilities trends: New Jersey versus the US comparison-state mean
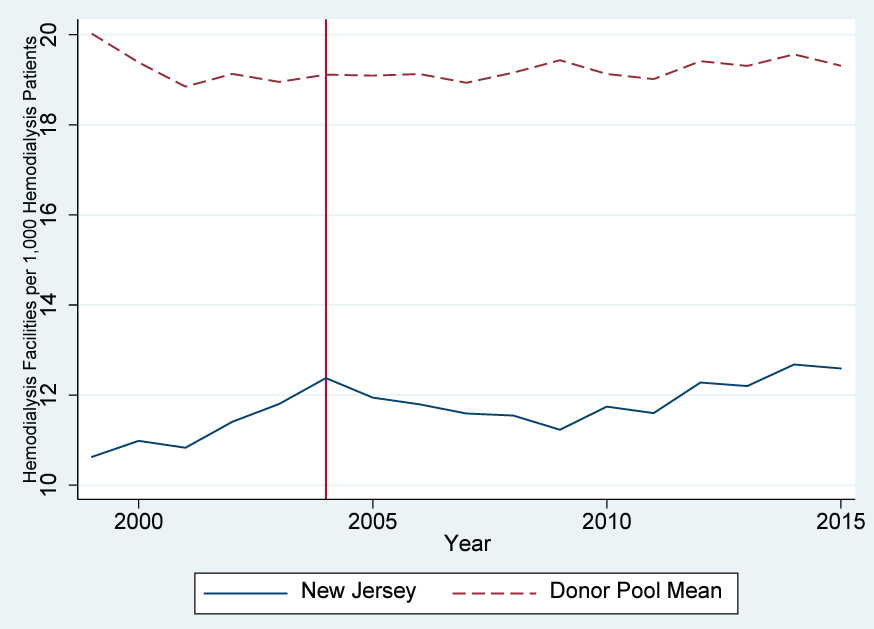
Note: Most data are gathered from the USRDS. Data on the Consumer Price Index are gathered from the BLS. Data on personal income are gathered from the BEA. The donor pool excludes Georgia, Maryland, Massachusetts, Oregon, South Carolina, Texas, and Utah.
Figure 3. Hospital admittance-rate trends: New Jersey versus the US comparison-state mean
Note: Most data are gathered from the USRDS. Data on the Consumer Price Index are gathered from the BLS. Data on personal income are gathered from the BEA. The donor pool excludes Georgia, Maryland, Massachusetts, Oregon, South Carolina, Texas, and Utah.
Methodology
To investigate the effect of New Jersey’s rule more rigorously and better control for national trends, we employ an SCM design. In many cases, studies of state-level policies take advantage of heterogeneity across states and differences in the adoption of policy over time and employ a difference-in-differences (DID) methodology. However, given that the New Jersey nurse-administrator policy is unique to the state, the DID approach would present some limitations. Most importantly, inferential techniques that require large sample sizes are not well suited to studies in which the treatment sample is small Attempting to use the United States as a control group would bias our estimation toward finding no result since the treatment would only be present in 10 out of 1,072 observations.
While we could develop an estimate using the neighboring states as a control, this methodology would also raise potential problems. One concern is that the characteristics of neighboring states do not match the treatment group, creating a poor counterfactual to estimate against New Jersey. Perfect reproduction using other states is extremely difficult, which is why DID studies use several states as the treatment and control, similar to a randomized experiment. In this case, New Jersey may have characteristics and regulations that neighboring states do not, making them an unsuitable control group.
We believe that SCM is the best-suited methodology for a policy change unique to a single state. SCM constructs a weighted sum of donor states selected from a pool of the other states. A valid synthetic control requires that the donor states, which form the synthetic control, match the variables of interest and explanatory variables during the pretreatment period. In our study, an effective synthetic control matches New Jersey’s health outcomes as closely as possible in the pretreatment period. A difference between the synthetic state and the real state in the pretreatment period implies that the model is a poor fit. If, after the treatment—in this case when New Jersey implemented the administrative-nurse mandate—New Jersey matches the synthetic New Jersey, then we cannot conclude that the policy change had a measurable effect. Any divergence from the pretreatment trend after treatment implies that it is reasonable to conclude that the treatment caused the difference.
For the SCM to accurately estimate the effect of a policy change, three assumptions must be met. Only the treated state can have that policy in place, and the policy change in the treated state must not have any spillover effects on other states. Second, there must be no effect of the policy change before it is implemented. Finally, the counterfactual for the treated state must be accurately estimated by a fixed combination of donor states. Including states that differ significantly from the treatment state would cause interpolation bias.
We believe that New Jersey meets these requirements. No other state has a similar policy requiring that a nurse serve in a purely administrative role. Additionally, implementing the rule in New Jersey should have no impact on the quality of dialysis clinics in other states. We also exclude the states with regulations requiring a minimum staff-to-patient ratio in order to avoid capturing the effects of these regulations on health outcomes. This rule change is unlikely to have had an impact before its implementation. Finally, the states included in our sample have similar characteristics to New Jersey, so our model should not suffer from interpolation bias.
Because our study uses three different health outcomes as measures of dialysis-clinic quality, we performed two separate synthetic-control estimations using the death rate and the number of facilities (both weighted by population) as dependent variables.4We do not have enough data before the implementation of New Jersey’s regulation to perform a synthetic-control estimation for hospital admission rate. Combined, these tests should provide evidence of the impact of New Jersey’s rule. Proponents argue that the mandate could improve patient outcomes. Dialysis staff spend less time focusing on administrative work, and, as a result, they may have more time to spend with each patient. Dialysis staff also may make fewer mistakes because they are not in a rush or can develop better relationships with patients and thus achieve better outcomes.
However, the rule may worsen quality. By requiring the hiring of additional staff to focus solely on administrative work, the rule increases costs for clinics. This encourages the consolidation of independent clinics into larger chains of clinics. Because larger chains improve health outcomes slower than independent clinics, this can worsen patient outcomes compared to the alternative (The Evolving, 2016).
Finally, it may have no effect on patient outcomes. The improvements caused by the additional staff may be canceled out by the tendency of greater consolidation of clinics. Our model uses measures of health outcomes to assess the quality of dialysis clinics in New Jersey compared to states without the nurse-administrator rule.
The observed outcomes can be written as the sum of the effect of the treatment,  , and the potential outcome absent the treatment,
  , in the following form:
![\[\begin{gathered} \mathrm{D}_{\mathrm{it}}=\mathrm{D}_{\mathrm{it}}^{\mathrm{N}}+\alpha_{\mathrm{ij}}^* \mathrm{~S}_{\mathrm{it}} \\ \mathrm{D}_{\mathrm{it}}^{\mathrm{N}}=\delta_{\mathrm{t}}+\lambda_{\mathrm{t}}^* \mu_{\mathrm{i}}+\theta_{\mathrm{t}}^* \mathrm{Z}_{\mathrm{i}}+\varepsilon_{\mathrm{it}} \end{gathered}\]](https://www.thecgo.org/wp-content/ql-cache/quicklatex.com-f7088f354e3640910a5970a3066fe882_l3.svg "Rendered by QuickLaTeX.com")
 is a dummy variable, coded as 1 for the treated units after time
  and 0 otherwise.
  is the time fixed effect,
  is a vector of time-invariant unobserved predictor variables with time-varying coefficients
  ,
,  is a vector of time-invariant measured predictors with a time-varying coefficient vector
  , and
, and  captures the error.
Before the treatment in , represents the observed outcome for the treatment and control states. After , the counterfactual of no treatment for the treated region cannot be observed. Therefore, we estimate the treatment effect in the post-treatment period using the SCM-estimated values for the by creating our synthetic-control unit, the weighted linear combination of the donor states. The estimated effect for each treated unit at each period after is  .
.
Results
Death Rate
For our synthetic New Jersey, we excluded the seven other states that had implemented nurse-staffing ratios to avoid the confounding effects of that regulation and to maintain a similar regulatory environment across the states included in our synthetic-control donor pool. In this specification, our variable of interest is the death rate per thousand patients (“death rate”). For our estimation, we included several covariates to account for state-specific heterogeneity. They include the percentage of dialysis patients aged forty-five to fifty-four, the percentage of dialysis patients aged fifty-five to sixty-four, the percentage of dialysis patients aged sixty-five to seventy-four, the percentage of dialysis patients aged seventy-five or more, the percentage of dialysis patients that are female, the percentage of dialysis patients that are black, the percentage of dialysis patients that have diabetes, and average real income in the state.
After performing the estimation, the synthetic version of New Jersey comprised eight states drawn from a pool of forty-two states. They were Arkansas, Connecticut, Florida, Illinois, Iowa, Nevada, North Dakota, and West Virginia. The population average of the eight states that constituted the synthetic New Jersey can be found in table 3. The death-rate trends in New Jersey are best replicated by the eight states in our synthetic New Jersey; all other states received a weighting of 0 from the estimation.
Table 3. State weights in synthetic New Jersey for death rate
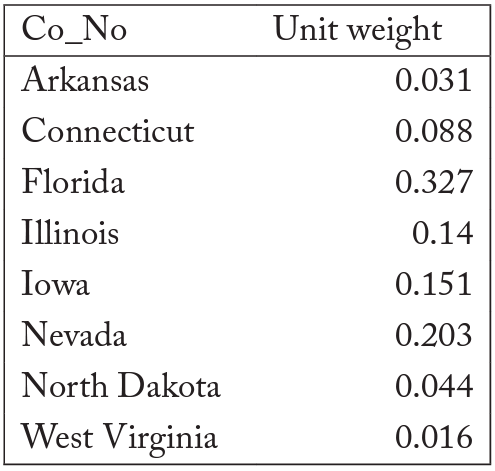
Note: All other states received a 0 weight.
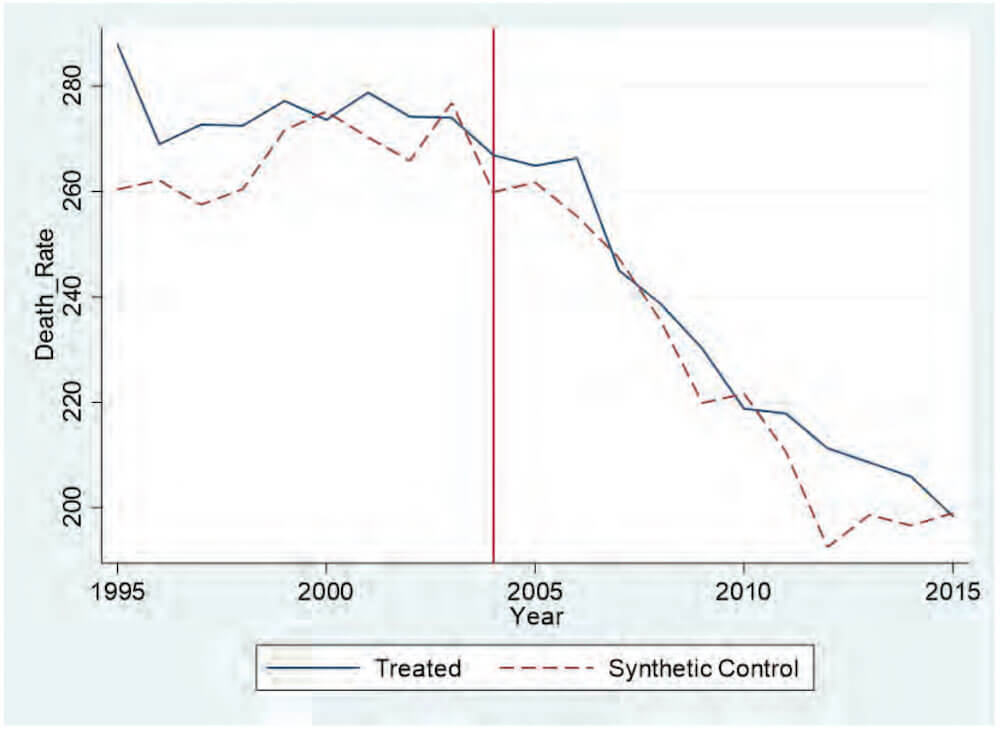
Table 4 compares the observed values for the pretreatment characteristics in New Jersey with the values for our synthetic New Jersey. The trends for New Jersey and our synthetic New Jersey are similar, suggesting that the synthetic New Jersey is a suitable control group. For the three pretreatment years of death rates, our synthetic control accurately reproduces the New Jersey death rate. A comparison of the death rates for New Jersey and synthetic New Jersey can be found in figure 4.
Table 4. Synthetic-control death-rate predictor means
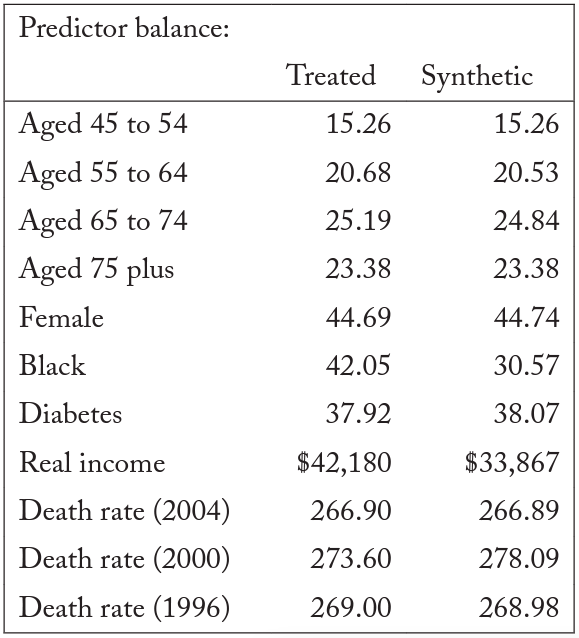
Note: Most data are gathered from the USRDS. Data on the Consumer Price Index are gathered from the BLS. Data on personal income are gathered from the BEA.
Figure 4. Trends in death rate: New Jersey versus synthetic New Jersey
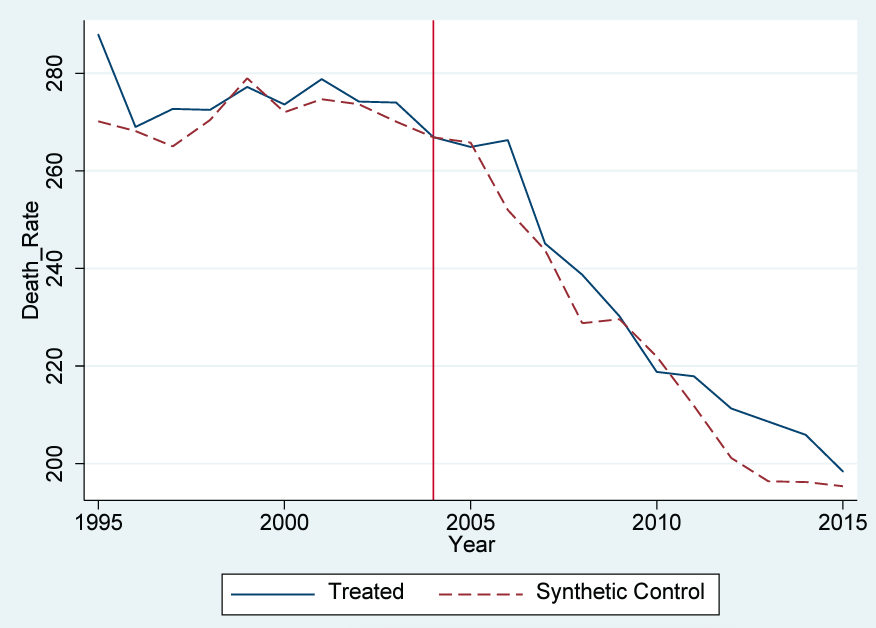
Note: Most data are gathered from the USRDS. Data on the Consumer Price Index are gathered from the BLS. Data on personal income are gathered from the BEA. The donor pool for the synthetic control method excludes Georgia, Maryland, Massachusetts, Oregon, South Carolina, Texas, and Utah.
Our estimate of the impact of the nurse-administrator rule can be illustrated by the difference between the trend lines in figure 4. We see no divergence after the implementation of the rule between the predicted values for synthetic New Jersey and the actual values for New Jersey. The slight downward trends that both New Jersey and the synthetic New Jersey experienced from 2000 to 2005 accelerated in unison. This lack of any discernable change does not support the claim that the rule had a measurable impact on the quality of dialysis treatments in New Jersey. Figure 5 plots the difference in the death rate between synthetic New Jersey and New Jersey. This shows that New Jersey did not experience any decrease in mortality as a result of the treatment: the difference between New Jersey and its synthetic counterpart remains around zero for each subsequent year. Our results suggest that for the entire 2005–15 period, there is no evidence of a significant reduction in the death rate as a result of the mandate.
Figure 5. Death-rate gap between New Jersey and synthetic New Jersey
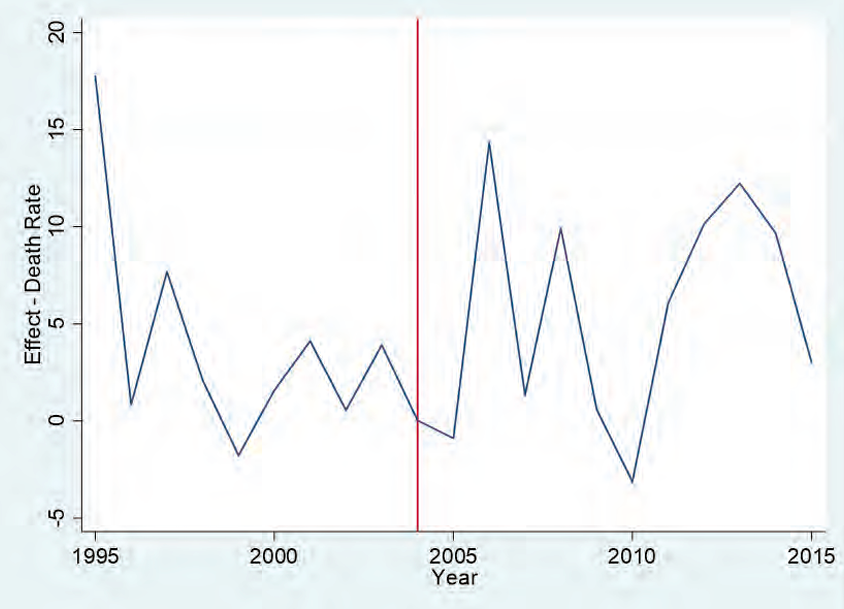
Note: Most data are gathered from the USRDS. Data on the Consumer Price Index are gathered from the BLS. Data on personal income are gathered from the BEA. The donor pool for the synthetic control method excludes Georgia, Maryland, Massachusetts, Oregon, South Carolina, Texas, and Utah.
To ensure that our results were not driven by chance, we performed a series of robustness checks. To test our model, we used the other states from our donor pool to compare against our synthetic New Jersey. We applied the SCM to those states in our sample that did not implement New Jersey’s nurse-administrator regulation or require minimum staffing ratios during the period of our study. We applied the SCM to each state, simulating as if each one implemented New Jersey’s rule in 2005. If the placebo states all followed a trend similar to New Jersey’s without many outliers, that would suggest that our model does not provide evidence against the effectiveness of the rule. We estimate and plot the estimated effect for each state in figure 6. New Jersey is represented by the thick black line and the other forty-two states in our sample by the gray lines. As depicted in the graph, we find that our synthetic–New Jersey estimation lies in the middle of the placebo graphs.
Figure 6. Placebo test: New Jersey vs. other states
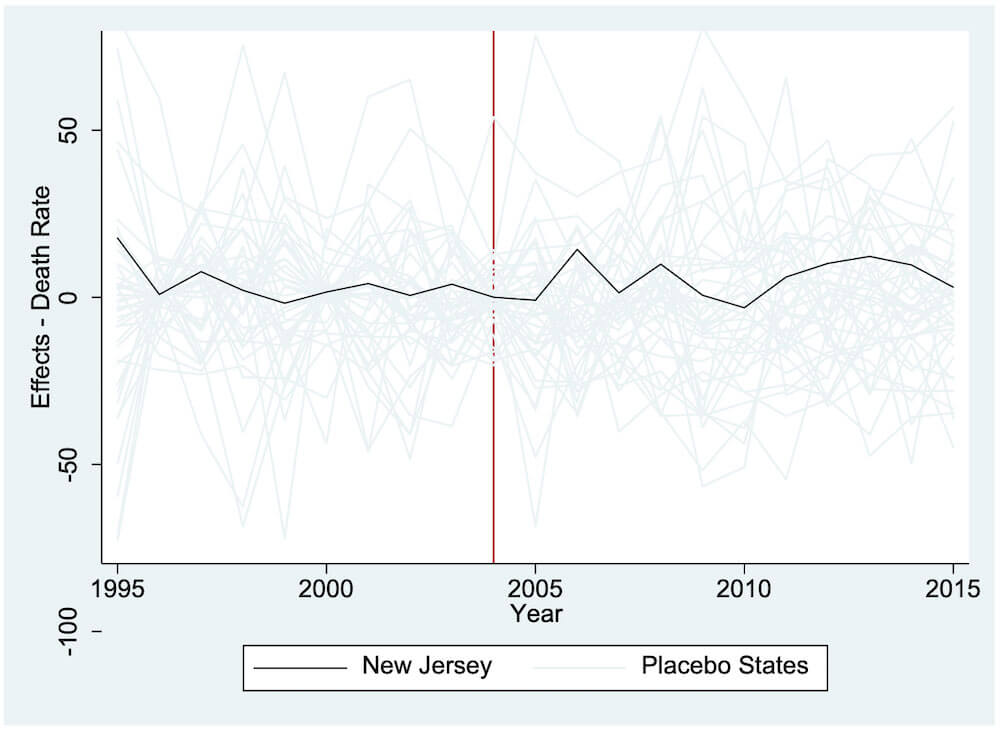
Note: Most data are gathered from the USRDS. Data on the Consumer Price Index are gathered from the BLS. Data on personal income are gathered from the BEA. The donor pool for the synthetic control method excludes Georgia, Maryland, Massachusetts, Oregon, South Carolina, Texas, and Utah.
We also report an estimate of the p-values for the synthetic New Jersey, plotted for each year after the treatment period in figure 7. These p-values are computed using two-tailed tests with the null hypothesis that the placebo states experience an effect at least as large (in absolute-value terms) as the estimated effect in New Jersey. Only one year (2007) has any statistical significance. This result further confirms that our model provides little supporting evidence that the rule implemented by New Jersey in 2005 had an impact on quality as measured by the death rate.
Figure 7. Significance test for synthetic New Jersey

Note: Most data are gathered from the USRDS. Data on the Consumer Price Index are gathered from the BLS. Data on personal income are gathered from the BEA. The donor pool for the synthetic control method excludes Georgia, Maryland, Massachusetts, Oregon, South Carolina, Texas, and Utah.
As an additional estimation, we re-ran the SCM utilizing the seven states (other than New Jersey) with nurse-staff-ratio mandates in place as the donor pool (Georgia, Maryland, Massachusetts, Oregon, South Carolina, Texas, and Utah). It can be argued that the regulatory environment in these seven states most closely matches New Jersey, so using them as a baseline more closely measures the marginal effect of New Jersey’s unique rule. Figure 8 illustrates the result of this estimation. The SCM assigned weight to only one state in this case: Massachusetts. Thus, the plot depicts a comparison of New Jersey with Massachusetts. Our results suggest again there is little evidence that New Jersey’s staffing rules have reduced deaths. In fact, our estimation suggests that the death rate was slightly higher in New Jersey than in its synthetic counterpart.
Figure 8. Trends in death rate: New Jersey versus synthetic New Jersey
Note: Most data are gathered from the USRDS. Data on the Consumer Price Index are gathered from the BLS. Data on personal income are gathered from the BEA. The donor pool for the synthetic control method excludes Georgia, Maryland, Massachusetts, Oregon, South Carolina, Texas, and Utah.
Number of Facilities
For our next estimation, we created a synthetic New Jersey to estimate the effect of the administrative-nurse rule on the number of facilities. The number of facilities is directly related to patients’ ability to access care. However, our analysis will not be able to capture any change to the ownership structure of the clinics. Nevertheless, access to health care is an important component of ensuring patient health and delivering high-quality care. In this specification, we included the same covariates as the previous estimation. The synthetic New Jersey was a combination of Hawaii, Illinois, and New York. Table 5 notes the weights that each state received. All other states in the donor pool received a weight of zero.
Table 5. State weights in synthetic New Jersey for facilities
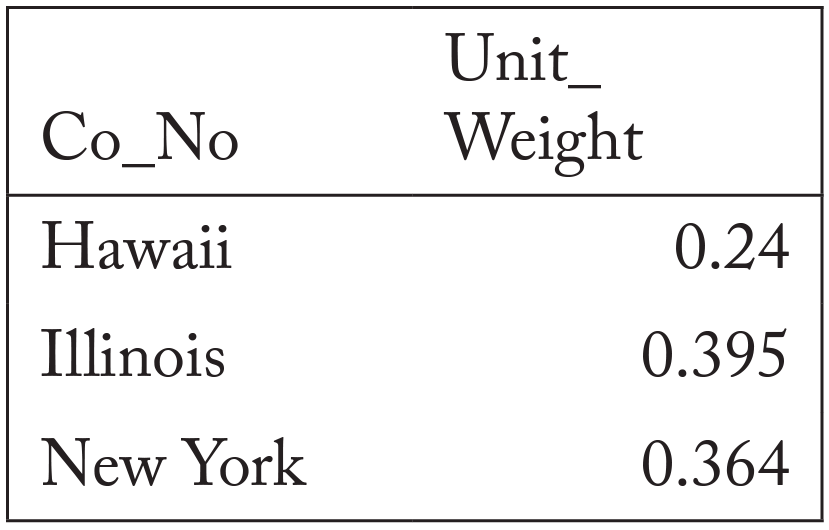
Note: All other states received a 0 weight.
Table 6 compares the estimated characteristics of synthetic New Jersey to the observed characteristics in New Jersey before the treatment took effect. The values are relatively close, but a less than perfect fit places limitations on the model. Figure 9 compares the trend of New Jersey with that of synthetic New Jersey. The lack of fit before treatment (2005) between synthetic and actual New Jerseys places significant limitations on our analysis. However, the graph suggests that after treatment, New Jersey experienced a drop in the number of facilities per patient. This provides suggestive evidence of a drop in access to care in New Jersey following passage of the administrative-nurse rule.
Table 6. Synthetic-control facilities predictor means
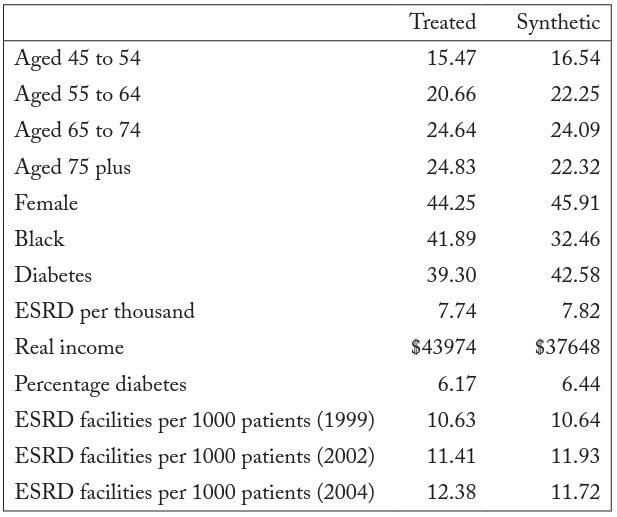
Note: Most data are gathered from the USRDS. Data on the Consumer Price Index are gathered from the BLS. Data on personal income are gathered from the BEA.
Figure 9. Trends in facilities: New Jersey versus synthetic New Jersey
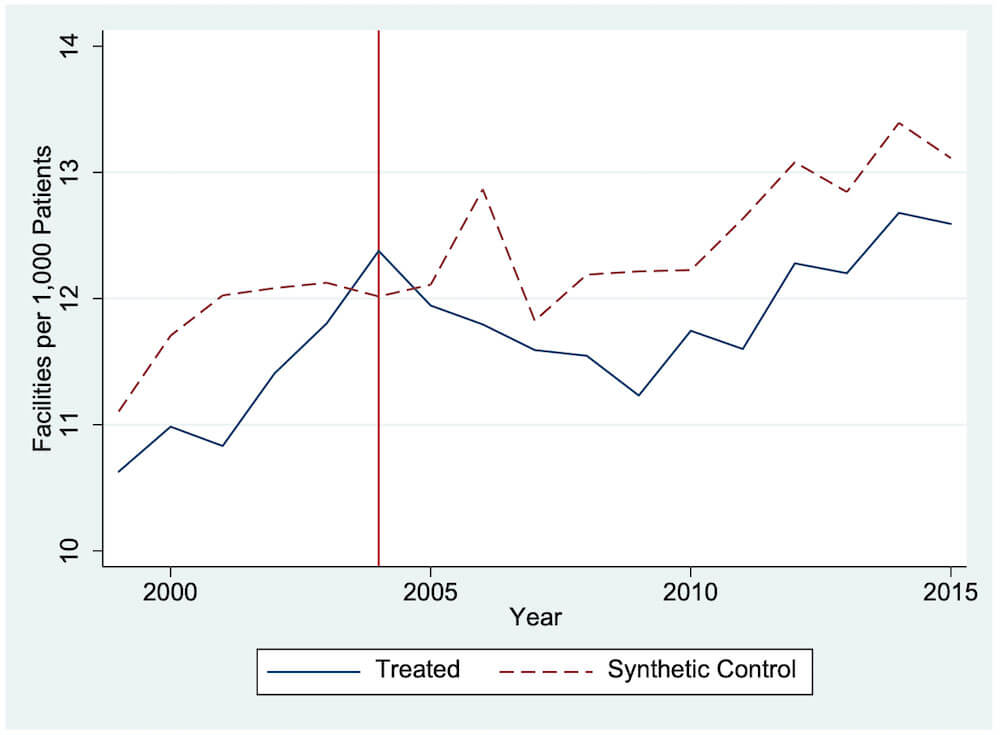
Note: Most data are gathered from the USRDS. Data on the Consumer Price Index are gathered from the BLS. Data on personal income are gathered from the BEA. The donor pool for the synthetic control method excludes Georgia, Maryland, Massachusetts, Oregon, South Carolina, Texas, and Utah.
Figure 10 shows the difference between the predicted and observed values. In both the pre- and post-treatment periods, we see large gaps between synthetic and actual New Jerseys. This limits the ability of the model to be used for causal inference. Nevertheless, we find evidence of declines in the number of facilities per patient after treatment. We cannot establish causality, but there is definitely a correlation following passage of the administrative-nurse rule.5We also performed an SCM estimation using the seven states with nurse-staffing ratios as the donor pool. Our results were very similar to what we present here: we had difficulty matching the pretreatment trends.
Figure 10. Number-of-facilities gap between New Jersey and synthetic New Jersey
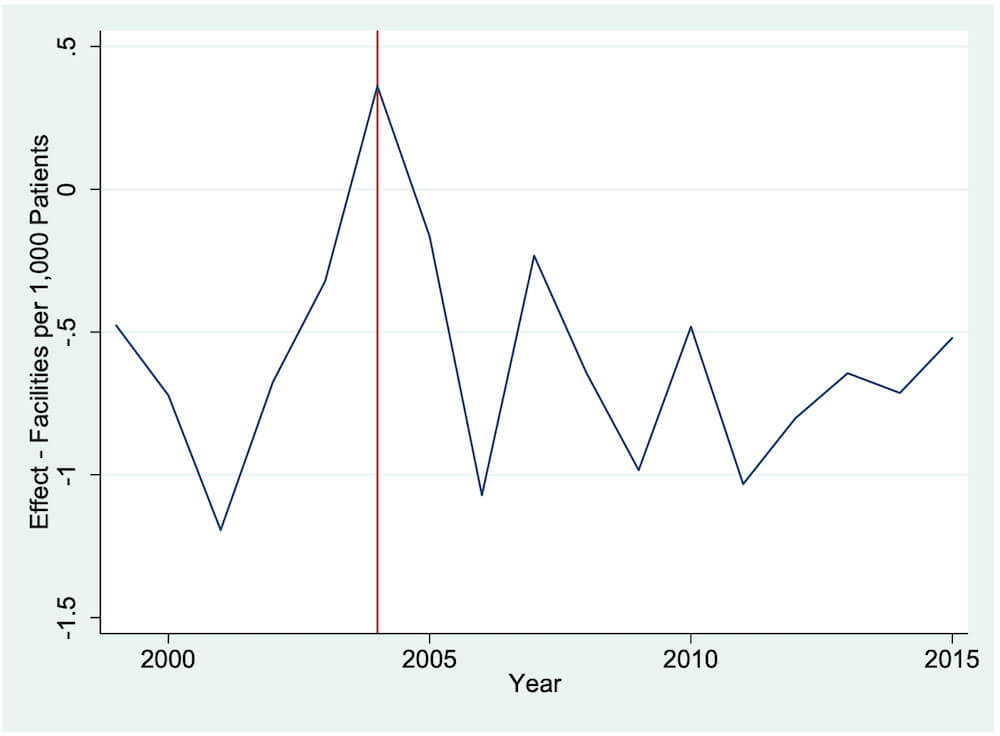
Note: Most data are gathered from the USRDS. Data on the Consumer Price Index are gathered from the BLS. Data on personal income are gathered from the BEA. The donor pool for the synthetic control method excludes Georgia, Maryland, Massachusetts, Oregon, South Carolina, Texas, and Utah.
Conclusion
This paper contributes to the literature on both the provision and quality of hemodialysis. Past hemodialysis research primarily focused on the setting in which treatments are delivered or the staff-to-patient ratios within the clinics. We tested the effect on quality measures of New Jersey’s rule prohibiting an administrator from engaging in clinical activities and thereby requiring that hemodialysis clinics hire a nurse to function solely in an administrative capacity. Since the implementation of the rule, the death rate of hemodialysis patients has fallen, but so has the trend in the United States overall. Therefore, we employed the SCM to create a control state to compare with New Jersey.
Our analysis provides little evidence that the death rate for hemodialysis patients was affected by the rule. We found evidence that the number of facilities per patient fell after passage of the rule, though our predictive power was limited. Our findings suggest that while New Jersey’s unique rule presents a considerable cost for clinics, it did not measurably improve the quality of hemodialysis clinics.
When designing health care regulations, policy makers must be cognizant of unintended consequences limiting the effectiveness of the regulations. In this case, the hemodialysis-clinic rule adds a cost for providing services yet provides no corresponding improvement in quality for patients. The lack of impact may demonstrate that the policy is ineffective at improving the quality of treatment, or it may be that the quality improvements are swamped by the negative effects of the consolidation of clinics. Improving the quality of hemodialysis requires a multifaceted approach, which McClellan (2010) details, and no simple regulatory change can have a substantial effect. Hemodialysis is different from other forms of health care, so any policy must be carefully designed to reflect the idiosyncrasies of the treatment.
References
Brooks, John, Christopher Irwin, Lawrence Hunsicker, Michael Flanigan, Elizabeth Chrischilles, and Jane Pendergast. 2006. “Effect of Dialysis Center Profit-Status on Patient Survival: A Comparison of Risk Adjustment and Instrumental Variable Approaches.” HSR: Health Services Research 41 (6): 2267–89.
Bureau of Labor Statistics (BLS). 2018. “Occupational Employment and Wages, May 2018.” https://www.bls.gov/oes/current/oes291141.htm#st.
“Dialysis Patient Mortality Rates Fall More than 20% in Five Years.” 2015. Healio: Nephrology News &
Issues, November 7. https://www.healio.com/news/nephrology/20180227/dialysis-patient-mortality-rates-fall-more-than-20.
“Dialysis Staff Ratio Bill Advances in California.” 2017. Healio: Nephrology News & Issues, March 30. https://www.healio.com/news/nephrology/20180227/dialysis-staff-ratio-bill-advances-in-california.
Dor, Avi. 2001. “Administered Prices and Suboptimal Prevention: Evidence from the Medicare Dialysis Program.” NBER Working Paper no. 8123, National Bureau of Economic Research.
Dor, Avi, Mark Pauly, Margaret Eichleay, and Philip Held. 2007. “End-Stage Renal Disease and Economic Incentives: The International Study of Health Care Organization and Financing.” NBER Working Paper no. 13125, National Bureau of Economic Research.
Erickson, K. F., B. Zhao, J. Niu, WC Winkelmayer, J Bhattacharya, GM Chertow, V Ho. 2019. “Association of Hospitalization and Mortality Among Patients Initiating Dialysis with Hemodialysis Facility Ownership and Acquisitions.” JAMA Network Open 2: 5.
Galiani, Sebastian, and Brian Quistorff. 2017. “The synth_runner Package: Utilities to Automate Synthetic Control Estimation Using Synth.” Stata Journal 17 (4): 834–49.
Ku, Elaine, Kirsten Johansen, Anthony Portale, Barbara Grimes, and Chi-yuan Hsu. 2015. “State Level Variations in Nephrology Workforce and Timing and Incidence of Dialysis in the United States among Children and Adults: A retrospective Cohort Study.” BMC Nephrology 16: 2.
McClellan, W. 2010. “Processes of care and reduced mortality among hemodialysis patients in the United States.” Clinical Journal of the American Society of Nephrology 5: 1905-1907.
Momeni, Ali, Saeed Mardani, Maryam Kabiri, and Masoud Amiri. 2017. “Comparison of Complications of Arteriovenous Fistula with Permanent Catheter in Hemodialysis Patients: A Six-Month Follow-Up.” Advanced Biomedical Research 6: 106.
National Institute of Diabetes and Digestive and Kidney Diseases. 2016. Kidney Disease Statistics for the United States. https://www.niddk.nih.gov/health-information/health-statistics/kidney-disease.
The Evolving Role of Retail Clinics. 2016. Santa Monica, CA: RAND Corporation. https://www.rand.org/pubs/research_briefs/RB9491-2.html.
Rastogi, Anjay, and Glenn Chertow. 2018. “Mandating Staffing Ratios in Hemodialysis Facilities California SB 349 and Unintended Consequences.” Clinical Journal of the American Society of Nephrology 13: 1110–12.
Rettig, R. A., and N. G. Levinsky (eds.). 1991. Kidney Failure and the Federal Government. Washington, DC: Institute of Medicine.
Vasalotti, J. A., W. C. Jennings, G. A. Beathard, S. Caponi, C. H. Fox, and L. M. Spergerl. 2012. “Fistula First Breakthrough Initiative: Targeting Catheter Last in Fistula First.” Seminars in Dialysis 25 (3): 303–10.
Wennberg, J.E., Fisher, E.S, & Skinner, J.S. (2002). Geography and the debate over Medicare reform. Health Affairs, Supp Web Exclusives, W96-114.