

1. Introduction
In recent years, investment in and construction of high-speed fiber broadband networks, some capable of speeds exceeding one gigabit per second (Gbps), have grown rapidly in the United States. Further, significant public investments in broadband in recent years—by municipalities, states, and the federal Universal Service Fund—have directly subsidized fiber buildout because of its ability to deliver high-quality service.
This paper analyzes broadband service quality in the forty-eight contiguous states and Washington, DC, when aDSL and cable incumbents share a market with a fiber competitor. Theory is ambiguous as to how fiber deployment relates to the service quality offered by aDSL and cable incumbents, so we must model and observe the relationship between fiber provider entry and incumbent aDSL and cable speeds empirically.
The paper proceeds as follows. The second section reviews the economic literature on competition and product quality and summarizes related empirical research specific to broadband service quality. Previous research has estimated competition by aggregating service over geographic areas broader than US Census blocks, such as US Census–block groups,1Molnar and Savage, “Market Structure.” US Census tracts,2Wallsten and Mallahan, “Residential Broadband Competition.” and ZIP codes.3Xiao and Orazem, “Fourth Entrant”; Prieger, “Supply Side.” The third section describes our source of fixed wireline broadband data: the Federal Communications Commission’s (FCC’s) Form 477 data.4Federal Communications Commission, “Fixed Broadband Deployment Data.” We also present results regarding changes in the number of wireline broadband offerings, the quality of wireline service, and the prevalence of interplatform and intraplatform competition among aDSL, cable, and fiber operators. By “intraplatform competition,” we mean competition among providers in the same wireline category (for example, two aDSL providers serving households in the same census block). Meanwhile, “interplatform competition” refers to competition among providers in different categories (for example, cable and fiber). The fourth section describes the panel econometric methods used. The fifth section presents results. The sixth section discusses our findings, and the conclusion follows.
2. Literature Review
The question of how aDSL and cable speeds change in response to entry by a fiber provider is a specific inquiry into the broader phenomenon of how firms compete on the margin of service or product quality. The effect of increased competition on the quality decisions of incumbents is ambiguous a priori.
If consumers have diverse preferences for broadband service quality and price, an incumbent provider may maximize profit by differentiating its service from that of an entrant, instead of investing in improved quality.5A theoretical basis for this competitive conduct is offered by Shaked and Sutton, “Price Competition.” New entrants in local telecom markets differentiate their services based on market-demand conditions and the business strategies of competitors, according to Greenstein and Mazzeo, “Role of Differentiation.” Also, a duopolist can charge a higher price than a monopolist in a market with high variation in consumer preferences, a result shown by Chen and Riordan, “Price-Increasing Competition.” Increased prices under duopoly in local broadband markets are given empirical support by Chen and Savage, “The Effects of Competition on the Price for Cable Modem Internet Access.” A profit-maximizing broadband provider will improve quality only when the incremental cost of improving quality is less than the marginal gains of selling the higher-quality service at a higher price. That inequality relationship depends on the price and quality elasticities of demand for consumers and the incremental cost faced by the firm for improving quality.6Dorfman and Steiner, “Optimal Advertising.”
Broadband providers face substantial sunk costs when deploying new network infrastructure to enter a market or when investing in improvements to existing infrastructure. When sunk costs are large, the number of consumers required to generate revenues sufficient to recover the initial investment is high.7Bresnahan and Reiss, “Entry.” A monopolist can raise prices in order to recover its fixed costs, but as the number of firms in direct competition increases, the ability of any firm to raise prices above average cost diminishes. In turn, profits in a given market are exhausted in the presence of only a few firms in an industry with high fixed costs.8Firms must take into account the infrastructure costs that must be sunk when entering a market, but incumbents ignore sunk costs when deciding whether to continue offering broadband service or exit the market. When allowing for high sunk costs for new entrants offering broadband service, only the second and third market entrants are shown to have significant impacts on the competitive conduct of incumbent broadband providers, according to Xiao and Orazem, “Fourth Entrant.”
In markets with more competitors and diverse consumer preferences regarding price and quality, we ex- pect a substantial incremental cost of network construction to tip incumbent providers toward a business strategy of product differentiation. In our case, high-speed fiber providers may capture the high end of the broadband market (that is, consumers with low sensitivity to price changes or high sensitivity to quality changes) while leaving a sufficient share of the market that prefers the quality-and-price vector offered by incumbent aDSL or cable providers. In this scenario, aDSL or cable providers may face an incremental cost of upgrading their services that is greater than the marginal benefit of selling a higher-quality good at a higher price, meaning incumbents will not improve quality of service despite having more competitors in the marketplace.
An important implication of heterogeneity among broadband providers and high variance in consumer preferences is that incumbents’ responses to new entrants vary with the incremental cost of broadband deployment each firm faces and the demand functions of consumers. Thus, broadband providers that use different transmission technologies may respond differently to the entrance of fiber providers.
Recent papers have examined competition among broadband providers and its effects on service quality. Broadly, the total number of wireline broadband providers is positively correlated with the highest available download speeds offered by wireline providers at the census-tract level,9Wallsten and Mallahan, “Residential Broadband Competition.” and wireline speeds are higher in markets with two or more broadband providers than in markets with only a single provider.10Molnar and Savage, “Market Structure.” In addition, higher numbers of wireless providers and the entry of new wireless providers have been found to be positively related to wireline speeds.11Wilson, “Local Competition”; Flamm and Varas, “Quality Competition.” Further, a greater level of competition in a market in the past predicts faster download speeds in the present, suggesting that sustained competition incentivizes operators to invest in network upgrades.12Wilson, Xiao, and Orazem, “Entry Threat.”
Our paper contributes to this literature by analyzing competition within and across wireline-provider categories, specifically aDSL, cable, and fiber. To be consistent with the previous literature, we distinguish between intraplatform competition and interplatform competition.13For example, Distaso, Lupi, and Manenti, “Platform Competition,” examine the effect of inter- and intraplatform competition on broadband adoption in fourteen European countries and find interplatform competition has a stronger effect. Aron and Burnstein, “Broadband Adoption,” find evidence that interplatform (“intermodal”) competition has a statistically significant impact on broadband adoption in forty-six states. A study relevant to this paper examines the quality of service offered by aDSL incumbents in the presence of competing aDSL, cable, and fiber operators in a sample of California’s local broadband markets between 2011 and 2013.14 Prieger, Savage, and Molnar, “Quality Competition.” That study finds that the presence of a gigabit fiber competitor predicts increased aDSL speeds from providers offering speeds between ten and twenty-five megabits per second (Mbps).15No aDSL incumbents in the sample offered speeds in excess of 25 Mbps. Notably, the sample pre-dates the FCC’s 2015 redefinition of broadband service. Prieger, Savage, and Molnar, “Quality Competition,” 21. It also finds that aDSL incumbents offer faster speeds both when a new cable provider enters the market and when cable competitors offer faster DOCSIS 3.0 speeds. The study finds that intraplatform competition from additional aDSL providers does not correlate with higher incumbent speeds. In this paper, we similarly model the service quality of aDSL incumbents facing competition from (additional) aDSL, cable, and fiber wireline operators, and we also extend our model to the service quality of cable incumbents facing inter-and intraplatform wireline competition.
3. Data
To analyze the relationship between fiber provider entry and the quality of aDSL and cable broadband service, we employ a panel dataset with observations of broadband service at the census-block level in nine periods separated by six months across four years, from December 2014 through December 2018. Because the providers servicing a given census block change from June to December in one year to the following June, the panel is unbalanced.
To work around computational limitations, we select observations from randomly selected US Census tracts constituting 25 percent of all US Census tracts with broadband service in December 2018. In all, we observe 22,798,213 broadband service plans in 17,872 census tracts and 1,928,719 census blocks over nine periods. Our sample includes tracts from all forty-eight contiguous states and Washington, DC, but our sample does not randomly select exactly 25 percent of tracts from each jurisdiction.
The broadband-service data are sourced from the FCC’s Form 477 Fixed Broadband Deployment data, excluding satellite service.16Federal Communications Commission, “Fixed Broadband Deployment Data.” Each June and December, facilities-based broadband providers are required to specify the census blocks to which they do or can offer service. They also submit information about the service plans they offer in each census block, such as the transmission technology (for example, aDSL, cable, or fiber) and maximum advertised download and upload speeds, measured in Mbps. In addition, providers specify whether their service is intended for mass consumer/residential use, for business use, or for both. We analyze only broadband service for consumer/residential use. All variables in the publicly available Form 477 datasets are named and described in table A-1 in the appendix.
We exclude broadband service that does not satisfy the FCC’s benchmark for “advanced telecommunications capability,” which since 2015 has been speeds of at 25 Mbps download and 3 Mbps upload (25 Mbps/3 Mbps).17“We can no longer conclude that broadband at speeds of 4 megabits per second (Mbps) download and 1 Mbps upload (4 Mbps/1 Mbps). . . supports the ‘advanced’ functions Congress identified. [W]e find that, having ‘advanced telecommunications capability’ requires access to actual download speeds of at least 25 Mbps and actual upload speeds of at least 3 Mbps (25 Mbps/3 Mbps).” See Federal Communications Commission, “Deployment of Advanced Telecommunications Capability,” 3.
Table 1. Broadband Service in Sample by Transmission Technology, by Year-Month
Including only service that satisfies FCC’s 25 Mbps/3 Mbps definition of broadband in sampled US Census tracts
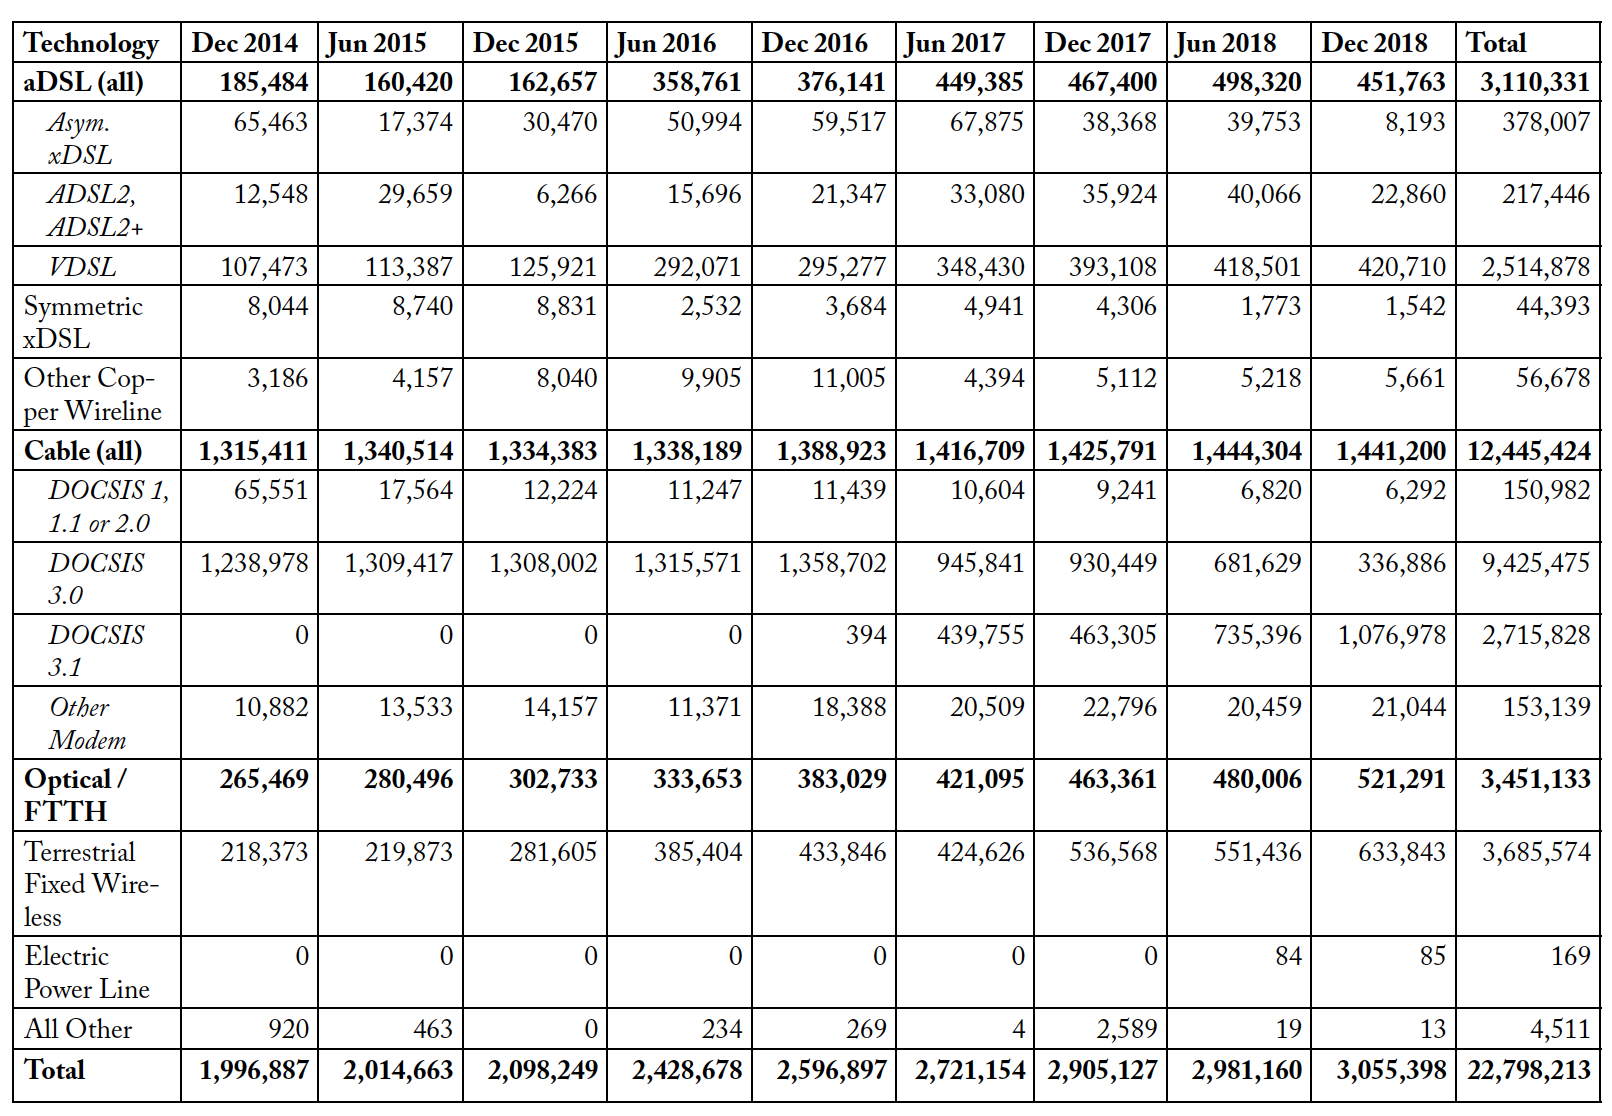
Table 1 shows the frequency of broadband service plans offered for each transmission technology in our sample for each six-month Form 477 release between December 2014 and December 2018, as well as to- tal frequencies in the entire sample. The most common type of consumer broadband service plan is cable. Its four transmission technologies (DOCSIS 3.1, DOCSIS 3.0, earlier DOCSIS, and other modems) make up 54.6 percent of the broadband service plans in our sample. The second most common transmis- sion technology in our sample is terrestrial fixed wireless at 16.2 percent, and fiber service, labeled “Opti- cal/FTTH” in table 2, is the third most common at 15.1 percent. Adding in the three aDSL transmission technologies, representing 13.6 percent of our observations, shows that over 99.5 percent of broadband service is transmitted by one of these four technologies. Our analysis focuses on competitive conduct among providers of wired connections, so we do not analyze the effects of new entrants on terrestrial fixed-wireless providers.
Table 2. Means, Standard Deviations, and Frequencies of Maximum Advertised Download Speeds (Mbps) by Transmission Technology, by Year-Month and Total
In each cell, mean is listed first, followed by standard deviation and then frequency.
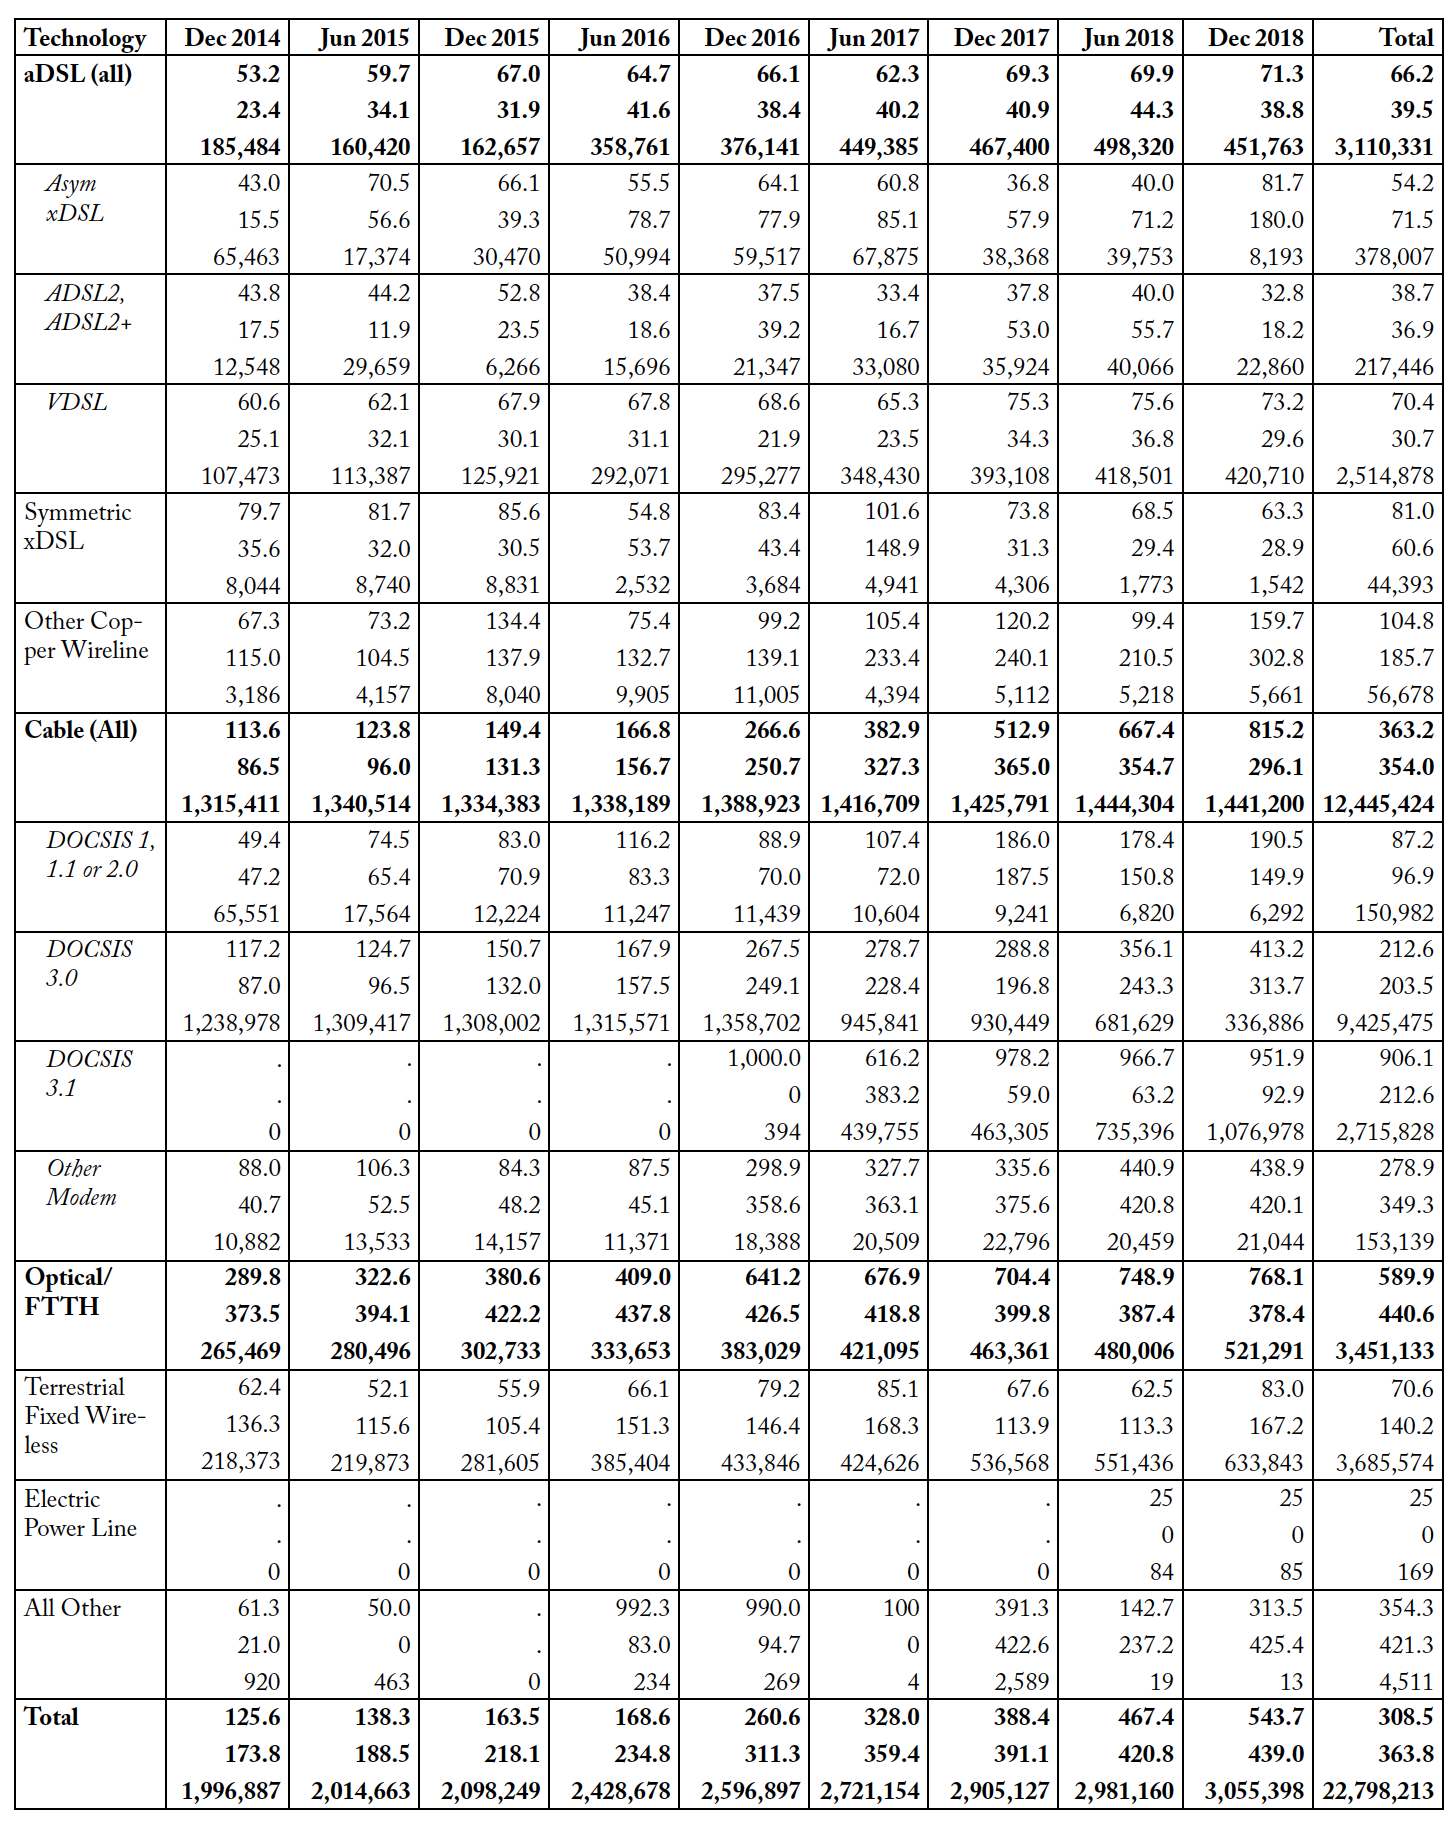
Table 2 shows the average maximum advertised download speeds for each transmission technology, both by year-month and for the entire sample. The table also shows the standard deviations and frequency, or number of observations, for each technology and year-month. Taken together, tables 1 and 2 show variation across and within the major fixed-wireline technologies over time.
The aggregate number of cable broadband service plans increased less than 10 percent between Decem- ber 2014 and December 2018, a modest increase relative to the increases observed in broadband service plans offered by providers using other technologies. However, there is significant variation among the cable subcategories. DOCSIS 1, 1.1, and 2.0 modem service plans have declined about 90 percent, but that subcategory never made up more than 5 percent of all cable service in our sample in any period. Between December 2016 and June 2017, DOCSIS 3.0 service plans—the most common cable-modem service—declined by almost 413,000 in our sample. That decline was exceeded by, but nearly equal to, the six-month increase in DOCSIS 3.1 service plans, which increased by just over 439,000 in that timespan. In 2017 and 2018, DOCSIS 3.1 maximum advertised download speeds were more than two times higher than DOCSIS 3.0 speeds, on average. Average download speeds for all cable service plans increased more than sixfold between December 2014 and December 2018. This suggests that cable providers have made significant improvements in service quality in recent years.
Further, among fiber, cable, and aDSL service offerings, fiber had the highest average download speeds in December 2014, equaling 289.8 Mbps. By December 2017, cable service using the DOCSIS 3.1 standard, which was first offered in December 2016, was averaging maximum download speeds more than 200 Mbps faster than the average service plan. Average cable speeds surpassed average fiber speeds in Decem- ber 2018.
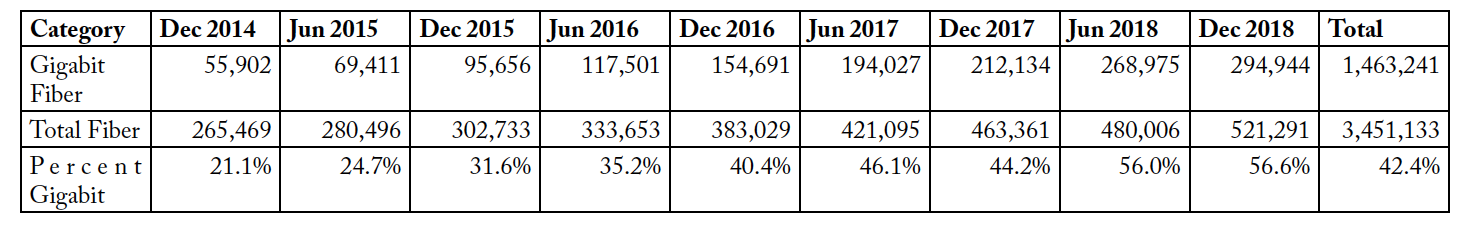
Unlike cable, aDSL and fiber service plans showed significant growth in our sampled census tracts. The number of aDSL service plans that met or surpassed the 25 Mbps/3 Mbps threshold grew 144 percent overall. VDSL service plans in particular increased 291 percent. Meanwhile the number of fiber service plans increased 96.4 percent. We observe even-greater growth in the number of gigabit fiber service plans for each six-month interval, shown in table 3. Between December 2014 and December 2018, the frequency of gigabit fiber service plans grew over 400 percent, far outpacing total growth in all fiber services. Gigabit speeds were only advertised for 21.1 percent of fiber broadband service plans in December 2014. In December 2018, 56.6 percent of all fiber service plans advertised speeds of at least 1 Gbps.
Table 3. Number of Gigabit Fiber Service Plans in Sample & Percentage of All Fiber Service Plans That Advertise Gigabit Speed, by Year-Month
Despite this growth in gigabit fiber service, increases in service quality for fiber and aDSL plans have been modest compared to cable service. Average fiber download speeds increased about 165 percent from the end of 2014 to the end of 2018, and aDSL speeds increased by an even more modest 34 percent. In absolute terms, cable and fiber service quality were near parity in 2018.
We estimate competition at the household level in each period by counting the number of distinct broadband providers reporting any type of aDSL, cable, or fiber service at the census-block level. Using FCC registration numbers (FRNs), we are able to identify distinct providers within and across blocks and across the six-month surveys.
First, we consider intraplatform competition. Table 4 shows the number of census blocks with a given number of distinct providers within each provider category. In all provider categories, most blocks with at least one provider only had one provider in each category. Table 5 shows that 93.1 percent of census
blocks with any cable broadband service had only one cable provider, and 89.2 percent of blocks with fiber service had only one fiber provider. This suggests that intraplatform competition is limited in the United States and might not have a significant relationship with service quality.
Table 4. Provider Counts across Sampled Census Blocks, by Provider Category
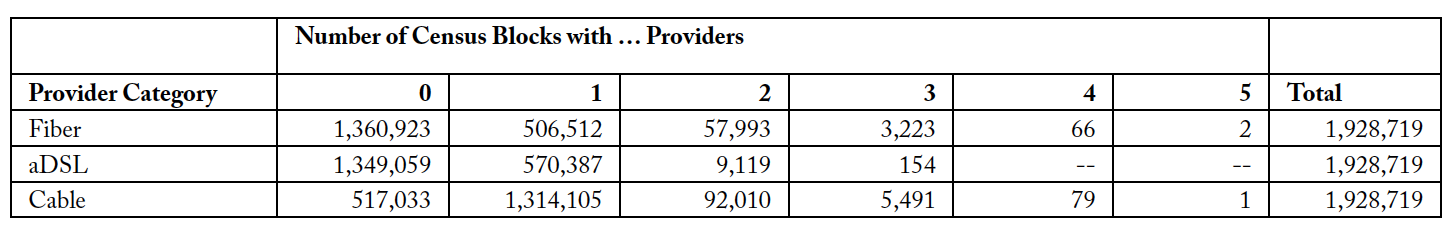
Table 5. Percent of Sampled Census Blocks with One and Only One Provider, by Provider Category and Year-Month
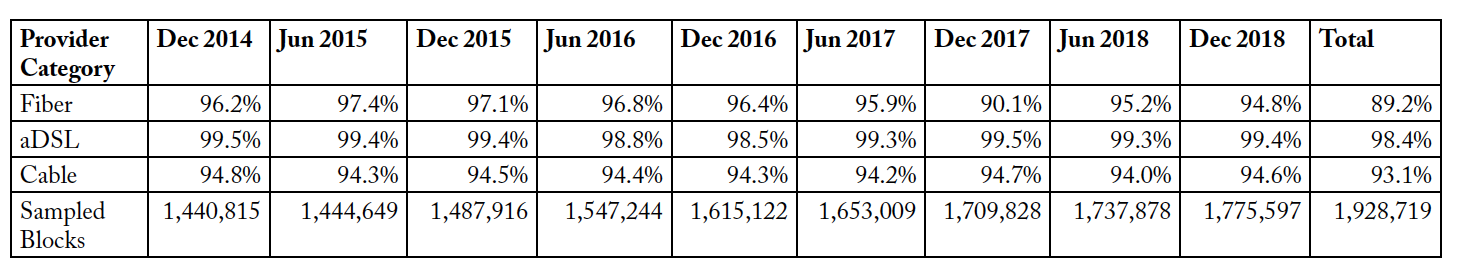
Note: Percentages are computed conditional on the census block having at least one provider in a given provider category. For example, of the 1,411,686 census blocks in our total sample with at least cable provider, 1,314,105, or a 93.1 percent, of those blocks only have one cable provider.
Second, we consider interplatform competition. Tables 6.1 and 6.2 summarize our estimates of the levels of interplatform competition at the census-block level for aDSL and cable providers, respectively. Table 6.1 shows that of the 579,660 sampled census blocks with at least one aDSL provider, 156,332 blocks (or 27.0 percent) were served by one fiber provider, and 415,189 (71.6 percent) were also served by one cable provider. On average, a census block served by an aDSL provider had 0.32 fiber providers and 0.83 cable providers over our entire sample. Meanwhile, the median aDSL block had zero fiber providers and one cable provider.
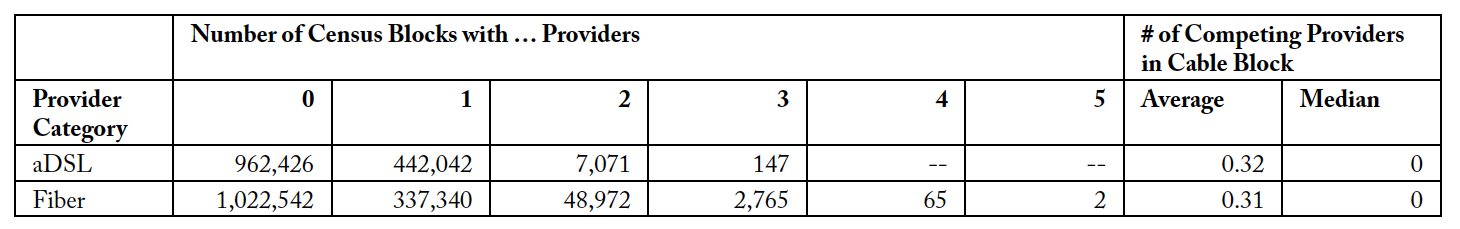
Meanwhile, well over half of the 1,411,686 census blocks served by a cable provider had zero aDSL or fiber offerings, as shown in table 6.2. This suggests that cable providers do not face significant levels of interplatform competition in the United States, at least from other fixed-wireline providers.
Table 6.1. Interplatform Competition in Blocks Served by One or More aDSL Providers
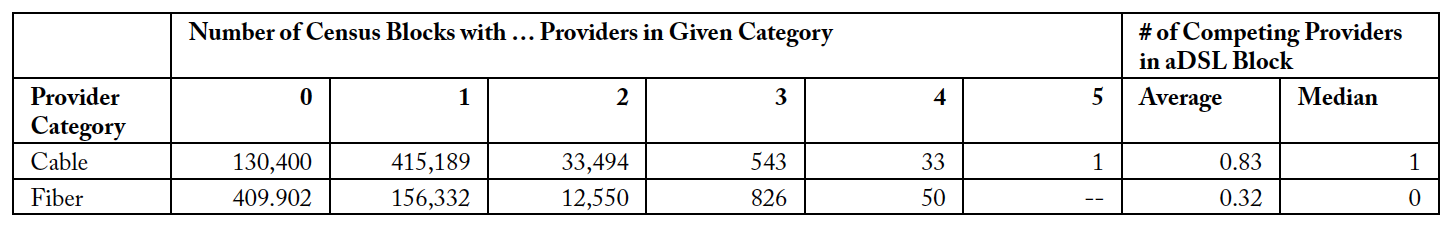
Table 6.2. Interplatform Competition in Blocks Served by One or More Cable Providers
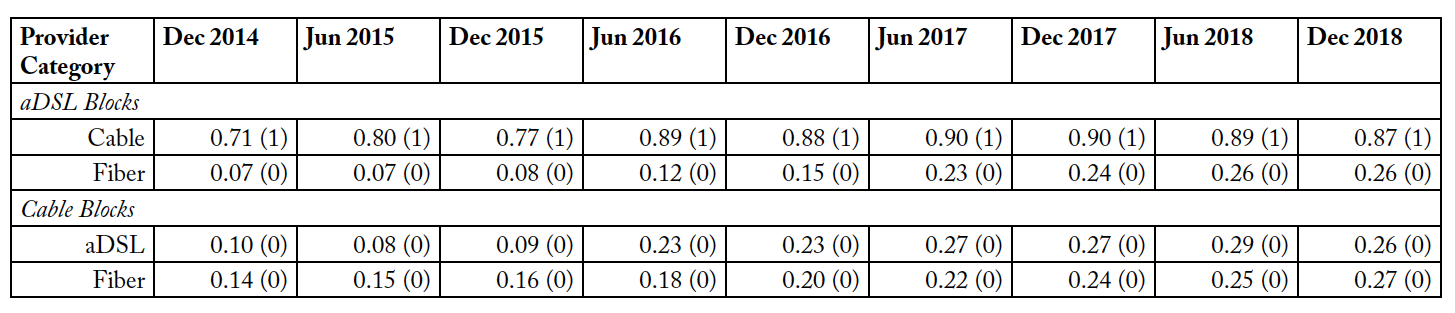
However, table 7 shows that the average number of aDSL and fiber providers in cable-served blocks increased significantly between 2014 and 2018. That table presents the average and median number of interplatform competitors for each year-month in our sample. The average number of aDSL providers in cable-served blocks increased 190 percent from 2014 to 2018, while the average number of fiber offerings in cable-served blocks increased 79 percent. Meanwhile, aDSL providers saw a significant increase of 271 percent in interplatform competition from fiber providers. On average and at the median, aDSL providers are yet more likely to face interplatform competition from a cable operator than a fiber provider.
Table 7. Interplatform-Competition Estimates for Each Year-Month in Sampled Census Blocks
Each cell presents the average number of interplatform competitors in sampled census blocks served by aDSL, cable, and fiber providers, respectively, for each year-month, with median number of competing providers by category in parentheses.
Note: The levels of the interplatform provider counts and the number of census blocks at each level for each provider category are presented in tables A-2.1 and A-2.2 in the appendix.
Overall, the data presented from our FCC Form 477 panel support the hypothesis that interplatform competition from fiber providers, particularly fiber providers offering gigabit download speeds, has a significant relationship with incumbent providers’ service quality. First, we presented evidence that overall fiber service plans and gigabit fiber service plans grew substantially between December 2014 and December 2018. Second, we provided evidence that the number of fiber providers increased significantly in blocks served by aDSL and cable operators between 2014 and 2018. Third, we observed that increases in interplatform competition from fiber providers coincided with cable-provider modem upgrades—namely, from DOCSIS 3.0 to DOCSIS 3.1—which greatly improved the quality of service of cable broadband service plans.
We also presented evidence that there is not robust intraplatform competition among fixed-wireline providers in the United States. Of the three major provider categories that we analyze, fiber has the highest share of census blocks with more than one provider within its category, but we estimate that only just over 10 percent of blocks with a fiber provider have more than one fiber provider. This suggests that intraplatform competition may not have a statistically or economically significant relationship with the service quality offered by cable or aDSL providers.
The next section describes the econometric methods we use to more rigorously test our hypotheses about fiber-provider entry and incumbent service quality.
4. Methodology
We employ panel econometric methods to model the download speeds of aDSL and cable providers in fibered markets. Assembling the Form 477 datasets as a panel has distinct advantages over cross-sectional analysis when it comes to questions of firm entry and its relationship with the service quality of incumbents. The results of an analysis that exploits only cross-sectional variation might be biased by omitted variables.18The empirical industrial-organization literature following Bresnahan and Reiss, “Entry” uses cross-sectional variation in the number of firms and market size (usually approximated by the total population within the predetermined market boundary) to estimate the effects of new entrants on the competitive conduct of incumbent firms. A number of empirical analyses of broadband competition use cross-sectional variation—for example, Aron and Burnstein, “Broadband Adoption”; Prieger, “Supply Side”; Greenstein and Mazzeo, “Role of Differentiation”; Molnar and Savage, “Market Structure.” In particular, observing a statistically significant positive correlation between higher speeds and the presence of inter- or intraplatform competitors might suggest a competitive effect, but the correlation could also be explained by omitted measures of market conditions that make offering higher-quality service more profitable for all types of providers outside of the new-entrant channel.
Simple panel econometric methods help to reduce concerns about omitted variable bias.19Flamm and Varas, “Quality Competition” and Wilson, “Local Competition” are recent empirical papers that use panel datasets to study broadband speeds. Similar to us, Flamm and Varas use FCC Form 477 data to evaluate the effects of the entry of wireline and wireless broadband service on the quality of incumbent wireline providers. Meanwhile, Xiao and Orazem, “Fourth Entrant” use time-series variation in local market structure to study market entry and competitive conduct. First, constructing a panel allows us to observe the outcome variable (highest advertised download speeds) before and after entry of a fiber provider into a given census block. Entry and exit occur in multiple stages, so observing the number of competitors and the quality of their service before and after entry allows for more plausible inference about the relationship between a new entrant and incumbent product quality. This variation in the data can help us identify how download speeds offered by cable or aDSL providers correlate with the presence and distinct number of fiber competitors in each census block. These correlations might offer suggestive evidence that fiber provider entry induces cable or aDSL providers to improve service quality. Alternatively, fiber providers might enter only census blocks with supply-side (for example, favorable right-of-way access for providers) or demand-side (for example, higher-income households) factors that make conditions favorable for broadband providers of all transmission technologies to offer higher speeds.
Second, constructing a panel with observations in all forty-eight contiguous states and the District of Columbia reduces the potential for sample biases that arises in analyses that limit their samples to particular states or local markets. In addition, having more geographic areas represented in our sample allows us to use state fixed effects to control for time-invariant factors that might affect providers’ quality decisions through demand-side channels not fully controlled for by income. Controlling for state fixed effects accounts for variance in state-level broadband policies,20Pew, “State Broadband Policy Explorer.” and controlling for time fixed effects accounts for unobserved factors such as (1) the improving quality of edge services (for example, Netflix, Amazon Prime, and HBO online streaming services) that stimulate consumer demand for broadband service and (2) general changes in technological capability and know-how. Together, state and time fixed effects foreclose the possibility that our estimated effects of competition on download speeds are attributable to omitted variables that vary only across time or only across states.
We model the download speeds of a broadband service plan in a given census block on a given transmission technology in a given year-month with the following ordinary least squares (OLS) specifications. Equations (1) and (2) show the specifications in which the regression sample selects only cable-broadband service. We also describe minor alterations that we make for the aDSL broadband service specifications below. The dependent variable, maximum advertised download speed, is the clearest measurement of service quality recorded by the FCC Form 477. The distribution of download speeds is right-censored at 1,000 Mbps, as the FCC records any reported download speeds of at least 1,000 Mbps as equal to 1,000 Mbps.

We convert download speeds from megabits per second to kilobits per second (kbps) so that the natural logs do not take negative values. The log transformation makes the values of the dependent variable continuous on the interval [ln(25,000), ln(1,000,000)], or approximately [10.13, 13.81].
We estimate competition at the household level by counting the number of distinct aDSL, cable, giga- bit fiber, and non-gigabit fiber providers at the census-block level. We avoid double counting a provider that reports multiple service offerings of aDSL (for example, aDSL 2 and VDSL) or cable (for example, DOCSIS 3.0 or 3.1) transmission technology in the same census block. Counting, for example, a single provider that reports aDSL 2 and VDSL service in the same block as two aDSL providers would greatly overstate the level of competition in a given census block.
For each of the competition counts, we produce binary variables corresponding to the number of distinct providers offering service in each provider category in each block. Assigning separate binaries allows for heterogeneity in the marginal effects among broadband competitors.21Xiao and Orazem, “Fourth Entrant” find quickly diminishing marginal returns to additional competitors. For example, if a cable operator serves a census block with two non-gigabit fiber providers (that is, providers with maximum download speeds less than 1 Gbps), then the non-gigabit fiber dummies are defined as (Non-Gigabit Fiber #1 = 0, Non-Gigabit Fiber #2 = 1, Non-Gigabit Fiber Three or More = 0). We include binaries for fiber providers offering lower-than-gigabit download speeds in order to control for any effect these providers might have on cable and aDSL incumbents independent of gigabit fiber operators.
We observe few census blocks with more than three distinct intraplatform or interplatform operators, so including distinct binaries for the fourth or fifth provider in our specifications might bias our results.22See tables 4, 6.1, and 6.2. Accordingly, we include competition-count binaries that indicate that three or more distinct providers within a provider category serve a given census block, as shown in equation (1).
When the regression sample only includes cable service plans, we omit the dummy indicating that one cable provider serves the block because we are selecting for blocks with at least one cable provider, as shown in equation (1). Likewise, we drop the aDSL #1 dummy for the aDSL specifications.
We also include in our specifications variables that control for factors that affect the supply of and demand for broadband service. Median income, estimated at the census-tract level by the Census Bureau,23 US Census Bureau, “American Community Survey: Table S1903.” is used to control for variation in market demand.24Flamm and Chaudhuri, “Broadband Access”; Prieger, “Supply Side”; Wallsten and Mallahan, “Residential Broadband Competition.” We adjust each annual estimate of median income to 2018 dollars so that variance in income over time is measured in real terms.25 We use the Consumer Price Index (CPI) for all items, including food and energy, from the US Bureau of Labor Statistics. We aggregate the monthly CPI measures for each year by taking the end-of-period value to align the CPI with the December FCC Form 477 data in our sample. The distribution of median income for each year is right-censored at $250,000 in nominal terms. In real terms, median-income estimates are censored at $267,355. The censoring of median income in the right tail reduces the right skewness of the data, and we log-transform median income to reduce the right skewness further.26See table A-3 in the appendix.
In addition, population density and housing density are positively related to broadband deployment, up-take, and service quality.27Prieger, “Supply Side”; Wallsten and Mallahan, “Residential Broadband Competition.” Assuming that fixed investment in broadband infrastructure can deploy service to approximately equal geographic land areas, broadband providers can serve more households by building networks in more densely populated regions. We use housing density and population density as proxies for supply-side costs in our regressions. At the block-group level, housing density and population density have extreme outlier values in the right tail. Both are log-transformed to reduce right skewness.28See table A-3 in the appendix.
To estimate population density and housing density at the block-group level, we obtain annual estimates from 2014 to 2018 of total population and the number of housing units at the block-group level from the Census Bureau.29US Census Bureau, “American Community Survey: Table B01003”; US Census Bureau, “American Community Survey: Table B25001.” Some providers reported service in block groups which the American Community Survey estimates to have zero population or zero housing units. Observations in such block groups are dropped. We divide total population and number of housing units by annual estimates of block-group land area for each year, which we source from the Census Bureau30US Census Bureau, “TIGER/Line Shapefiles.” and extract using QGIS software.31QGIS version 3.4.8-Madeira; Python version 2.7.16. Broadband service reported for a block group with zero land area (that is, where the block group is only water) is also dropped from our sample.
We do not interpolate median income, population density, or housing density for the June Form 477 broadband data. To offer an example, the observations dating from June and December 2016 have equal values for population density, housing density, and median income.
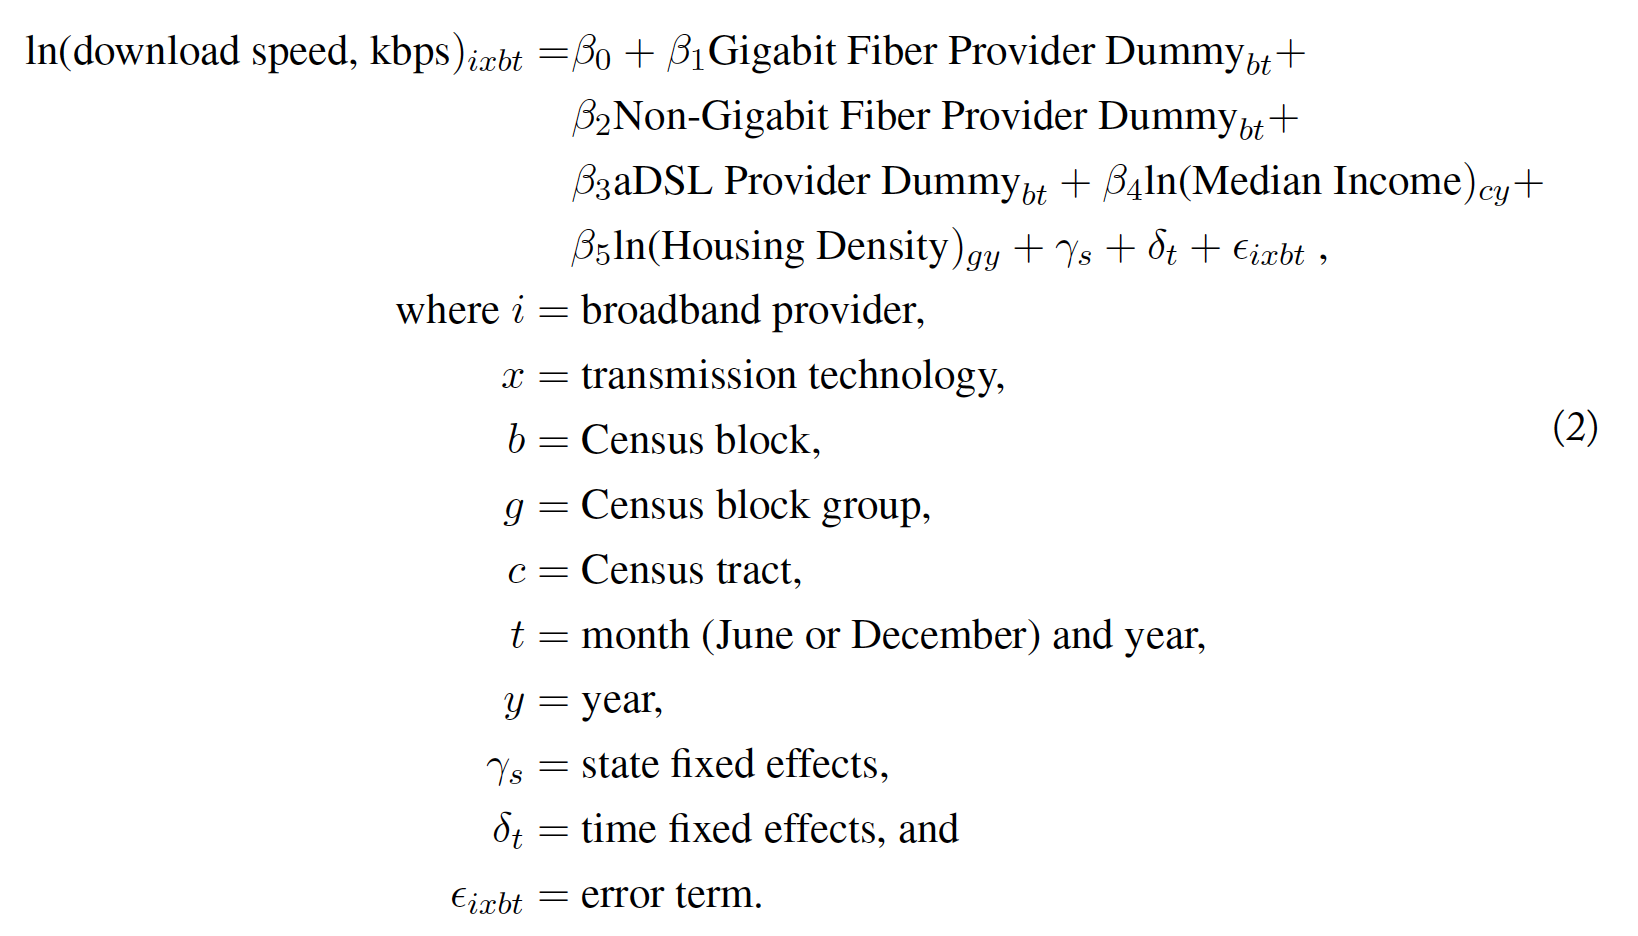
Equation (2) shows our OLS specification that replaces the competition-count dummies with a dummy indicating the presence of any (that is, one or more) competitors for each provider category. Because our specifications select the regression sample for cable or aDSL service, this model can only estimate the relationship between interplatform competition and download speeds. A dummy indicating the presence of a cable competitor will always equal one in an OLS specification with only cable service in its regression sample and thus will be collinear.
5. Results
5.1. Cable Incumbents
Table 8 shows the estimated relationships among cable service plan download speeds, the inter- and intraplatform competition-count dummies, and the demand- and supply-side controls. The most reliable estimator is shown in column (4), the specification with controls for both state and time fixed effects.
In the four specifications, we allow state fixed effects and time fixed effects to vary. In all four specifications shown in table 8, we include the natural log of housing density as a control for supply-side deployment costs. When using the natural log of population density, rather than log-transformed housing density, as the control for deployment costs, neither the statistical significance nor the size of the coefficients for the variables of interest change significantly. For this reason, we omit those results from our regression tables.
Table 8. Cable Service Quality and Inter- and Intraplatform Competitors
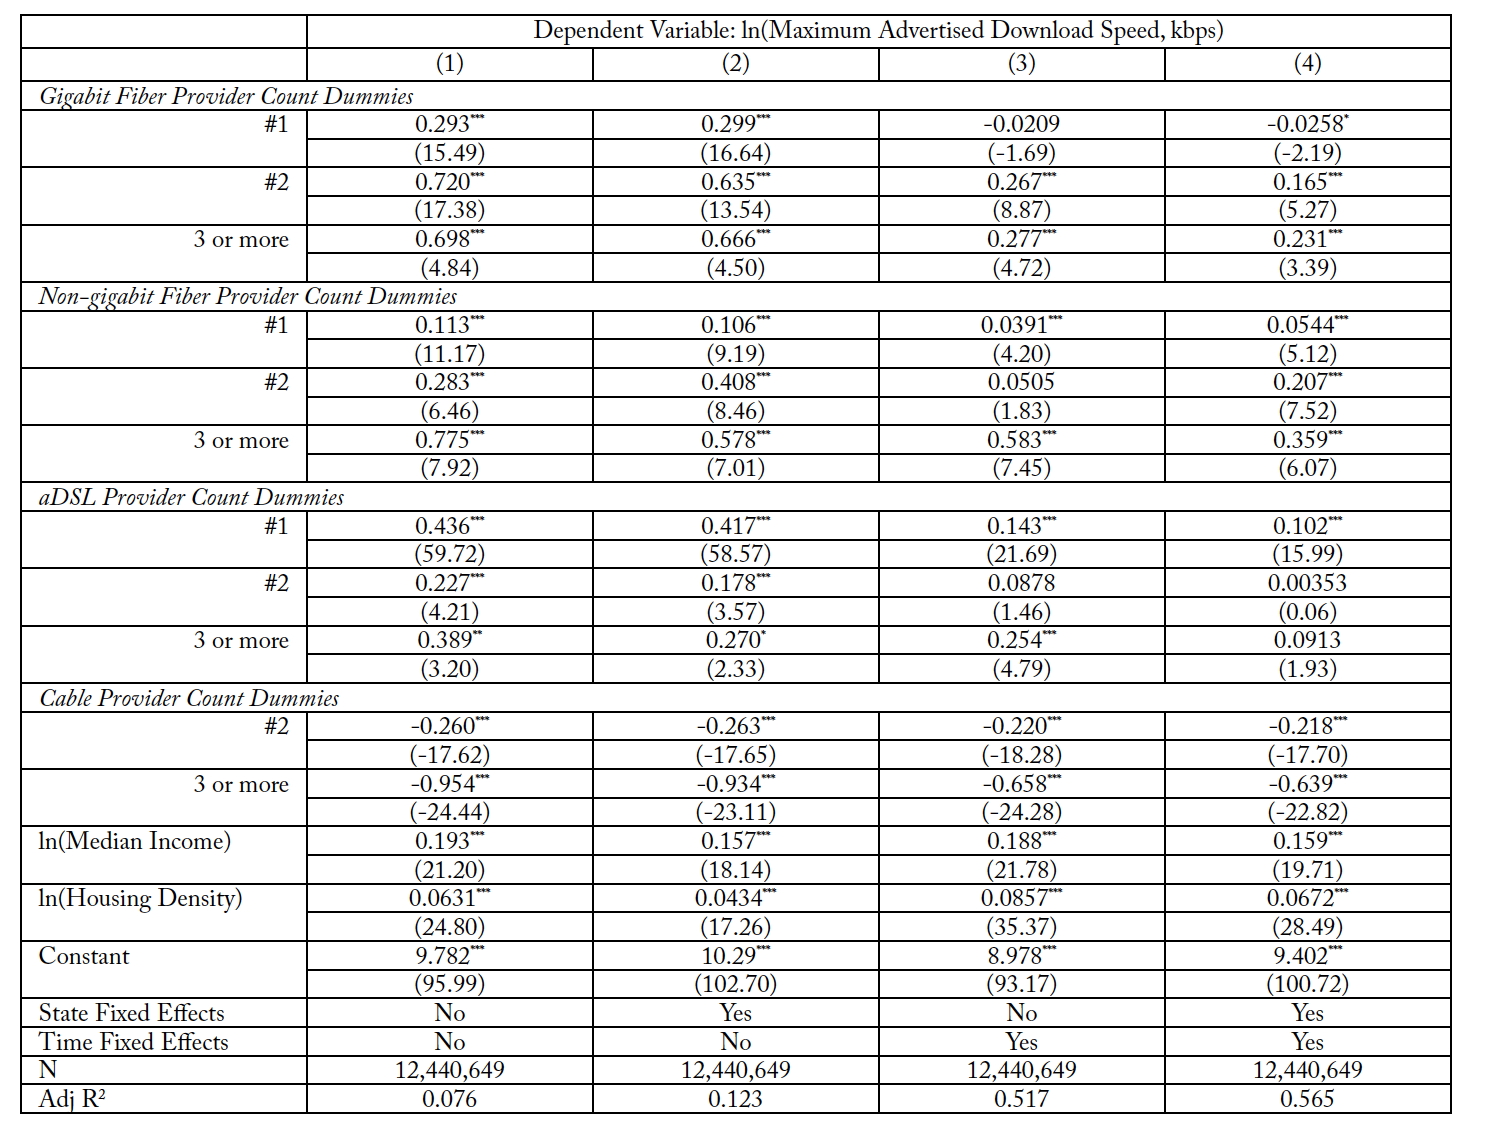
t statistics in parentheses; * p < 0.05, ** p < 0.01, *** p < 0.001
Note: All specifications are OLS regressions with robust standard errors, clustered by census tract. Summary statistics of the regression sample are presented in tables A-4.1 and A-4.2 in the appendix.
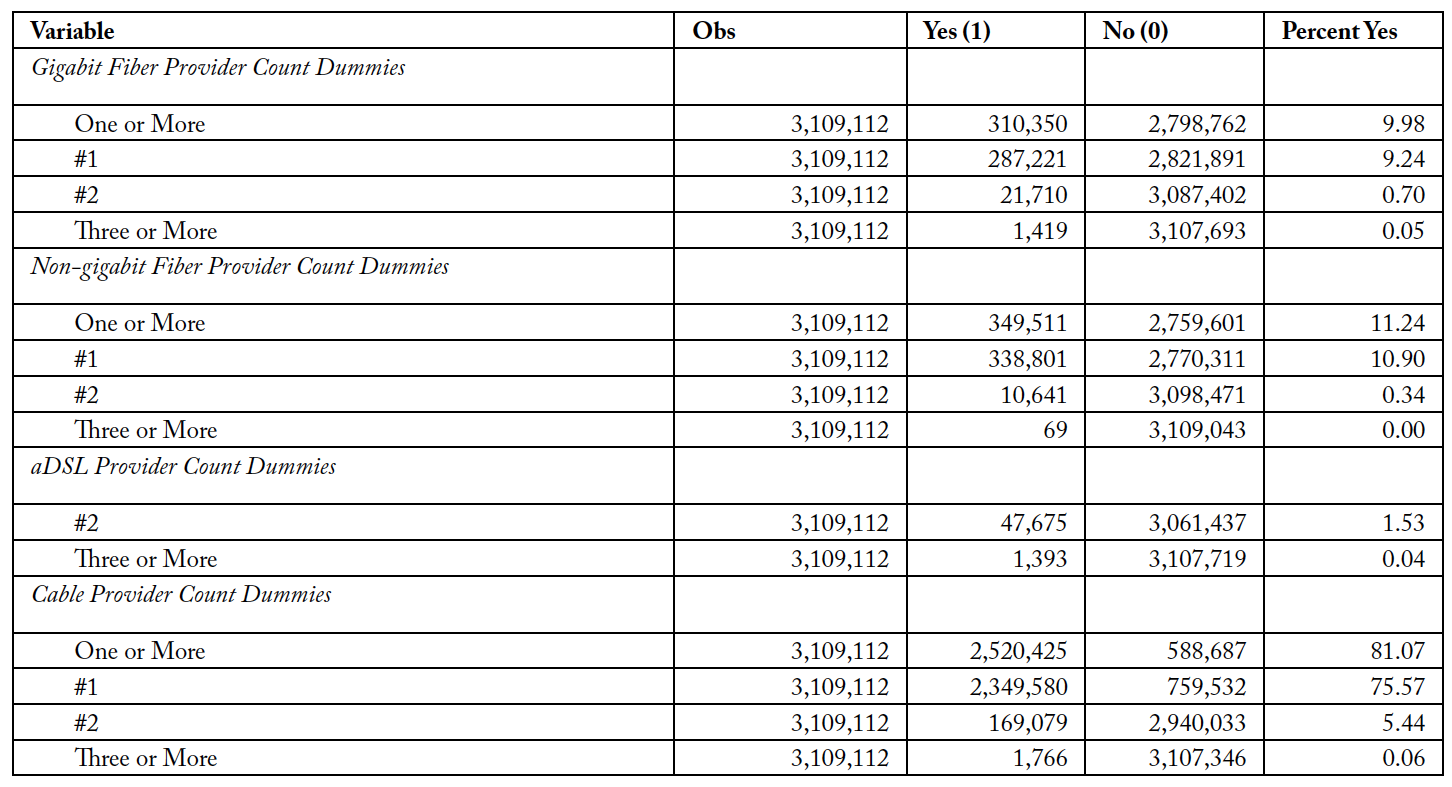
The variables of interest are the binary values for the number of interplatform and intraplatform competitors. Regarding intraplatform competition, the summary statistics presented in tables 4 and 5 suggest that intraplatform competition is not robust among cable operators. This also holds for our regression sample. Table A-4.2 in the appendix shows that only 11 percent of our regression sample of cable-broadband service plans are offered in census blocks in which a second cable provider operates. Meanwhile, less than 1 percent of our regression sample of cable service plans have three or more cable providers operating in their census blocks.
Yet our results indicate a statistically and economically significant negative relationship between marginal cable competitors in blocks served by cable operators and average cable download speeds. Because the competition variables on the right-hand side take binary values and the dependent variable is log transformed, we interpret the coefficients as percent changes in maximum advertised download speeds in the presence of an interplatform competitor relative to speeds observed in the absence of an interplatform competitor. The presence of a second cable provider corresponds to a statistically significant 19.6 percent decline in average cable speeds, all other factors held constant, while cable plans in a block with three or more cable operators have average speeds 47.2 percent lower than cable providers in blocks with no other cable operator, all else constant. This result indicates that cable service in census blocks with cable “overbuilds” have significantly lower average download speeds than cable broadband in blocks with no overbuild.
Table 8 also presents estimates of the relationship between different levels of interplatform competition and cable download speeds. In our regression sample, over 20 percent of observed cable-broadband plans face one aDSL competitor in their census block. Meanwhile about 8.5 percent of cable service offerings face competition from one gigabit fiber provider in their blocks, and about 11.6 percent of cable service offerings face competition from one non-gigabit fiber competitor.
Thus, the most robust competition faced by cable operators appears to be interplatform competition with one and only one aDSL operator. We estimate a significant positive relationship with the first aDSL competitor in a census block. We estimate that the presence of the first aDSL competitor is correlated with a 10.7 percent increase in cable download speeds on average, with all other factors held constant. Meanwhile, having a second aDSL competitor or having three or more aDSL providers in a cable-served block is not found to have a statistically significant relationship with cable download speeds.
We also interpret the relationship between gigabit fiber competitors and cable service quality. Contrary to our hypothesis, the presence of the first gigabit fiber competitor is negatively correlated with cable down- load speeds, after controlling for the number of fiber providers offering speeds below 1 Gbps. The coefficient indicates that the presence of one gigabit fiber operator in a cable-served block is associated with a 2.5 percent decrease in cable speeds, all else constant, although this relationship is significant only at the 5 percent level.
However, the presence of a second gigabit fiber operator or three or more such operators in a cable-served block has statistically and economically significant positive correlations with cable download speeds. For instance, cable service offered in a block with two gigabit fiber providers has 17.9 percent faster average download speeds, all else constant. However, the share of cable-broadband service offerings in our regression sample that face competition from more than one gigabit fiber provider is exceedingly small: only 0.5 percent.32See table A-4.2.
However, competition from non-gigabit fiber providers appears to have a positive relationship with cable speeds for all levels of competition counts included in our specification. The first non-gigabit fiber provider in a cable-served block predicts a 5.6 percent increase in cable speeds. While only a small percentage of cable-broadband plans in our sample are offered in blocks with competition from two or more non-gigabit fiber providers, our econometric results suggest an economically significant relationship. The presence of a second non-gigabit fiber provider predicts cable speeds 23.0 percent faster than average, while having three or more in a cable-served census block predicts 43.2 percent faster cable speeds.
Table 9. Cable Service Quality and Presence of Interplatform Competitors
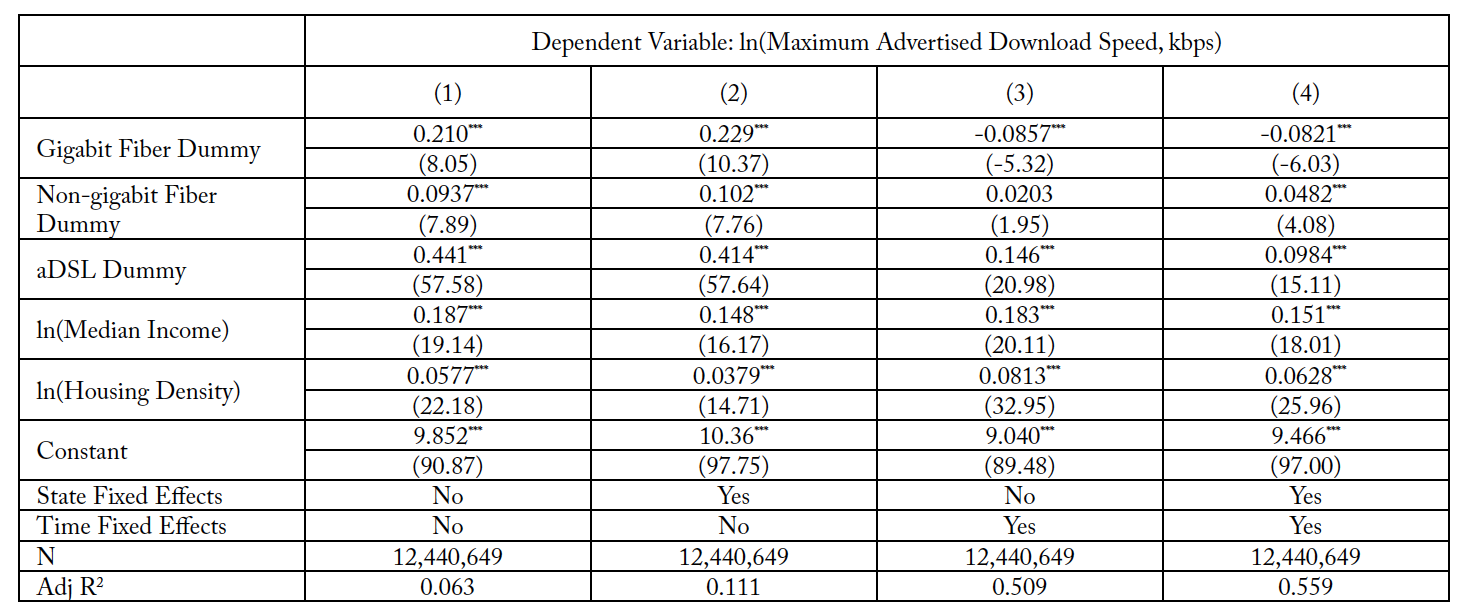
t statistics in parentheses; * p < 0.05, ** p < 0.01, *** p < 0.001
Note: All specifications are OLS regressions with robust standard errors, clustered by census tract. Summary statistics of the regression sample are presented in tables A-4.1 and A-4.2 in the appendix.
Table 9 presents the results for the relationship between cable service quality and the presence of any (that is, one or more) interplatform competitors. The directions of the interplatform-competition coefficients
in table 9 are identical to the directions of the coefficients for the provider #1 dummies in table 8. In addition, the magnitudes of the coefficients are similar between the non-gigabit fiber and aDSL presence dummies in table 9 and the first non-gigabit fiber provider and first aDSL provider dummies in table 8, respectively. Meanwhile, we estimate a more economically significant negative relationship for the dummy for gigabit fiber provider presence, which is statistically significant at the 0.1 percent level. Similar to the results in table 8, cable download speeds have a negative correlation with the presence of a gigabit fiber competitor, a positive correlation with the presence of a non-gigabit fiber competitor, and a positive correlation with the presence of an aDSL competitor.
All these correlations are statistically significant at the 0.1 percent level, and the coefficients all indicate relationships of economically significant magnitude. We relate these predicted percent changes to the average download speed for DOCSIS 3.0 service, which is the most frequent cable-service category in our sample and averaged 213 Mbps over all periods. All else constant, the presence of a gigabit fiber provider in a block served by a DOCSIS 3.0 provider predicts average download speeds 7.9 percent lower, at approximately 196 Mbps. Meanwhile, the presence of a fiber provider offering lower-than-gigabit speeds predicts 4.9 percent higher DOCSIS 3.0 speeds, at approximately 223 Mbps on average. Finally, an aDSL competitor in the block is associated with DOCSIS 3.0 speeds approximately 10.3 percent higher, at 235 Mbps on average.
The presence of a non-gigabit fiber competitor predicts faster cable download speed, but only a 4.9 percent increase. This means that this form of fiber competition explains only a small share of the observed significant increases in cable speeds between 2014 and 2018, after controlling for other modes of competition, income, density, and any effects of time and place.
As shown in table 6.2 and in our regression-sample tables A-4.1 and A-4.2 in the appendix, census blocks served by a cable-broadband operator rarely have two or more aDSL- or fiber-broadband providers.
While the second and third fiber providers (both gigabit and non-gigabit) have positive and statistically significant correlations with cable download speeds, any marginal effects are washed out by the substantial lack of robust interplatform competition in cable-served census blocks.
In tables 8 and 9, our control variable for supply-side factors—log-transformed housing density—has the predicted positive, significant relationships with maximum advertised download speeds for cable-broad- band service, which is consistent with the literature. Using the log-transformed value of population density instead of log-transformed housing density as a control for deployment costs yields largely identical results to the specifications shown in table 9, and it also has the predicted positive relationship with service quality (results not shown).
In addition, we consistently find a positive, statistically significant relationship between median income and maximum advertised download speeds, which is consistent with previous findings. Because both variables are log transformed, we interpret the coefficient as the income elasticity of cable service quality. A census tract with 10 percent higher median income than the average tract has cable download speeds approximately 1.4 percent faster than the baseline tract, all other factors constant.
Finally, for all time-fixed-effects specifications that control for year-month, the coefficients (not shown) are positive and statistically significant at the 0.1 percent level. This aligns with our observation above that average cable download speeds increased over our sample’s period. Taken together, the signs of the coefficients of our controls indicate that our model is consistent with economic theory and previous empirical research.
Table 10. aDSL Service Quality and Number of Inter- and Intraplatform Competitors
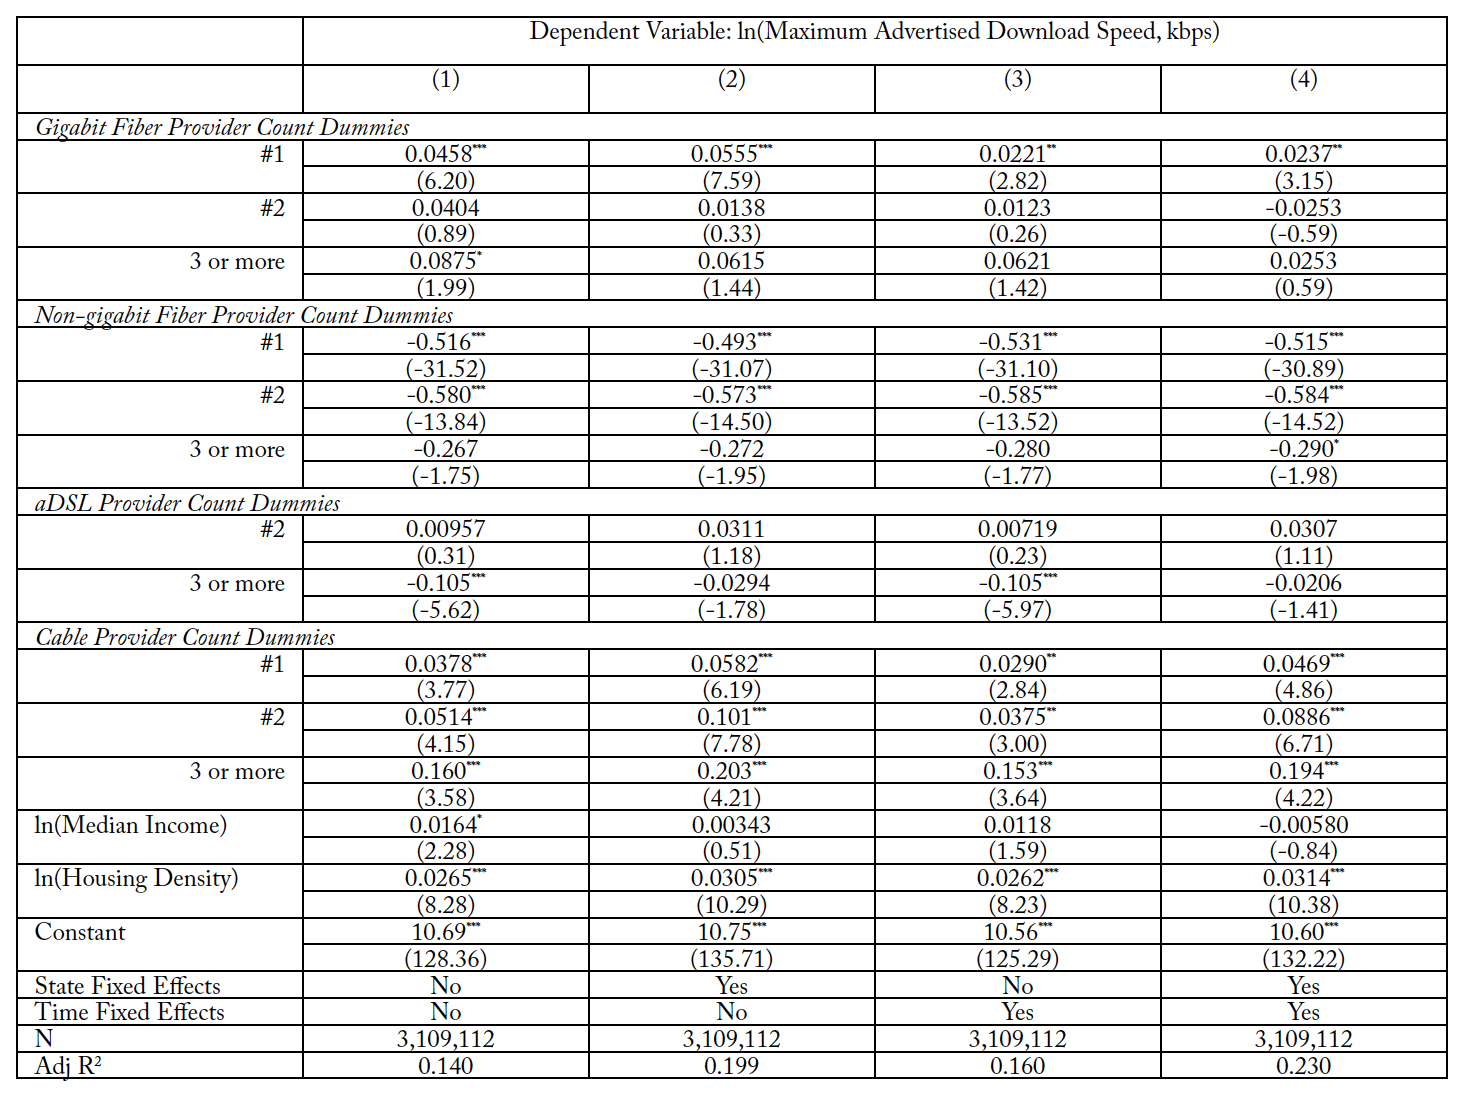
t statistics in parentheses; * p < 0.05, ** p < 0.01, *** p < 0.001
Note: All specifications are OLS regressions with robust standard errors, clustered by census tract. Summary statistics of the regression sample are presented in tables A-4.1 and A-4.2 in the appendix.
5.2. aDSL Incumbents
Table 10 shows the estimated relationships between our variables of interest, control variables, and the maximum download speeds offered in aDSL service plans. Again, the most reliable estimator is shown in column (4), the specification controlling for both state and time fixed effects.
In the four specifications, we again allow state fixed effects and time fixed effects to vary. We find that housing density, population density (not shown), and year-month (not shown) all have statistically significant, positive relationships with aDSL download speeds, which is consistent with previous research and economic theory. However, we find no evidence of a statistically significant relationship between median income and aDSL service quality. This suggests that aDSL service quality was not responsive to changes in income over our sample period.
The variables of interest in table 10 allow for inference about the relationships between inter- and in- traplatform competition and aDSL download speeds. Notably, the coefficients and statistical significance for the variables of interest do not change significantly when controlling for broadband deployment costs with housing density or population density.
Regarding intraplatform competition, we find no evidence of a statistically significant relationship between aDSL service quality and the presence of either a second or third (or more) aDSL operators in a census block. Table A-5.2, which shows the summary statistics of our regression sample, indicates that only 1.5 percent of aDSL service offerings in our sample are offered in a block with a second aDSL operator.
However, we find that aDSL plans in our regression sample face higher levels of interplatform competition than cable plans and that such competition has significant relationships with aDSL speeds. One cable provider is present in the census blocks of over 75 percent of the aDSL service plans in our regression sample. The presence of one cable operator serving an aDSL block predicts about a 4.8 percent increase in aDSL download speeds. To relate that percent increase to average aDSL speeds, the presence of one competing cable provider predicts asymmetric xDSL increases from 54.2 Mbps to 56.8 Mbps, aDSL2/2+ increases from 38.7 Mbps to 40.6 Mbps, and VDSL increases from 70.4 Mbps to 73.8 Mbps.
Further, the second and third (or more) cable operators in an aDSL block have positive relationships with aDSL speeds, with increasing marginal effects on the outcome variable. However, only a small percentage of aDSL-served blocks have more than one cable operator, so any economic effect of having two or more cable operators is limited to a small subset of census blocks.
Meanwhile, approximately 9 percent and 11 percent of aDSL service offerings in our regression sample have one gigabit fiber competitor or one non-gigabit fiber competitor in the census block, respectively. In our best estimates in specification (4), after controlling for non-gigabit fiber service, competition from one gigabit fiber provider has a positive relationship with aDSL speeds that is statistically significant at the
1 percent level. The presence of one gigabit fiber provider in an aDSL-served census block predicts a 2.4 percent increase in aDSL service speed. To relate that to the average aDSL speeds in table 2, an additional gigabit fiber provider predicts that asymmetric xDSL speeds increase from 54.2 to 55.5 Mbps, aDSL2/2+ speeds increase from 38.7 to 39.6 Mbps, and VDSL speeds increase from 70.4 Mbps to 72.1 Mbps.
However, the presence of one, two, or three or more non-gigabit fiber providers predicts significantly lower aDSL speeds. For instance, the first non-gigabit provider in an aDSL-served census block predicts a
40.2 percent decrease in average aDSL speeds in the block.
Table 11. aDSL Service Quality and Presence of Interplatform Competitors
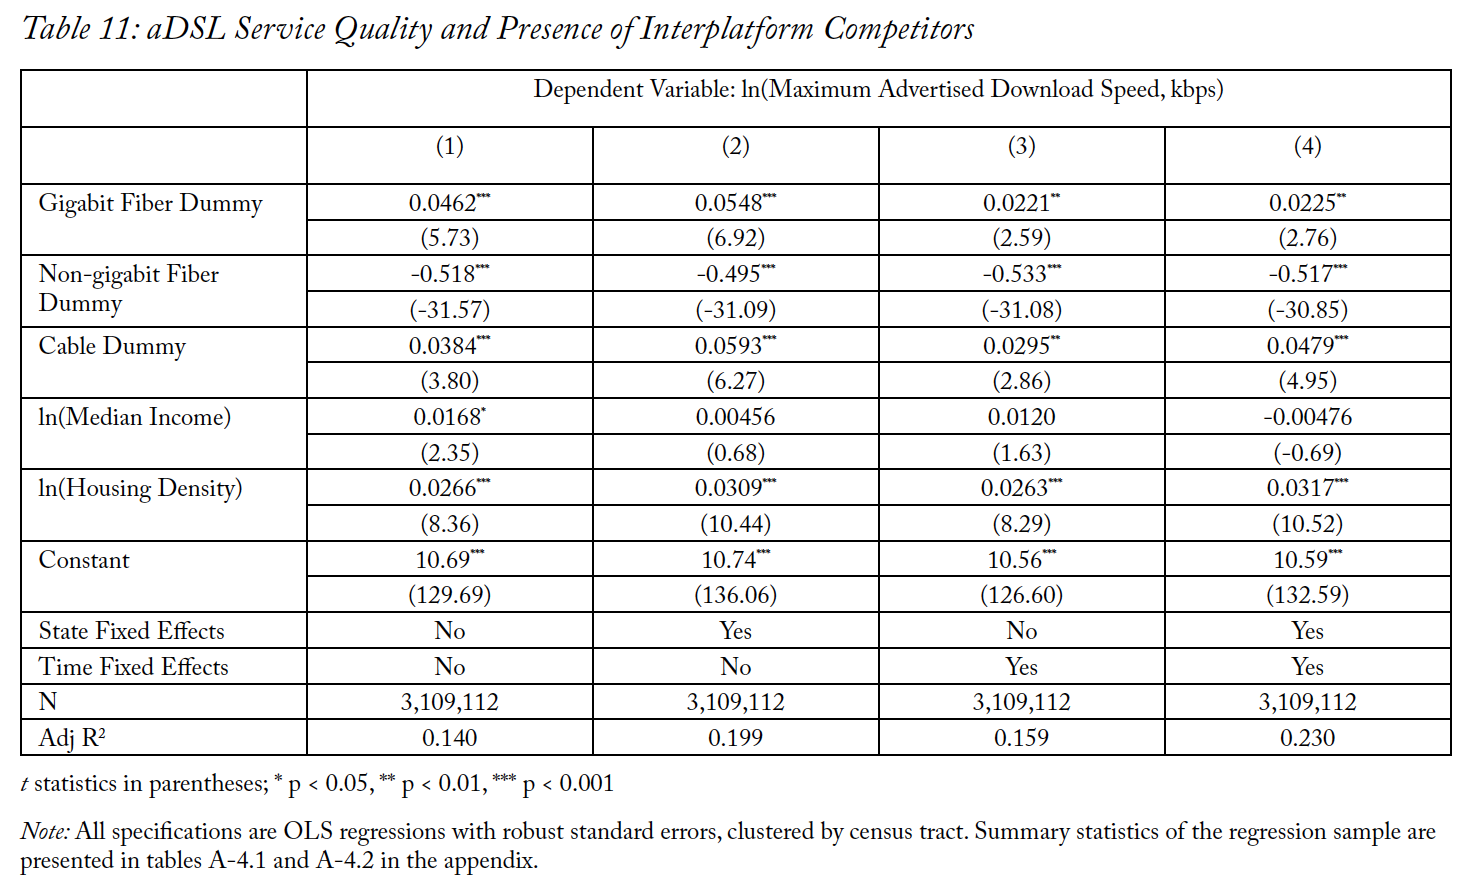
t statistics in parentheses; * p < 0.05, ** p < 0.01, *** p < 0.001
Note: All specifications are OLS regressions with robust standard errors, clustered by census tract. Summary statistics of the regression sample are presented in tables A-4.1 and A-4.2 in the appendix.
Our estimates of the relationships between aDSL speeds and the presence of interplatform competitors in a census block are consistent with the results presented above and similar in both statistical significance and magnitude. Table 11 shows the results of these regression specifications. As with the results in table 10, we find that aDSL download speeds have a positive relationship with the presence of a gigabit fiber competitor, significant at the 1 percent level; a negative relationship with the presence of a non-gigabit fiber provider, significant at the 0.1 percent level; and a positive relationship with the presence of a cable provider, significant at the 0.1 percent level.
The negative relationship between aDSL speeds and the presence of a non-gigabit fiber provider has notable economic magnitude. All else constant, the presence of one or more fiber operators offering low- er-than-gigabit speeds in an aDSL block predicts a 40.4 percent decrease in aDSL speeds.
6. Discussion
This paper has analyzed broadband service quality in the forty-eight contiguous states and Washington, DC, when aDSL and cable incumbents share the market with a fiber competitor. Of particular interest is the relationship between the entry of fiber providers offering download speeds of at least 1 Gbps and the quality of service of incumbent aDSL and cable operators, although we present results on other modes of broadband competition among fixed-wireline broadband operators as well. Public investments in broadband deployment by municipalities, states, and the federal government have all prioritized fiber buildout because of the fast download speeds that it can deliver, so our findings have implications for public policies that aim to stimulate new market entry and competition in broadband services.
First, we established that the number of fiber service offerings grew substantially from December 2014 to December 2018. The total number of fiber broadband service offerings in our sample increased by over 96 percent, and that growth was far outpaced by growth in gigabit fiber service. The share of fiber broadband service plans that advertised gigabit download speeds increased from 21 percent in December 2014 to over 56 percent in December 2018. Second, we provided evidence that the presence of fiber providers in blocks served by aDSL and cable incumbents increased significantly between December 2014 and De- cember 2018. While the median census block served by an aDSL provider or a cable provider still has zero fiber operators, the number of fiber competitors increased significantly in expected-value terms. Third, we observed that increases in interplatform competition from fiber providers coincided with cable-provider modem upgrades—specifically, from DOCSIS 3.0 to DOCSIS 3.1—which greatly improved the quality of service of cable broadband service plans.
However, our econometric results suggested that the economic and statistical relationship between giga- bit fiber provider entry and incumbents’ service quality is limited. First, when modeling cable download speeds, we found that gigabit fiber competition is negatively correlated with cable download speeds after controlling for other competitors, demand- and supply-side factors, and place- and time-invariant factors. However, the presence of a non-gigabit fiber provider in a cable-served block predicts faster cable speeds; but, at best, this relationship only explains a small share of the observed increase in cable speeds between 2014 and 2018. While we found that the level of interplatform competition between fiber and cable pro- viders increased from 2014 to 2018, we also reported that it remains low in absolute expected-value terms. Accordingly, cable buildouts and upgrades in recent years have occurred independent of direct competitive pressures from gigabit fiber operators entering their census blocks. This finding does not foreclose competitive effects entirely, as threats of market entry could trigger incumbents to improve service quality.
Second, we found evidence of a positive and statistically significant relationship between aDSL speeds and gigabit fiber service. However, when interpreting the coefficients, we found that, holding all other factors constant, the presence of a gigabit fiber provider is correlated with only a 2.3 percent increase in aDSL speeds. This suggests that any potential causal relationship between gigabit fiber provider entry and aDSL speeds would have limited magnitude, as this percentage increase would only yield an absolute increase of a few megabits per second for aDSL services offering average speeds. We also found evidence that non-gigabit fiber competition predicts a decrease in aDSL speeds. Overall, we observed only a modest increase in aDSL speeds from December 2014 to December 2018.
Our econometric results also have implications for research on intraplatform and interplatform com- petition among aDSL and cable operators. First, we found that intraplatform competition among ca-
ble-broadband providers has a significant negative correlation with cable speeds. Given that market entry is not random, low cable speeds are a plausible significant determinant of which blocks providers choose to overbuild.
Second, we found evidence that aDSL speeds have statistically significant relationships with the first cable competitor, the first gigabit fiber competitor, and the presence of any number of cable and gigabit fiber competitors. We found no evidence to support intraplatform competition having a significant correlation with aDSL speeds. These findings contribute to the literature on aDSL service quality in the presence of intraplatform and interplatform competition. For instance, a study of California broadband markets re- ports that interplatform competition from cable providers and gigabit fiber providers predicts faster speeds for aDSL incumbents, while the presence of additional aDSL operators is not found to have a significant relationship with incumbent aDSL speeds.33Prieger, Molnar, and Savage, “Quality Competition.” Our results in section 5.2 suggest that these findings for Cal- ifornia in 2011 to 2013 extrapolate to the forty-eight contiguous states and Washington, DC, from 2014 to 2018, but we also found an interesting caveat. By including fiber operators that offer lower-than-gigabit speeds in our specifications, we found that non-gigabit fiber service predicts significantly lower speeds for aDSL incumbents.
In general, the divergent effects of inter- and intraplatform competition may be related to the physical capacities of each transmission technology. Variation in download speeds across provider types is greater than the variation within provider types. Table 2 shows high variance in speeds between cable and aDSL providers and low variance among aDSL providers. Accordingly, a second aDSL operator in a census block is expected to offer broadband of similar quality to that of the incumbent aDSL provider. Economic theory suggests that these firms may compete on price, and we fail to reject the hypothesis that they do not change quality in response to marginal aDSL entrants.
In addition, marginal returns to network upgrades for aDSL providers might diminish at a higher rate than cable-network upgrades. DOCSIS 3.1 is the highest-growth cable-modem technology in our sam- ple, and its speeds, on average, are over two times faster than DOCSIS 3.0 as of December 2018. On the other hand, the highest-growth aDSL transmission technology in our sample—VDSL—offers speeds that on average outperform asymmetric xDSL by 29.9 percent across our entire sample and are actually slower on average than asymmetric xDSL as of December 2018.
There are a few limitations to our analysis. First, our panel econometric methods do not allow for causal inference. The treatment of market entry by a gigabit fiber provider is not randomly assigned, so our results might only indicate factors that correlate with the ex ante market-entry decision, rather than the ex post-market-entry effect on the service quality of incumbents. While controlling for time-invariant
factors helps address endogeneity, controlling for state fixed effects might not be sufficient to eliminate the underlying endogeneity of entry of broadband providers and the market conditions conducive to broadband deployment. Variance in supply-side factors exists across jurisdictions below the state level. Rights of way—the ease of accessing public conduits and other infrastructure—that may stimulate or deter broadband deployment vary across municipalities and counties, not just states.34 Trogdon, “Lessons.” The FCC,35 Federal Communications Commission, “Universal Service.” the US Department of Agriculture,36US Department of Agriculture. “ReConnect Loan and Grant Program.” and some states37Whitacre and Gallardo, “State Broadband Policy”; Pew, “State Broadband Policy Explorer.” administer broadband-provider subsidies that target deployment below the state level.
Second, our analysis relies on data from the FCC’s Form 477, which has potential shortcomings. Form 477’s measure of service quality is self-reported maximum advertised download speeds, which might differ from the speeds consumers actually receive, especially during peak traffic hours. In addition, the Form 477 data do not directly measure broadband service at the household level, so our results might overstate the number of fixed-wireline providers among which consumers can choose. Broadband providers might report that they offer service in a census block when they serve only a single household in that block.38Federal Communications Commission, “Explanation”: “A provider that reports deployment of a particular technology and bandwidth in a particular census block may not necessarily offer that particular service everywhere in the census block. Accordingly, a list of providers deployed in a census block does not necessarily reflect the number of choices available to any particular household or business location in that block, and the number of such providers in the census block does not purport to measure competition.”
Because providers need not serve all households in a census block in order to report to the FCC that they serve the block, the Form 477 data overstates the number of providers available to any household in that block. A recent econometric analysis estimated that the Form 477 data overcount American households with broadband service by about four million, or 3.5 percent of all US households as of 2017. Further, these overcounts are concentrated in rural counties.39Ford, “Quantifying.” While the overestimation of the number of distinct providers serving households in census blocks biases our competition measures, we believe that the number of providers reporting service in any given part of a census block can be reasonably expected to closely approximate the number of providers and broadband services available to each household in that census block, particularly in urban areas. Further study of the reliability of Form 477 data would be beneficial.
Additionally, we separately count aDSL operators and fiber operators when estimating the number of distinct operators in a census block. To the extent that aDSL and fiber service are managed under shared ownership, our data and results may overstate the level of broadband competition in census blocks. However, previous research finds meaningful competition between separately owned incumbent aDSL providers, such as AT&T’s U-verse DSL broadband, and competing fiber operators, such as Verizon’s FIOS fiber broadband.40Prieger, Savage, and Molnar, “Quality Competition,” 21.
Further, this analysis focuses on competition among a subset of broadband operators—namely, fixed-wire- line operators. A comprehensive review of the state of broadband competition among fixed-wireline, fixed-wireless, cellular, and other broadband operators in the United States is beyond the scope of this paper. This focus serves our goal of analyzing the economic relationship between fixed-wireline broadband entry and the quality of service of incumbents. However, this analysis of competition among fixed-wire- line providers should not be interpreted as an exhaustive analysis of the state of broadband competition; among other things, our analysis purposefully excludes satellite and other wireless broadband services, which, for analysis of consumer welfare and market power, are relevant alternatives. In light of these alternatives, our results likely understate the total number of options consumers have for broadband services.41For example, the FCC finds that, as of December 2016, 93.3 percent of the total US population was covered by four or more wireless service providers. See Federal Communications Commission, “Competitive Market Conditions With Respect to Mobile Wireless,” 52, chart III.D.1.
While our analysis does not allow for clear causal claims to be made, we believe our results can inform future research on this topic. Our analysis of statistical relationships between broadband service quality and competition is limited to the direct mode of competition, in which multiple providers serve the same census block. However, spatial econometric methods might be able to investigate the effects of indirect competition—that is, the threat of market entry. While our results reject the hypothesis that the actual entry of gigabit fiber providers into cable-served blocks prompted DOCSIS 3.1 upgrades, we leave un-tested and unanswered questions regarding market contestability in broadband.42Consideration of the relationship between the threat of market entry by a neighboring rival and the market-entry decisions of a broadband provider is offered in Wilson, Xiao, and Orazem, “Entry Threat,” and Flamm and Varas, “Quality Competition.” In addition, our analysis does not consider the effects of competition from wireless operators. Entry by wireless operators has been found to predict significant increases in wireline speeds, so future research could estimate the relationship between wireless entry and DOCSIS 3.1 upgrades. Observational service-quality data, rather than the survey-based estimates provided by Form 477, would also allow for replication of this study with more reliable results. Finally, improved broadband pricing data would allow researchers to evaluate the effects that broadband competition has on the pricing behavior of incumbents, who, according to our results, may be limited in their ability to upgrade service quality.
7. Conclusion
This paper analyzed broadband service quality in the forty-eight contiguous states and Washington, DC, when aDSL and cable incumbents share the market with a fiber competitor. Among fixed-wireline providers, interplatform competition at the census-block level grew between 2014 and 2018 but remains
low. In addition, we found rapid growth in gigabit fiber services in the United States. However, while fiber operators have entered an increased share of census blocks served by aDSL and cable incumbents, the median number of fiber operators in aDSL- and cable-served blocks equals zero. Further, we found no or limited evidence that the presence of a fiber provider, gigabit or otherwise, is correlated with faster cable or aDSL speeds. In fact, we found a negative correlation between cable download speeds and the presence of a gigabit fiber provider in a cable service plan’s census block. While we do find a statistically significant, positive relationship between cable speeds and non-gigabit fiber competition, this mode of competition predicts, at best, only a small share of the observed significant gains in cable speeds between 2014 and 2018. Meanwhile, the presence of a gigabit fiber rival in an aDSL-served census block predicts no more than an increase of a few megabits per second in aDSL download speeds, and the presence of a non-giga-bit fiber operator predicts significant decreases in aDSL download speeds. Our results indicate that the in-creases in fixed-broadband download speeds from both aDSL and cable providers between 2014 and 2018 are likely not attributable to actual market entry by rival fiber wireline operators.
Appendix
Table A-1. Federal Communications Commission (FCC) Form 477 Data Description 43Federal Communications Commission, “Explanation.”
Table A-2.1. Interplatform-Competition Counts and Frequencies for Census Blocks Served by One or More aDSL Providers, by Year-Month
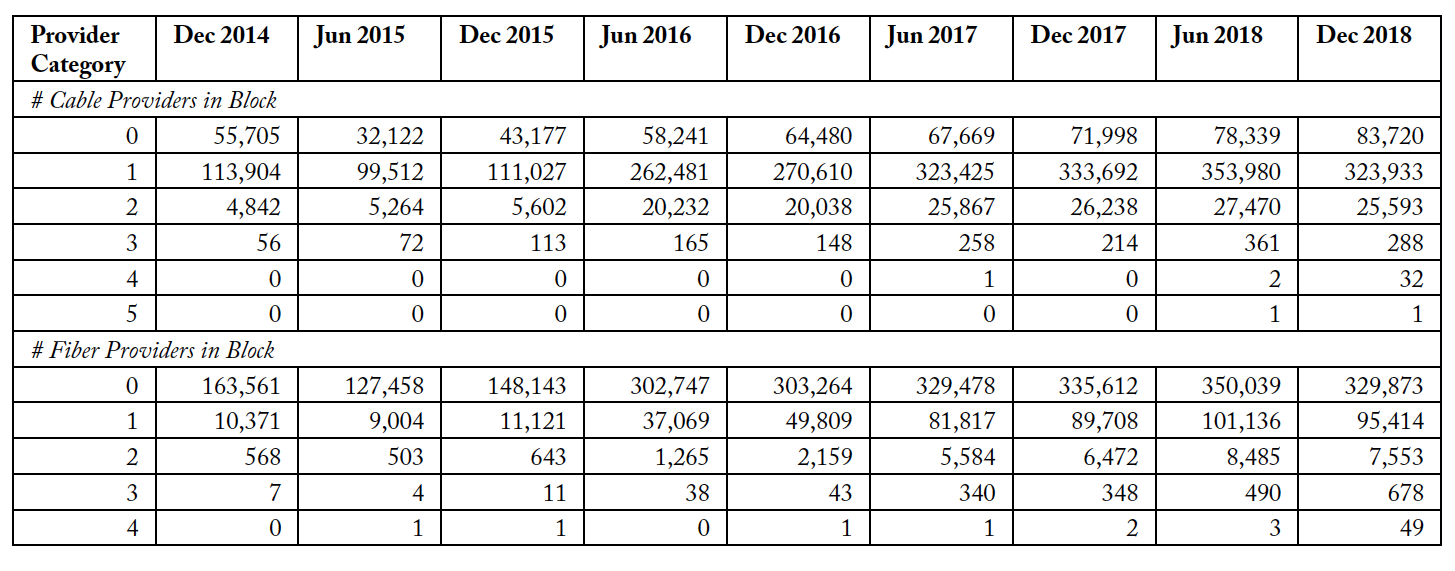
Table A-2.2. Interplatform-Competition Counts and Frequencies for Census Blocks Served by One or More Cable Providers, by Year-Month
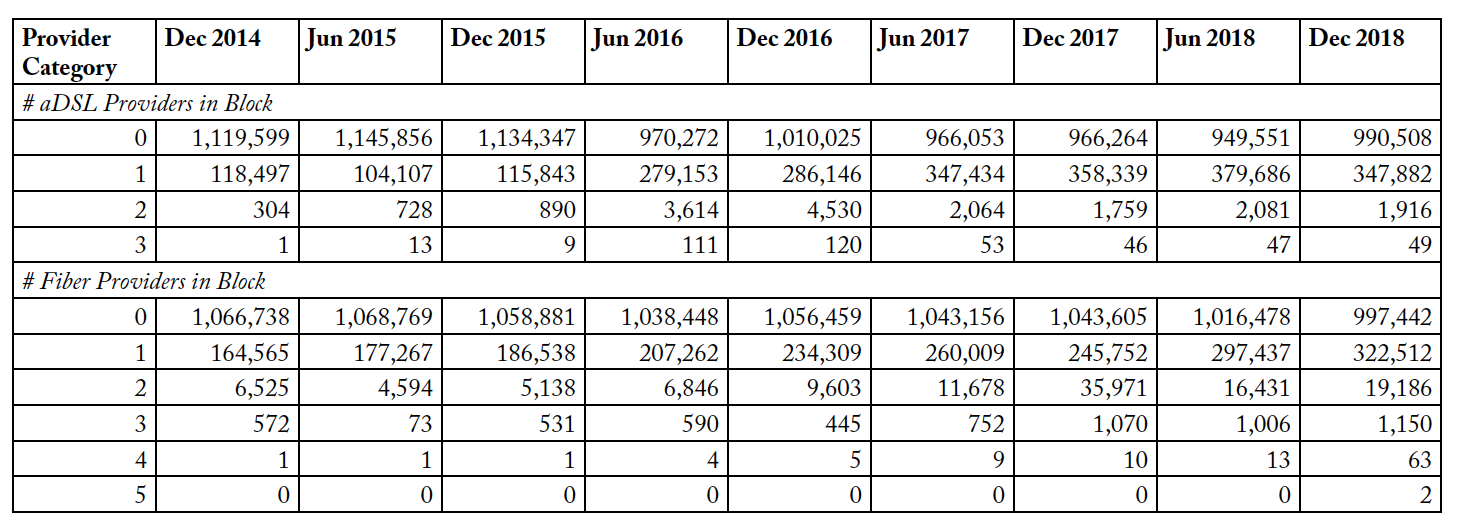
Table A-3. Summary of Housing Density and Population Density (Units per Square Kilometer) in Sampled Census Blocks
Table A-4.1. Cable-Regression-Sample Summary Statistics, Continuous
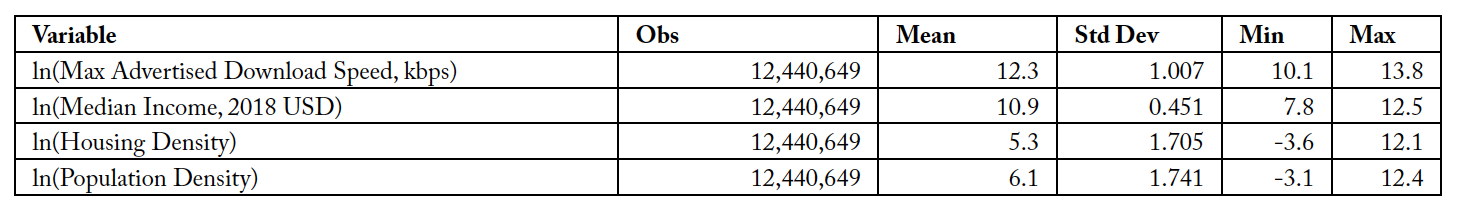
Table A-4.2. Cable-Regression-Sample Summary Statistics, Dummies
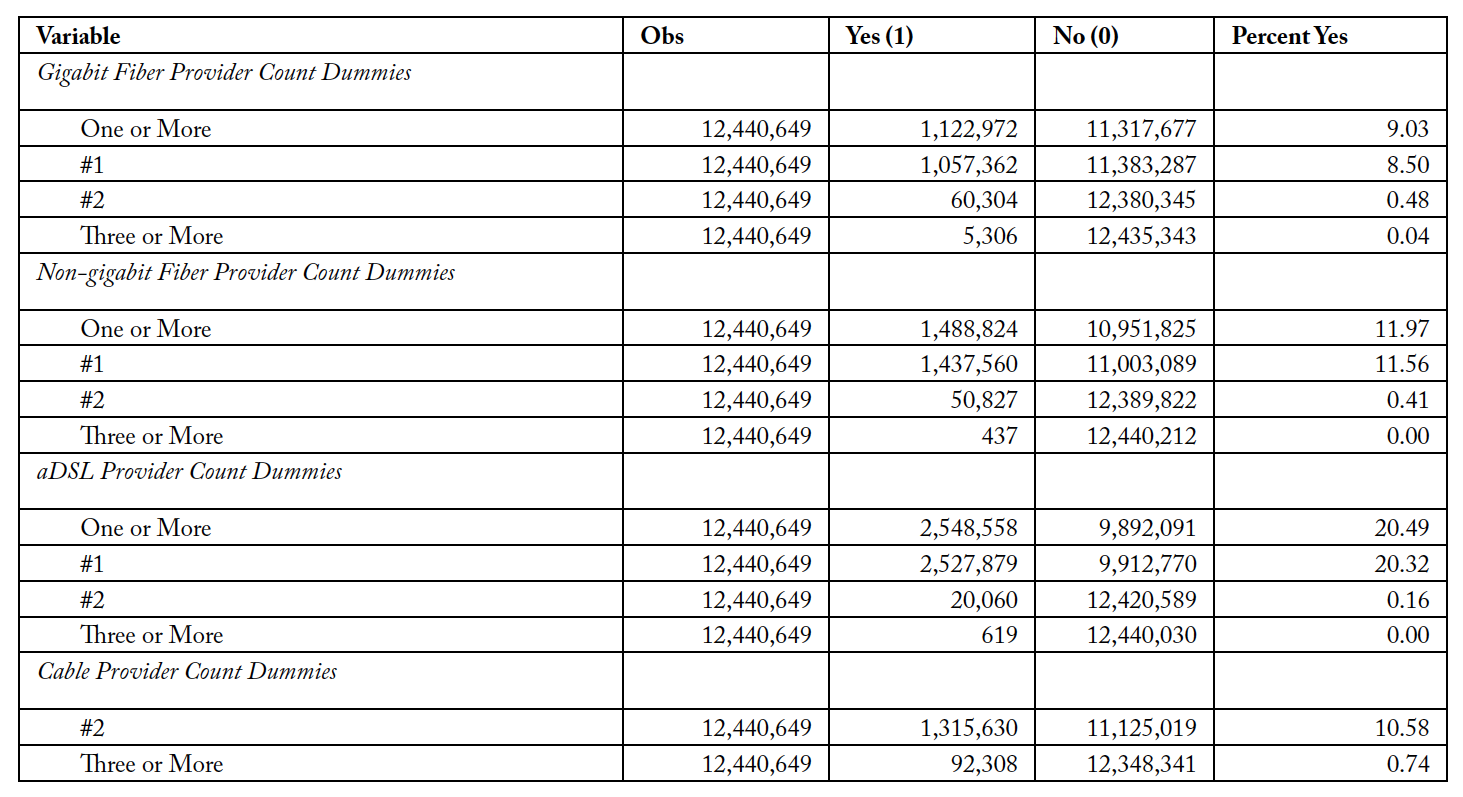
Table A-5.1. aDSL-Regression-Sample Summary Statistics, Continuous
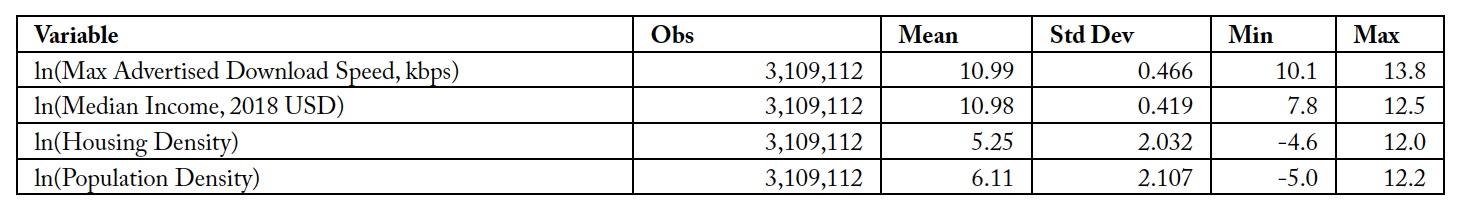
Table A-5.2. aDSL-Regression-Sample Summary Statistics, Dummies
References
Aron, Debra J., and David E. Burnstein. “Broadband Adoption in the United States: An Empirical Analy- sis.” In Down to the Wire: Studies in the Diffusion and Regulation of Telecommunications Technologies, edited by Allan L. Shampine, 119–38. New York: Nova Science Publishers, 2003.
Bresnahan, Timothy F., and Peter C. Reiss. “Entry and Competition in Concentrated Markets.” Journal of Political Economy 99, no. 5 (October 1991): 977–1009.
Chen, Yongmin, and Michael H. Riordan. “Price-Increasing Competition.” RAND Journal of Economics 39, no. 4 (Winter 2008): 1042–58.
Chen, Yongmin, and Scott J. Savage. “The Effects of Competition on the Price for Cable Modem Internet Access,” Review of Economics and Statistics 93, no. 1 (February 2011): 201–17.
Distaso, Walter, Paolo Lupi, and Fabio M. Manenti. “Platform Competition and Broadband Uptake: Theory and Empirical Evidence from the European Union.” Information Economics and Policy 18, no. 1 (March 2006): 87–106.
Dorfman, Robert, and Peter O. Steiner. “Optimal Advertising and Optimal Quality.” American Economic Review 44, no. 5 (December 1954): 826–36.
Federal Communications Commission. “Explanation of Broadband Deployment Data.” Updated March 12, 2020. Accessed November 9, 2020. https://www.fcc.gov/general/explanation-broadband-deployment-data.
Federal Communications Commission. “Fixed Broadband Deployment Data from FCC Form 477.” Up- dated October 6, 2020. Accessed November 9, 2020. https://www.fcc.gov/general/broadband-deployment-data-fcc-form-477.
Federal Communications Commission. “In the Matter of Implementation of Section 6002(b) of the Omnibus Budget Reconciliation Act of 1993; Annual Report and Analysis of Competitive Mar- ket Conditions With Respect to Mobile Wireless, Including Commercial Mobile Services, WT Docket No. 17–69.” September 2017. https://docs.fcc.gov/public/attachments/FCC-17-126A1.pdf.
Federal Communications Commission. “In the Matter of Inquiry concerning the Deployment of Advanced Telecommunications Capability to All Americans in a Reasonable and Timely Fashion, and Possible Steps to Accelerate Such Deployment Pursuant to Section 706 of the Telecommunications Act of 1996, as Amended by the Broadband Data Improvement Act, GN Docket No. 14–126.” February 2015. https://docs.fcc.gov/public/attachments/FCC-15–10A1.pdf.
Federal Communications Commission. “Universal Service.” Updated November 6, 2020. Accessed No- vember 10, 2020. https://www.fcc.gov/general/universal-service.
Flamm, Kenneth, and Anindya Chaudhuri. “An Analysis of the Determinants of Broadband Access.” Telecommunications Policy 31, no. 6–7 ( July–August 2007): 312–26.
Flamm, Kenneth, and Pablo Varas. “Quality Competition at the Competitive Margin in US Residential Broadband Markets.” Paper presented at 2019 TPRC/47th Research Conference on Communi- cation, Information and Internet Policy, Washington, DC, September 2019. Accessed November 9, 2020. https://ssrn.com/abstract=3427582.
Ford, George S. “Quantifying the Overstatement in Broadband Availability from the Form 477 Data: An Econometric Approach.” Washington, DC: Phoenix Center for Advanced Legal & Economic Public Policy Studies, 2019. Accessed November 9, 2020. http://phoenix-center.org/perspectives/Perspective19–03Final.pdf.
Greenstein, Shane, and Michael Mazzeo. “The Role of Differentiation Strategy in Local Telecommunication Entry and Market Evolution: 1999–2002.” Journal of Industrial Economics 54, no. 3 (Septem- ber 2006): 323–50.
Molnar, Gabor, and Scott J. Savage. “Market Structure and Broadband Internet Quality.” Journal of Industrial Economics 65, no. 1 (March 2017): 73–104.
Pew Charitable Trusts. “State Broadband Policy Explorer.” July 31, 2019. Accessed November 19, 2020. https://www.pewtrusts.org/en/research-and-analysis/data-visualizations/2019/state-broadband-policy-explorer.
Prieger, James E. “The Supply Side of the Digital Divide: Is There Equal Availability in the Broadband Internet Access Market?” Economic Inquiry 41, no. 3 (April 2003): 346–63.
Prieger, James E., Gabor Molnar, and Scott J. Savage. “Quality Competition in the Broadband Service Provision Industry.” Paper presented at 2014 TPRC/42nd Research Conference on Communica- tion, Information and Internet Policy, Arlington, VA, September 2014. Accessed November 19, 2020. https://papers.ssrn.com/sol3/papers.cfm?abstract_id=2418676.
Shaked, Avner, and John Sutton. “Relaxing Price Competition through Product Differentiation.” Review of Economic Studies 49, no. 1 ( January 1982): 3–13.
Trogdon, Holly. “Lessons from Google Fiber: Why Coordinated Cost Reductions to Infrastructure Ac- cess Are Necessary to Achieve Universal Broadband Deployment.” Federal Communications Law Journal 66, no. 1 (December 2013): 103–38.
US Bureau of Labor Statistics. “Consumer Price Index for All Urban Consumers: All Items in U.S. City Average.” Accessed November 10, 2020. https://fred.stlouisfed.org/series/CPIAUCSL, November 9, 2020.
US Census Bureau. “American Community Survey 5-Year Estimates Detailed Tables: Table B01003, Total Population.” Suitland, MD: US Census Bureau, 2014–2018.
US Census Bureau. “American Community Survey 5-Year Estimates Detailed Tables: Table B25001, Housing Units.” Suitland, MD: US Census Bureau, 2014–2018.
US Census Bureau. “American Community Survey 5-Year Estimates Detailed Tables: Table S1903, Medi- an Income in the Past 12 Months.” Suitland, MD: US Census Bureau, 2014–2018.
US Census Bureau. “TIGER/Line Shapefiles.” Accessed November 9, 2020. https://www.census.gov/cgibin/geo/shapefiles/index.php.
US Department of Agriculture. “ReConnect Loan and Grant Program.” Accessed November 10, 2020. https://www.usda.gov/reconnect.
Wallsten, Scott, and Colleen Mallahan. “Residential Broadband Competition in the United States.” In The Economics of Digitization, edited by Shane Greenstein, Avi Goldfarb, and Catherine Tucker, 158–93. Northampton, MA: Edward Elgar Publishing, 2013.
Whitacre, Brian, and Roberto Gallardo. “State Broadband Policy: Impacts on Availability.” Telecommuni- cations Policy 44, no. 9 (October 2020): 10205.
Wilson, Kyle. “Local Competition, Multimarket Contact, and Product Quality: Evidence from Internet Service Provision.” Unpublished manuscript, March 13, 2019. Accessed November 9, 2020. https://drive.google.com/file/d/1HGElc-eWT5jo6KLAuxZCev9BvIhFZDph/view?usp=sharing.
Wilson, Kyle, Mo Xiao, and Peter F. Orazem. “Entry Threat, Entry Delay, and Internet Speed: The Timing of the U.S. Broadband Rollout.” Unpublished manuscript, October 27, 2020. Accessed November 9, 2020. http://www.u.arizona.edu/%7Emxiao/research/WXO_entrydelay.pdf.
Xiao, Mo, and Peter F. Orazem. “Does the Fourth Entrant Make Any Difference? Entry and Competition in the Early U.S. Broadband Market.” International Journal of Industrial Organization 29, no. 5 (September 2011): 547–61.