
 National Bureau of Economic Research
1. Introduction
Personal investing has become commonplace in modern society, but even as late as World War I (1914-1918), a small proportion of the U.S. population held any securities. While shareholding was growing slowly before the war, the post-war period saw an explosion of investment. Conservative estimates show the total number of individuals owning corporate stock in the United States grew from less than one million in 1910 to more than 10 million by the early 1930s.1No comprehensive data on corporate shareholding exists for this period and definitive counts of total numbers of shareholders should be treated with skepticism, as they are generally unsubstantiated. Several scholars, including Warshow (1924), Means (1930), Berle and Means (1932), and Bernheim and Schneider (1935), have produced reasonable estimates of the total number of shareholdings (stakes held in companies) from samples of public corporations. Rutterford and Sotiroupolos (2017) estimate the total number of shareholders from those numbers. Their calculations suggest that there were 0.81 million shareholders in the United States in 1907, and 10 to 12 million in 1932. This massive rise in middle-class investing was responsible for the deepening of U.S. securities markets, the spread of investment banks, the increase in the scale of corporations, and the further transition to manager-run businesses. Many scholars (e.g., Friend et al. 1958, 1967; Carosso 1970, 1979; Calomiris 1995, 2002; Baskin and Miranti 1997; Calomiris and Raff 1995) have argued that the period was the dawn of a new age in investing; however, the lack of micro-level data has prevented the study of who purchased bank securities or how the rise affected the operation of banks. Building on the literature, this paper makes use of biennial stockholder lists for all state-regulated banks in South Dakota from 1910 through 1934 to examine the pattern and effect of stockholding during this turning point in the development of American securities markets.
In their book, The Modern Corporation and Private Property, Berle and Means (1932) highlight what they see as the unsettling switch from historical firms where concentrated stockholding incentivized ownership control to the modern corporations where diffuse stockholding freed managers to pursue their personal interests rather than firm value. While many historical firms had diffuse stockholding (Hilt 2008) and many large modern corporations have concentrated owners, the study nevertheless spurred the study of how stockholder concentration influences firm operation. Larger stockholders often are the only ones to have a sufficient stake to justify paying the costs of monitoring management and operational decisions (Shleifer and Vishny 1986). Therefore, as the number of stockholders increase and the concentration of ownership decreases, the oversight on management often declines as small, uninformed, or distracted investors choose not to invest the time to monitor or lack the power to enforce needed changes (Roe 1994; Yafeh and Yosha 2003, Kempf, Manconi, and Spalt 2017). This greater control and monitoring by large shareholders, however, is not always linked to safer firms. For instance, Saunders, Strock and Travlos (1990), Faccio et al. (2003), and Laeven and Levine (2009) find that greater control by large shareholders can be associated with higher risk-taking as managers are pushed to maximize stockholder value.2 See for instance, the detailed survey of the benefits and costs of large stockholders in Shleifer and Vishny (1997).
While the corporate finance literature studies firms in all different industries, the effect of stockholding on historical banks could differ from modern results for a variety of reasons. First, Lamoreaux (1994) and Lamoreaux and Glaisek (1991) find that New England banks often made loans almost exclusively to directors and large stockholders. The authors argue that this approach might have been efficient as the bank was better informed about those individuals’ business prospects. Second, bank stockholders often were subject to additional liability on their equity holdings. This additional liability required that all bank shareholders would have to pay in an amount proportional to the par value of their shares in the event of bank failure. This could have pushed large stockholders to take a more active role in monitoring risk-taking.
Despite the importance of the period, the lack of information on individual stockholders has largely prevented any detailed panel study of stockholding over the early 1900s. Bodenhorn (2013, 2014) examines stockholding and corporate governance of banks over a much broader period of time, but neither study contains many observations during the 1910s and 1920s. Warshow (1924) and Means (1930) study stockholder growth in a sample of established non-bank companies over the early 1900s, arguing that the large-scale financing needs and tax policies during World War I (WWI) drove firms to search out new middle class investors. Highlighting the specific effect of the WWI liberty bond drives on securities ownership, Hilt, Jaremski, and Rahn (2020) show that individuals residing in states with higher liberty bond subscription rates were more likely to own stocks and bonds in the late 1930s. Calomiris and Oh (2019) provide the one examination of individual stockholders using private data on Citibank from 1925-1929. They find that the number of stockholders in Citibank tripled over the four years with many of the new purchasers being either connected to the bank through business relationships or living near a branch of the bank.
The effect of the rise in stockholding on bank operations in the period has likewise gone unstudied, but several papers have been written on the connection between stockholding and bank operations in other historical periods. Bodenhorn (2013) has shown that banks with large block shareholders had higher value and made fewer loans, while Bodenhorn (2014) finds that banks with more stockholders held larger capital barriers. In this way, while some of the results match those from the modern period, there is no clear effect of whether more stockholders would have led to additional risk-taking or expansion during the period.
This paper builds on the literature by studying a unique source of stockholder information for the key historical period. Starting in 1910, South Dakota biennially reported the stockholder list and balance sheet of each bank under its supervision. The lists contain the name of each stockholder, their current location, and the par value of the amount of stock they owned. The data allow for the study of the number and characteristics of stockholders in each year as well as the impact of new stockholders on bank balance sheets and stability. Containing information on over 750 banks and 20,000 unique stockholders from 1910 through 1934, the analysis can remove fixed bank characteristics that might have driven initial stockholding separate from those factors that increased stockholding over time.
The drawback of the data is that they only exist for one state. While South Dakota was an agricultural state representative of the Midwest and Great Plains, it is not immediately comparable to the wealthier manufacturing and financial centers elsewhere in the country where stockholding was more common. For instance, South Dakota banks had fewer stockholders on average than estimates from other locations. As such, the data provide a glimpse of the general dynamics of the expansion of stockholding in America. While they likely serve as a lower bound on its overall size across the nation, the analysis provides a clearer examination of the expansion of stockholding in small agricultural states were farming and credit for farmers was much more important.
The average number of stockholders per South Dakota bank nearly tripled between 1910 and 1934. And while there was a rise in stockholders after WWI, the biggest rise came after 1924. These new stockholders were more likely to be located near the bank and without a family connection to other stockholders. T he rise dilutes the power of the largest stockholder, but ownership remained relatively concentrated throughout the period. The patterns are similar for small and large banks as well as new and old banks, indicating that the rise was common across South Dakota. Matching stockholder information with balance sheet information, I find that the rise in the number of stockholders correlated with an increase in a bank’s fraction of loans but no change in leverage. The new stockholders thus might have brought additional capital into the bank, but the bank scaled up assets with loans to maintain the same capital buffer over time. Even controlling for a bank’s balance sheet composition, the rise in stockholders is associated with a higher probability of closure during the period.
2. Data
To shed light on the patterns of stockholding, I digitize the data reported in South Dakota’s Biennial Report of the Public Examiner (1910-1918) and the Biennial Report of the Superintendent of Banks (1920-1938). The reports provide each state bank’s balance sheet as well as a list of the names, current locations, and stock holdings of its stockholders every two years.3As was common until the modern period, the reports do not contain information on non-performing loans, interest rates, dividends, or income. The state report also contains no information on the stockholders of national banks as national banks were subject to oversight by the Comptroller of the Currency rather than the state superintendent. I augment the bank and stockholder data using county-level census information from Haines (2004).4I aggregate counties to their 1910 boundaries to have consistent county definitions over time. Values in between each Census observation are filled with a linear trend. These data help control for various location-specific characteristics that may have influenced banking and stockholding.
3. Rise in Stockholding
The South Dakota data shed light on two main sets of questions. First, when and how did the rise in stockholding occur? Second, did the rise in stockholding affect the behavior of banks? This section addresses both these questions.
3.1 Timing and Characteristics of Rise in Stockholding
The data allow for the calculation of several measures of stockholding. I start by examining the number of stockholders per bank.5Similar patterns are found when using the median or dropping the few banks with several hundred stockholders. The top panel of Figure 1 shows the unweighted average number of stockholders per bank rose from 8.0 in 1910 to 21.8 in 1934. Most of this rise occurs after 1924, but there is also a slight rise after WWI. The pattern is not driven by bank entry or exit as the results are similar for those banks that survived from 1910 through 1928.
The distributions of the number of stockholders per bank in the bottom panel of Figure 1 show that the average increase in stockholders over time is not a result of large changes at a few banks. About 13.8 percent of banks had three or fewer stockholders in 1910, compared to 0.9 percent in 1920, and 0.4 percent in 1930. Moreover, the percent of banks with 35 or more stockholders rose from 1.0 percent in 1910 to 2.4 percent in 1920 and 14.0 percent in 1930. Therefore, most banks experienced a rise in stockholders over the 1910s and a much larger rise over the 1920s.
Figure 2 sheds light on who the new investors were by calculating the average fraction of stockholders that lived fewer than 15 miles away from the bank in the top panel and the average fraction of stockholders that had the same last name (i.e., those likely to be in the same family) in the bottom panel.6The rise in stockholders was primarily driven by those located in the town itself. Therefore, the exact mileage cutoff does not play a large role. In each case, I calculate the unweighted average with and without banks that had three or fewer stockholders because the proportions for these banks display large swings due to even a single stockholder change. The top panel shows a rapid increase in the fraction of local owners after 1924. The bottom panel shows the fraction of stockholders in a bank sharing the same last name was steadily decreasing over time, but much of the decline between 1910 and 1918 was driven by the handful of banks with three or fewer stockholders. The stockholder boom of the 1920s was thus driven by local individuals that were not already connected to the bank through their family.
I next examine the concentration of bank ownership in Figure 3 using three measures: (1) the fraction of stock owned by the largest stockholder, (2) the fraction of stock owned by directors of the bank, and (3) the Herfindahl-Hirschman Index (HHI). Each measure provides a slightly different view on control of the bank. However, based on all three measures, the concentration of ownership declined for most of the period, but the decline occurred most strongly after 1924. On average, between 1910 and 1934, the fraction of stock owned by the largest stockholder dropped from 41.9% to 36.8%, the fraction of stock owned by the directors of the bank dropped from 79.6% to 62.0%, and HHI dropped from 30.5% to 24.2%. Therefore, the new stockholders diluted concentration, but the ownership of many banks remained in the hands of a few.
The patterns in Figures 1 through 3 also exist across the various sizes of banks. Seen in Figure 4, banks in the top half of capital size as well as those in the bottom half display a small rise in local, non-family stockholders after the liberty bond drives and a much larger rise after 1924. Therefore, while larger banks had more local stockholders and less concentrated ownership in general, they display the same pattern in stockholder behavior over time as smaller banks.
The timing of the shift and the lack of strong cross-sectional differences in South Dakota makes it hard to pin down the specific reason for the sudden uptick in stockholding. Specifically, 1924 marks the end of the agricultural depression that followed WWI. During the late-1910s, the war led to a dramatic increase in crop prices throughout the United States. Banks expanded and often invested in the agriculture boom by increasing their lending to farmers and land owners ( Jaremski and Wheelock 2020). However, when the war ended, crop prices quickly fell back to their pre-war level, leading to bank failures and agricultural distress in most states. South Dakota’s losses even bankrupted the state’s deposit insurance system (Calomiris and Jaremski 2016).7Calomiris and Jaremski (2019), for instance, show that insured state banks in South Dakota expanded and took on higher risk profiles during the late-1920s. The specific timing of the rise, therefore, could be the result of surviving banks pursuing new injections of capital, existing undiversified owners reducing their exposure without the protection of deposit insurance, farmers seeking to establish a connection to banks for lending, or the rebound of disposable income spurring investment demand. More generally, stock prices had begun to accelerate and other market rates of interest across the country were also starting to rise during the mid-1920s, potentially pulling more investors into the market.
3.2 Effect of Rise in Stockholding on Bank Composition
The data show a dramatic rise in the number of stockholders per bank over the period, but did it alter the behavior of banks? As highlighted in the introduction, large stockholders likely had a vested interest in spending the time to watch over and protect their investment, compared to smaller and potentially uninformed investors. I, therefore, next examine the effect of stockholding on bank balance sheets using a Panel Vector Autoregression (PVAR). The approach is important as the characteristics of a bank could have attracted more stockholders just as more stockholders could have influenced a bank’s characteristics.The PVAR provides benefits of two different types of analysis. The VAR methodology enters the variables into a system of equations as endogenous, enabling the estimation of the bi-directional relationships between them, while the panel methodology controls for unobserved heterogeneity across banks and across time using bank and time-fixed effects. The identifying variation thus comes from changes over time at the bank level, and the first two lags of each variable are used as instruments to obtain more reliable results (Holtz-Eakin, Newey, and Rosen 1988).
I focus on the most important observable aspects of the bank’s balance sheets. First, I examine a bank’s size using the logarithm of its assets. Second, I examine a bank’s risk and illiquidity using its ratio of loans to assets. Third, I examine a bank’s buffer against losses using its ratio of capital and surplus to assets. Estimated using a generalized method of moments (GMM) framework8GMM helps avoid concerns of a Nickell bias (1981) due to the length of the sample period relative to the cross-section., the series of equations is:
(1) 
where  is the vector of endogenous variables (the logarithm of the number of stockholders, the logarithm of bank assets, the ratio of loans to assets, and the ratio of capital and surplus to assets),
  is a set of lags for each of the dependent variables,
  is a vector of time-fixed effects that capture common, year-specific shocks across all banks,
  is a vector of bank-specific fixed-effects that capture any unobserved, time-invariant bank characteristics, and
  is a robust error term. Bank-fixed effects are removed using forward orthogonal deviation (the Helmert procedure) and time-fixed effects are removed by subtracting each variable’s cross-sectional means before estimation. I select one lag due to the limited number of biennial observations per bank but find similar results across additional lag specifications. I also confirm that the system satisfies the necessary stability conditions using a unit root test.
I estimate equation (1) using a balanced panel of banks from 1910 to 1928 to avoid the variation due to exiting and entering banks as well as other structural changes to investment markets during the Great Depression.9While unreported, the results of equation (1) are similar when extending the balance sample to 1930 or 1932. I display the results in two ways. First, Table 1 provides the estimated coefficients of equation (1) along with Granger Causality tests. Granger Causality tests display whether one variable can significantly improve the forecast of another variable over and above that variable’s own values. Second, Figure 5 displays the orthogonalized impulse response functions (IRFs) for equation (1).10The Cholesky ordering in the displayed figure is assets, loans to assets, capital to assets, and stockholders to reduce the effect of stockholders. However, because the model finds no significant effect from assets, loans, or capital to stockholders, ordering the number of stockholders higher does not significantly change the results. The IRFs display the effect of a one-time positive shock to the number of stockholders on the other variables in the system over time.
Table 1 shows that there is little bidirectionality across the system. The number of stockholders, the amount of assets, and the ratio of capital and surplus to assets are not Granger caused by any other variable. Only the loans-to-asset ratio is Granger caused by the number of stockholders and the amount of assets. On top of the use of lagged values as instruments, this lack of reverse Granger causation suggests there is an underlying relationship between the increase in stockholders and the rise in the loan to asset ratio. Nevertheless, the model should not be translated in stark causality terms without a source of completely exogenous stockholding behavior. Rather these tests suggest the direction and size of a relationship between the variables while explicitly accounting for much of the endogenous behavior, aggregate changes occurring across all banks, and constant differences across individual banks over time.
Figure 5 shows the impulse response of total assets, loans to assets, and capital and surplus to assets to a one standard deviation positive shock to the number of stockholders. I focus on these responses because they provide the cleanest approximation of what the model would predict to happen during the rise in stockholding in the 1920s. Matching the model’s coefficients and Granger Causality tests, the effect of a rise of stockholders on total assets and capital and surplus to assets is effectively zero, while its effect on loans to assets is positive, significant, and lasts over four biennial periods. Thus, the data suggest that the rise in local stockholders over the period increased the proportion of loans that banks were willing to provide but not necessarily the amount of assets or proportion of capital.
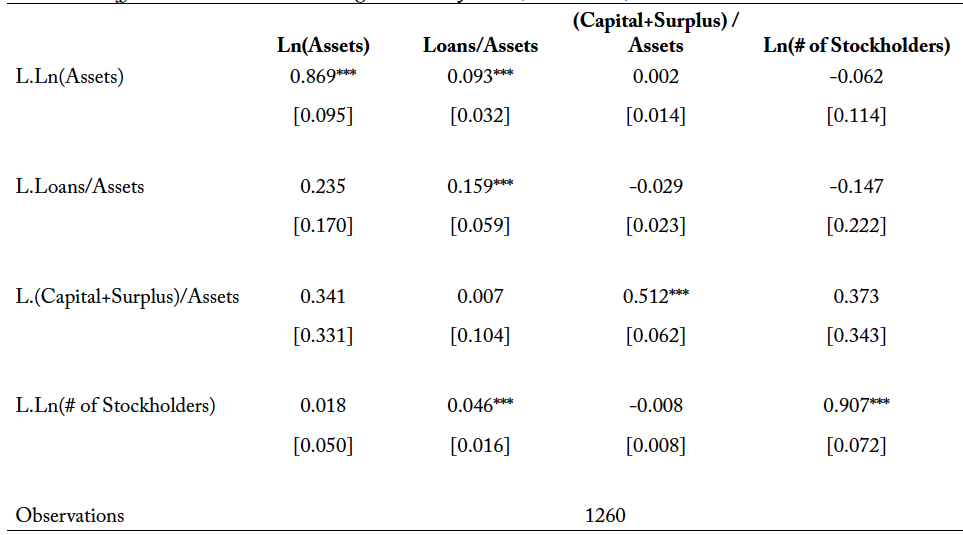
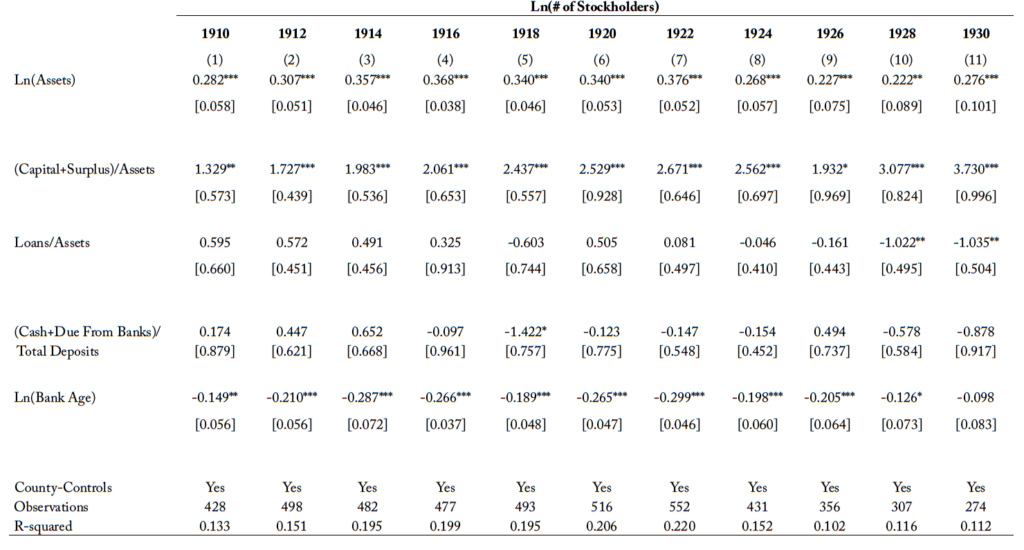
As highlighted by Wainright (1953), Lamoreaux (1994) and others, this relationship between stockholders and loans could be driven by historical banks favoring insiders for loans, but lacking information on loans to directors, I cannot directly test whether insider lending was responsible for the relationship.11Hilt (2008) also finds that large stockholders at many types of historical firms were utilizing their firm’s resources for their own benefit. The results match Bodenhorn (2013) who shows that banks with fewer large block shareholders made more loans, but not Bodenhorn (2014) who shows that banks with more stockholders had higher capital ratios. The lack of a positive correlation between the number of stockholders and the capital ratio, however, is the result of studying changes over time at individual banks rather than cross-sectional patterns across banks. In the cross-sectional results seen in Appendix Table 1, South Dakota banks show a strong positive correlation between the contemporaneous capital ratio and the number of stockholders. In this way, stockholders might have been initially attracted to banks with high capital ratios but the additional stockholders did not lead to a further rise in the capital ratio. The difference in results indicates why a panel is necessary to remove the fixed differences among banks over time.
3.3 Effect of Stockholding on Bank Stability
Having found that the rise in stockholding is correlated with an increase in a bank’s proportion of loans, the next question is whether it is also associated with a bank’s probability of closure. The expansion of stockholding could have had both an indirect and a direct effect on risk. First, as shown in the previous section, it led to a higher proportion of loans which could have indirectly led to a higher probability of closure. Second, less concentrated stockholding could lead to worse management and more risky investments even holding portfolio composition fixed. In this way, we need to test whether each balance sheet factor matter alongside the stockholding variables to examine both types of effects on risk-taking.
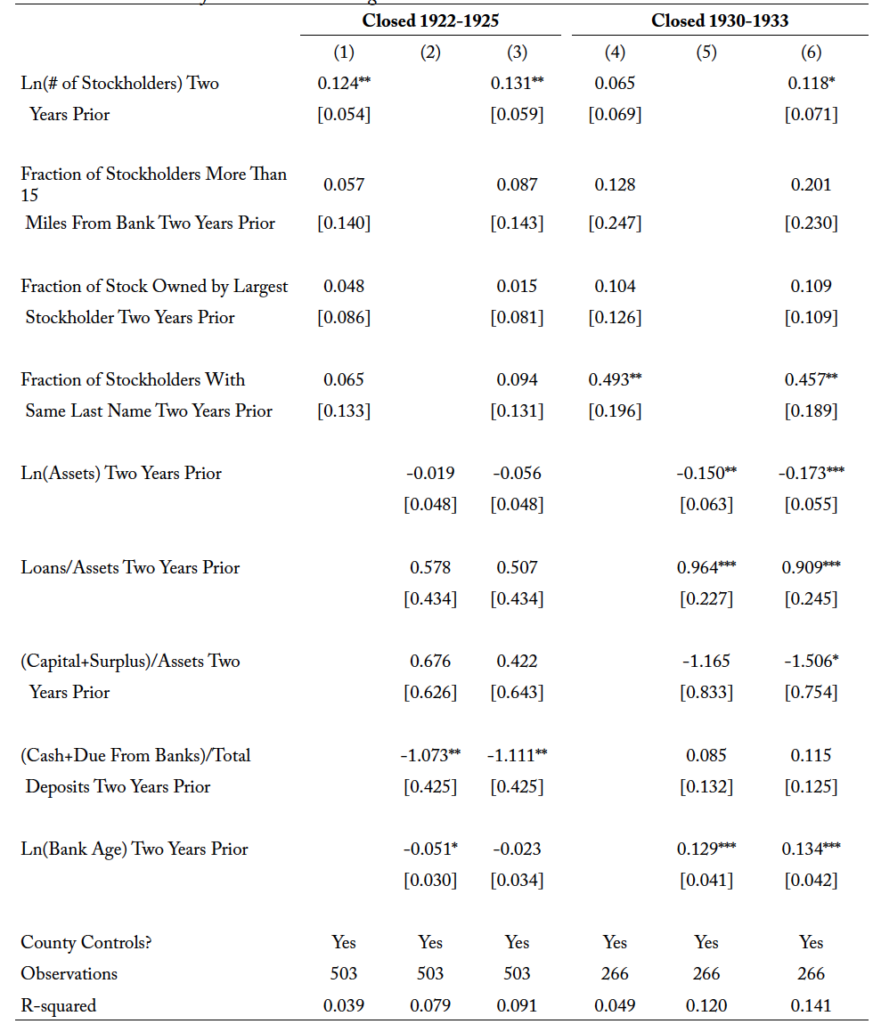
To shed light on the risk-taking of banks, I study the two large-scale closure waves in South Dakota where all banks were under pressure to determine whether banks with a higher number of shareholders were more likely to survive. The first stretches from 1922 to 1926 (consisting of 197 bank closures) as a result of the rapid decline of crop prices after WWI, and the second stretches from 1930 to 1934 (consisting of 135 bank closures) as a result of the Great Depression.
Similar to those estimated by others for the period (White 1984; Wheelock and Wilson 1995; Jaremski 2018; Jaremski and Wheelock 2020), I model closure as a function of various balance sheet measures intended to capture bank performance and risk. I examine the preferred portfolio distribution of each bank before the crisis using its composition two years before each closure wave (i.e., 1920 and 1928 respectively).12This approach avoids the mechanical changes that come as a bank starts to close (i.e., assets and cash declining as depositors withdraw their money). Estimated separately for each closure wave, the model is:
(2) 
where  is an indicator variable for whether bank
  closed during the specific panic period,
  is the logarithm of the number of stockholders in bank two years before the panic period,
  is a vector of balance sheet characteristics of bank two years before the panic period including the logarithm of assets, loans to assets, cash and due from banks to assets, capital and surplus to assets, and the logarithm of bank age,
  is a vector of county-specific census control variables for county
  two years before the panic period including the logarithm of the county’s population, the logarithm of the number of farms in the county, the fraction of farm acres planted in wheat, the fraction of the county that is non-white, and the fraction of the county that is illiterate, and
  is the error term is clustered by county.
Table 2 provides the estimated coefficients of equation (2).13The correlations between the number of stockholders and the balance sheet items are relatively low in both of the cross-sections. Nevertheless, Table 2 provides further evidence that the results are not driven by multicollinearity by estimating the model with just the balance sheet variables or just the stockholding variables. As might be expected, the results are stronger when more correlates are controlled for but there are no substantial swings in the sign or size of the variables in the fully specified model. The results indicate that banks with more stockholders were more likely to close during either of the two closure waves. The effect is positive and significant despite controlling for the bank’s balance sheet and location. The data further show that those banks that were closely held by the same family were more likely to close during the Great Depression, but the other concentration measures are statistically insignificant. This result provides additional evidence that the new stockholders might have given banks greater flexibility to take risk and made them more likely to close during widespread panics.
4. Conclusion
During the 1910s and 1920s, American securities markets exploded as a result of widespread investment. Scholars have long argued that this democratization was the dawn of a new age in investing, but the timing of the rise and its effect on bank risk-taking has never been analyzed systematically. Using unique bank-level data for South Dakota, I find that there was a substantial rise in the number of bank stockholders after 1924. The bulk of the rise came from local investors without a previous family connection to the bank. Further, I show that the rise in stockholders is correlated with an increase in banks’ loans to asset ratio and a higher probability of closure. The reduction in bank concentration, therefore, seemingly weakened the oversight of banks which empowered a higher proportion of loans to be issued and greater risk to be taken.
5. Appendix
Figure 1. Stockholding Patterns (1910-1934)
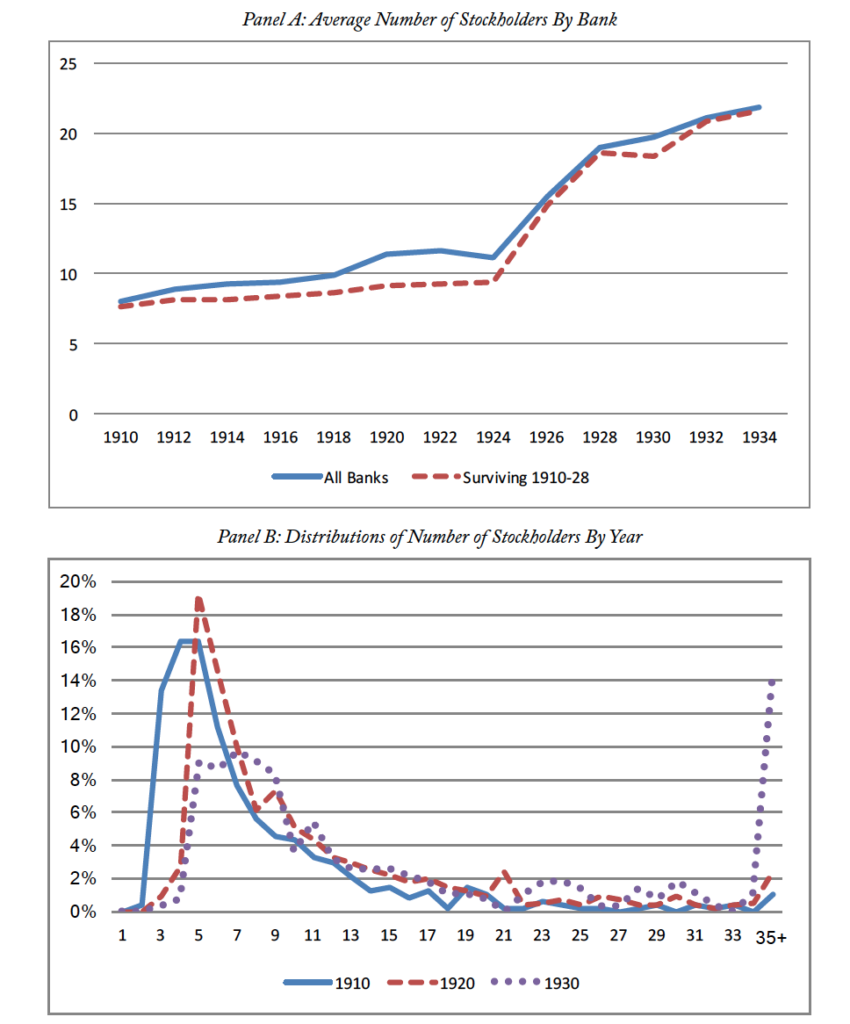
Notes: The top panel provides the unweighted average number of stockholders in South Dakota state banks each year. “All Banks” denotes all South Dakota banks, whereas “Surviving 1910-28” denotes a sample of banks that were present in each year from 1910 to 1928. The bottom panel provides the full distribution of the number of stockholders per bank in the specified years. The distributions are top coded at 30 for ease of viewing.
Figure 2. Characteristics of Stockholders (1910-1934)
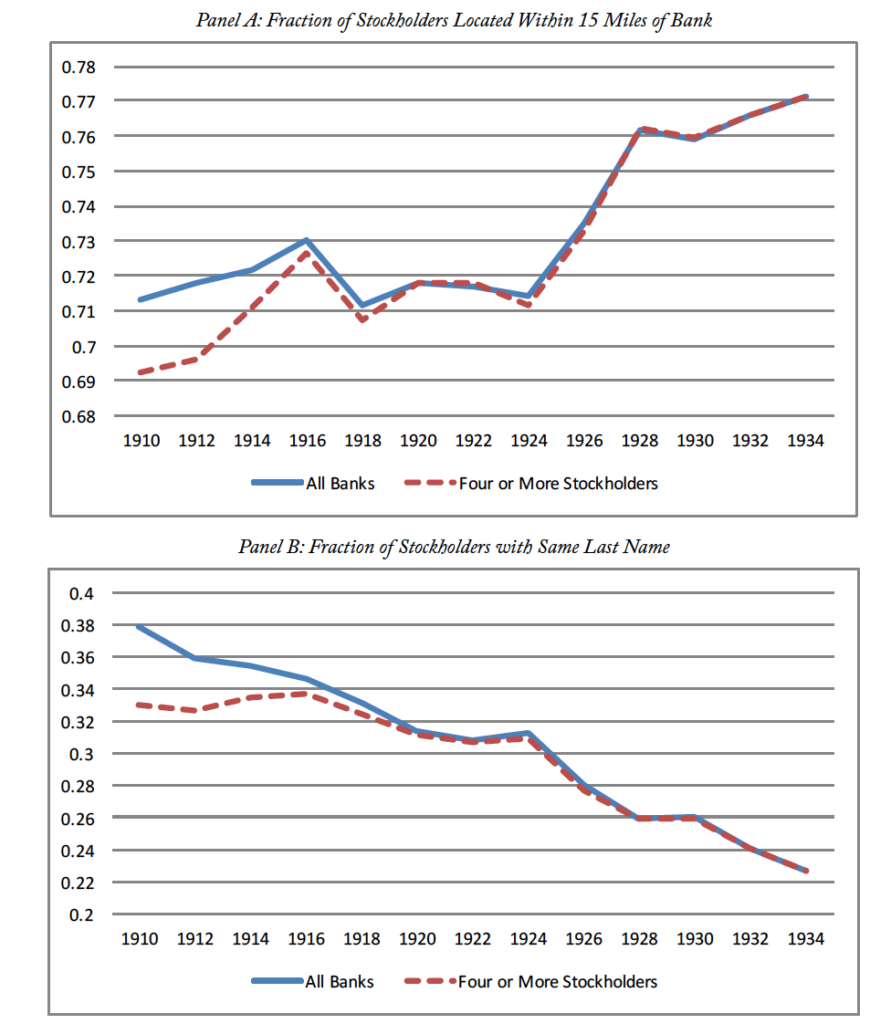
Notes: The top figure provides the unweighted average fraction of stockholders in a bank that were located within 15 miles of the bank’s location, whereas the bottom panel provides the unweighted average fraction of stockholders in a bank that had the same last name. “All Banks” denotes all South Dakota banks, whereas “Four or More Stockholders” denotes a sample of banks that had at four or more stockholders.
Figure 3. Measures of the Concentration of Bank Ownership (1910-1934)
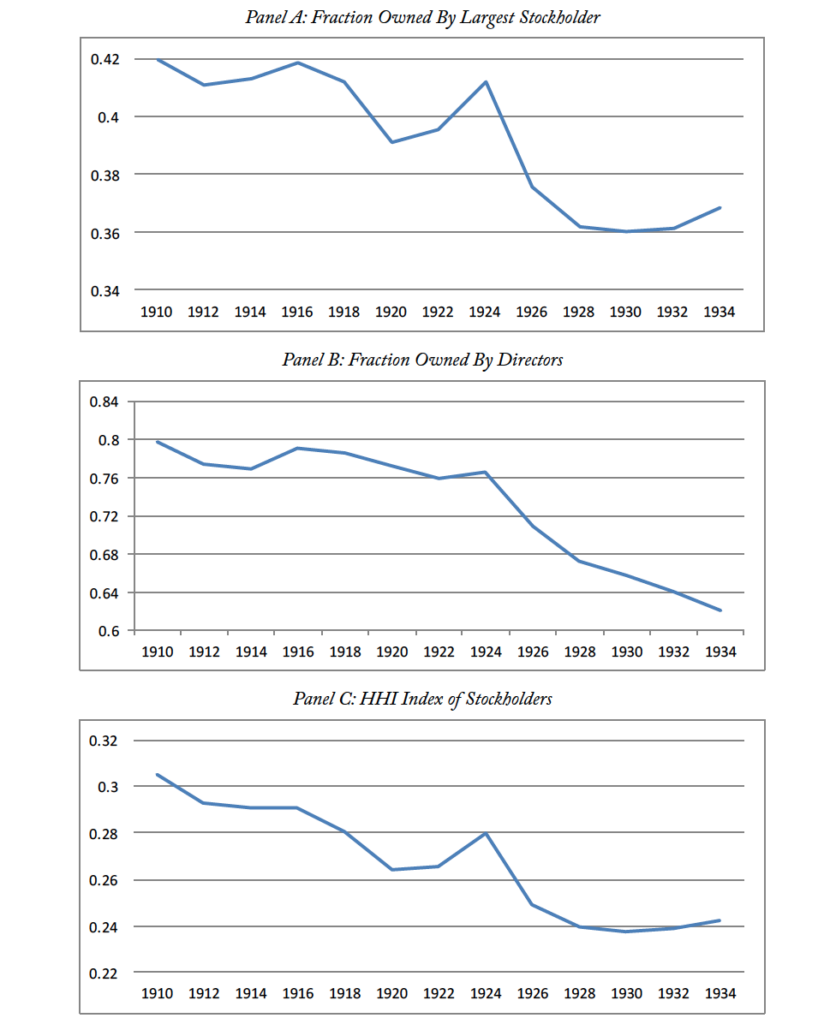
Notes: The figures provides the unweighted averages of each bank’s fraction of the value of stock owned by the largest stockholder, fraction of the value of stock owned by directors, and Herfindahl-Hirschman Index (HHI).
Figure 4. Separating Stockholder Patterns By Median Capital Stock (1910-1934)

Notes: Figures provide the specified measures split by whether the bank was in the top half of the capital distribution (i.e., “Large Capital”) or the bottom (i.e., “Small Capital”).
Figure 5. Impulse Response Functions To Positive Shock to Stockholders
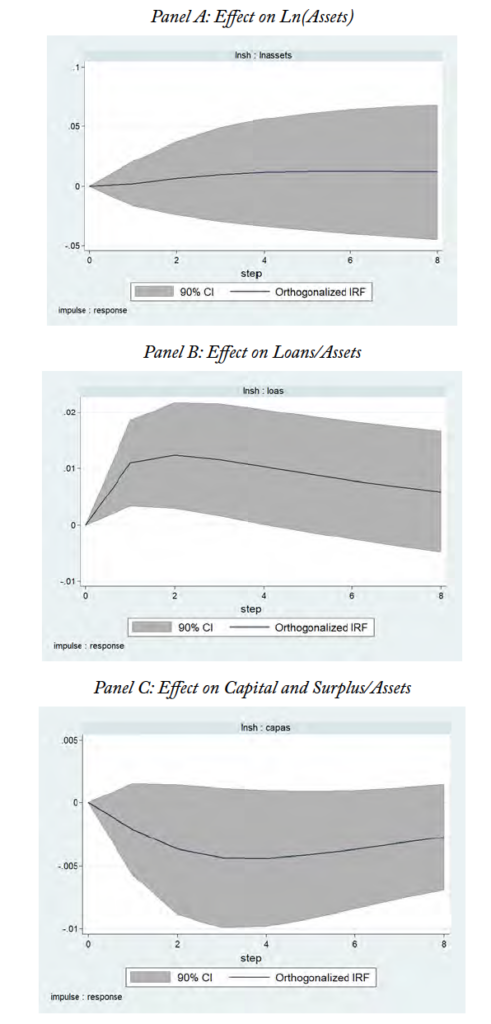
Notes: Figures provide the orthogonal impulse response functions to a positive shock to the number of stockholders within equation (1). The figures provide the estimated response plus a 90% confidence interval.
Table 1. Coefficients on PVAR and Granger Casuality Tests (1910-1928)
Notes: Table provides the estimated coefficients and standard errors from Granger Causality tests for equation (1). Each observation is a biennial observation of a bank. The sample contains those banks that survived from 1910 through 1928. Bank fixed effects are removed using a Helmert transformation, and time fixed effects are removed by subtracting each variable’s cross-sectional means before estimation. Two-lags of each variable are used as instruments. Robust standard errors are presented in parentheses below the coefficients. * denotes significance at 10%; ** at 5% level and *** at 1% levels.
Table 2. Determinants of Bank Closure During Closure Waves
Notes: Table provides the results of OLS regressions from equation (2). Each observation is a bank two years before the specified failure wave. “County Controls” includes the logarithm of the county’s population, the logarithm of the number of farms in the county, the fraction of the county that is non-white, the fraction of the county that is illiterate, and the fraction of acres planted in wheat. Robust standard errors clustered by county are presented in parentheses below the coefficients. * denotes significance at 10%; ** at 5% level and *** at 1% levels.
Table A1. Correlation Between Number of Stockholders and Bank Characteristics (1910-1930)
Notes: Table provides the results of OLS regressions. Each observation is a bank in the provided year. “County Controls” includes the logarithm of the county’s population, the logarithm of the number of farms in the county, the fraction of the county that is non-white, the fraction of the county that is illiterate, and the fraction of acres planted in wheat. Robust standard errors clustered by county are presented in parentheses below the coefficients. * denotes significance at 10%; ** at 5% level and *** at 1% levels.
References
Baskin, Jonathan Barron, and Paul J. Miranti. A History of Corporate Finance. Cambridge: Cambridge University Press, 1997.
Berle, Adolf A., and Gardiner C. Means. The Modern Corporation and Private Property. New York: Macmillan, 1932.
Bernheim, Alfred L. The Security Markets: Findings and Recommendations of a Special Staff of the Twentieth Century Fund. Edited by Margaret Grant Schneider. New York City: Twentieth Century Fund, 1935.
Bodenhorn, Howard. Large Block Shareholders, Institutional Investors, Boards of Directors and Bank Value in the Nineteenth Century. No. w18955. National Bureau of Economic Research, 2013.
Bodenhorn, Howard. “Voting Rights, Shareholdings, and Leverage at Nineteenth-Century US Banks.” The Journal of Law and Economics 57, no. 2 (2014): 431-458.
Carosso, Vincent Phillip. Investment Banking in America: a History. Cambridge, MA: Harvard University Press, 1970.
Carosso, Vincent Phillip. More than a Century of Investment Banking: The Kidder, Peabody & Co. Story. New York: McGraw-Hill, 1979.
Calomiris, Charles W. “The Costs of Rejecting Universal Banking: American Finance in the German Mirror, 1870-1914,” chap. 8 in Coordination and Information edited by Naomi R. Lamoreaux and Daniel M. G. Raff, 257-322. Chicago: University of Chicago Press, 2007. https://doi. org/10.7208/9780226468587-010.
Calomiris, Charles W. “Banking and Financial Intermediation,” in Technological Innovation and Economic Performance edited by Benn Steil, David G. Victor, and Richard R. Nelson, 285-313, Princeton: Princeton University Press, 2002.
Calomiris, Charles W., and Matthew Jaremski. “Deposit Insurance: Theories and Facts,” Annual Review of Financial Economics 8 (2016): 97-120.
Calomiris, Charles W., and Matthew Jaremski. “Stealing Deposits: Deposit Insurance, Risk-taking and the Removal of Market Discipline in early 20th Century Banks.” Journal of Finance 74, no. 2 (2019): 711-754.
Calomiris, Charles W., and Elliot Oh. Who Owned Citibank? Familiarity Bias and Business Network Influences on Stock Purchases, 1925-1929. No. w24431. National Bureau of Economic Research, 2018.
Calomiris, Charles W., and Daniel M.G. Raff. “The Evolution of Market Structure, Information, and Spreads in American Investment Banking,” in Anglo-American Finance: Financial Markets and Institutions in 20th-Century North America and the U.K., 103-160. Business One Irwin, 1995.
Faccio, Mara, Larry HP Lang, and Leslie Young. “Debt and expropriation.” Available at SSRN 239724 (2003).
Friend, Irwin, James R. Longstreet, Morris Mendelson, and Arleigh P. Hess. Investment Banking and the New Issues Market. . New York: World Publishing, 1967.
Friend, Irwin, Willis J. Winn, Morris Hamburg, and Stanley Schor. The Over-the-Counter Securities Markets. New York: McGraw-Hill, 1958.
Hilt, Eric. “When did Ownership Separate from Control? Corporate Governance in the Early Nineteenth Century,” The Journal of Economic History 68, no. 3 (2008): 645-685.
Hilt, Eric, Matthew Jaremski, and Wendy Rahn. “When Uncle Sam Introduced Main Street to Wall Street: Liberty Bonds and the Transformation of American Finance.” Forthcoming Journal of Financial Economics (2021).
Holtz-Eakin, Douglas, Whitney Newey, and Harvey S. Rosen. “Estimating vector autoregressions with panel data.” Econometrica: Journal of the Econometric Society (1988): 1371-1395.
Jaremski, Matthew. 2018. “The (Dis)Advantages of Clearinghouses Before the Fed” Journal of Financial Economics 127, no. 3 (2018): 435-458.
Jaremski, Matthew and David Wheelock. “Banking on the Boom, Tripped by the Bust: Banks and the World War I Agricultural Price Shock” Journal of Money, Credit, and Banking 52, no. 7 (2020):1719-1754.
Kempf, Elisabeth, Alberto Manconi, and Oliver Spalt. “Distracted shareholders and corporate actions.” The Review of Financial Studies 30, no. 5 (2017): 1660-1695.
Laeven, Luc, and Ross Levine. “Bank Governance, Regulation and Risk Taking.” Journal of Financial Economics 93, no.2 (2009): 259-275.
Lamoreaux, Naomi R. Insider Lending: Banks: Personal Connections and Economic Development in Industrial New England. Cambridge: Cambridge University Press, 1994.
Lamoreaux, Naomi R., and Christopher Glaisek. “Vehicles of Privilege or Mobility? Banks in Providence, Rhode Island, During the Age of Jackson.” Business History Review 65 no. 3 (1991): 502-527.
Means, Gardiner C. “The Diffusion of Stock Ownership in the United States,” Quarterly Journal of Economics 44, no. 4 (1930): 561-600.
Nickell, Stephen. “Biases in Dynamic Models with Fixed Effects”. Econometrica: Journal of the Econometric Society (1981): 1417-1426.
Roe, Mark J. Strong Managers, Weak Owners. Princeton, NJ: Princeton University Press, 1994.
Rutterford, Janette, and Dimitris P. Sotiropoulos. “The Rise of the Small Investor in the United States and United Kingdom, 1895 to 1970.” Enterprise & Society 18, no. 3 (2017): 485-535.
Saunders, Anthony, Elizabeth Strock, and Nickolaos G. Travlos. “Ownership structure, Deregulation, and Bank Risk Taking.” the Journal of Finance 45, no. 2 (1990): 643-654.
Shleifer, Andrei, and Robert W. Vishny. 1986. “Large Shareholders and Corporate Control.” Journal of Political Economy 94, no. 3, Part 1 (1986): 461-488.
Shleifer, Andrei, and Robert W. Vishny. “A Survey of Corporate Governance.” Journal of Finance 52, no. 2 (1997): 737-783.
Wainwright, Nicholas B. History of the Philadelphia National Bank: A Century and a Half of Philadelphia Banking, 1803-1953. Philadelphia, PA: William F. Fell, 1953.
Warshow, Henry T. “The Distribution of Corporate Ownership in the United States,” Quarterly Journal of Economics 39, no. 1 (1924): 15-38.
Wheelock, David C. and Paul W. Wilson. “Explaining Bank Failures: Deposit Insurance, Regulation, and Efficiency.” Review of Economic and Statistics (1995): 689-700.
White, Eugene N. (1984) “A Reinterpretation of the Banking Crisis of 1930.” Journal of Economic History 44, no. 1 (1984): 119-38.
Yafeh, Yishay, and Oved Yosha. “Large Shareholders and Banks: Who Monitors and How?” The Economic Journal 113, no. 484 (2003): 128-146.