

1. Introduction
Growing concerns about the educational outcomes of ethnic and racially diverse students in the United States have prompted schools and different levels of government to adopt policies to improve their achievement. The past several decades have seen the implementation of programs such as TRIO and Head Start to support the academic progression of primarily low-income disadvantaged students. However, many of these programs have citizenship requirements, or their use has sometimes been considered a potential “public charge” for migrants who intend to stay in the United States.1The Trump administration’s 2019 “Inadmissibility on Public Charge Grounds” final rule, which designated immigrants “likely at any time to become a public charge” as inadmissible, excluded Head Start enrollment from the definition of public charge. However, earlier leaked drafts of the rule revealed potential penalties for migrants’ or their childrens’ participation in the program (Torbati, 2018). This prospect may have had a detrimental “chilling effect” on the enrollment of eligible individuals in Head Start given that even before the final rule was officially published, noncitizen enrollment in other programs, such as Medicaid and SNAP, declined compared to that of US citizens (Capps et al., 2020).1 This has left millions of migrant families, most with US-citizen children, unable or too scared to benefit from these initiatives.
In an effort to support the academic progression of diverse students amid rising hostility toward immigrants, particularly after the 2016 presidential election, and persistent deficiencies in education, many school districts nationwide have adopted safe-zone policies. These policies aim to provide a safe environment that supports the academic progression of all students and offer additional assistance to migrant students. They are partially motivated by the 1982 Supreme Court ruling in Plyler v. Doe (457 US 202), which guaranteed free access to K-12 public education for all students regardless of their immigration status. In this paper, we examine the effectiveness of safe-zone policies in promoting the academic progression of all student groups, particularly those targeted by the policy, such as Hispanic students and English language learners (ELLs) as a proxy for migrants and students with migrant families. In a period of unprecedented intensification of immigration enforcement, these policies can prove essential to students’ academic progression and, ultimately, their human capital accumulation.2A growing literature has documented the perilous impacts of intensified immigration enforcement on the educational outcomes of children residing in households threatened by deportation. The impacts include reductions in school enrollment (e.g., Dee & Murphy, 2020; Pivovarova & Vagi, 2020), increased absenteeism rates (Kirksey et al., 2020), higher dropout and grade repetition rates (Amuedo-Dorantes and Lopez, 2015, 2017; Bucheli, Rubalcaba, and Vargas, 2021), and lower standardized test scores (Bellows, 2013). Another impact is the development of PTSD symptoms, such as anxiety, depression, anger/aggression, or disassociation (Allen, Cisneros, and Tellez, 2015; Brabeck and Xu, 2010; Rojas-Flores et al., 2017; Zayas et al., 2015), which can negatively impact children’s educational outcomes by affecting their ability to concentrate, relate to others, and learn.
Extensive evidence on the impact of immigration enforcement has found significant adverse effects on the educational attainment of children in immigrant families, particularly those of Hispanic descent. In 2021, approximately six million US-citizen minors lived with an unauthorized immigrant family member, and as many as half a million experienced the deportation of one of their parents between 2011 and 2013 alone (American Immigration Council, 2021b). A comprehensive body of literature has documented the detrimental consequences stemming from heightened immigration enforcement across multiple dimensions of education, including reduced enrollment rates, diminished test scores, increased absenteeism, and the exacerbation of educational disparities (Amuedo-Dorantes & Lopez, 2017; Bellows, 2019; Bucheli, Rubalcaba, and Vargas, 2021; Dee & Murphy, 2020; Ee & Gándara, 2020; Kirksey et al., 2020; Olivos & Mendoza, 2009). These effects have been attributed to increased vulnerability within households, leading to increased psychological distress (Cardoso et al., 2021; Zayas et al., 2015), the erosion of children’s sense of belonging (Zayas and Gulbas, 2017), and increased challenges relating to economic stability, access to food, and housing security (Brabeck and Xu, 2010; Chaudry et al., 2010; Dreby, 2012; Wessler, 2011). These findings underscore the potential for school district “sanctuary” policies—as is the case with safe-zone policies—in supporting the academic achievement of immigrant-origin students.
The state of California, with the largest immigrant population in the country, has enacted legislation to promote academic achievement and reduce disparities among disadvantaged minorities. In 2017, the state passed bill AB 699, which aims to ensure that students, regardless of their immigration status, can access education free from intimidation or discrimination. To comply with the law, school districts across the state started implementing safe-zone policies, which have the potential to benefit underrepresented students and reduce educational inequality through several channels. These include prohibiting discrimination in academic, extracurricular, and free-lunch programs based on immigration status or race; restricting immigration authorities from entering school campuses and accessing student information; allocating funds to facilitate access to financial, legal, and academic resources; and training school staff to enhance students’ educational opportunities. Even though almost six million students in California’s K-12 public education system are covered by AB 699, the effectiveness of safe-zone policies in promoting academic achievement among targeted minorities has yet to be examined. Evaluating these policies can provide a roadmap for thousands of school districts across the United States seeking to create a more inclusive and safer learning environment that contributes to their students’ academic achievement, particularly among the most vulnerable.
We address this gap in the literature by pursuing two main objectives. Our primary aim is to evaluate the effectiveness of safe-zone policies in California’s public school districts in supporting the academic progression of racially and ethnically underrepresented students. We achieve this objective with individual-level data on graduation rates and standardized scores in English language arts (ELA) and math for all students enrolled in public schools in the state. These data come from the California Longitudinal Pupil Achievement Data System (CALPADS). A secondary aim is to understand the mechanisms underlying any policy impacts. To achieve this, we use the individual-level California Healthy Kids Survey (CHKS) and the California School Staff Survey (CSSS) to explore the role of various policy components in contributing to improved academic outcomes as well as changes in students’ and teachers’ perceptions of their schools and learning environments.
The main empirical challenge we encounter when estimating the impact of safe zones is their nonrandom and staggered implementation by school districts. Figure 1 shows that different districts implemented safe-zone resolutions at various points between 2016 and 2019. Despite the 2017 passing of state law AB 699, each school district determined whether and when to adopt a safe-zone policy. This nonrandom adoption raises selection and omitted variable concerns. Additionally, the staggered implementation could introduce bias in traditional two-way fixed effect estimates, depending on whether they are driven by treatment or timing variation.
We address these issues in several ways. First, we address the staggered implementation of safe-zone policies using the estimation method proposed by Borusyak, Jaravel, & Spiess (2023) to derive causal effects and construct event studies. This allows us to gauge the impact of policy exposure while assessing the parallel trends assumption. Second, we verify the stable unit treatment value assumption (SUTVA) using a placebo control group, helping us to quantify the extent of control group contamination—even if the latter would bias our estimated impacts downwards. Third, we assess the nonrandom policy implementation by modeling treatment adoption and timing as a function of baseline district and community characteristics. Fourth, we use a propensity score matching approach to match treated and nontreated school districts before our model estimation. Finally, we conduct a series of placebo estimations where we randomly move the adoption timing of safe-zone policies to earlier years to gauge if the observed impacts are spurious.
Our results reveal that safe-zone policies have a protective effect, positively impacting standardized test scores and high school graduation rates, especially among vulnerable and likely migrant students. Policy components such as prohibiting collaboration with immigration authorities, calling on the federal government to protect immigrant families, and offering counseling or information on migration issues are found to be crucial for the policy’s success. We also find that safe-zone policies contribute to academic progression by improving the school climate and the school’s investment in a more equitable and respectful classroom environment, as perceived by students and reported by teachers.
Evaluating the efficacy of safe-zone policies in supporting the academic achievement of vulnerable and underrepresented students is crucial, particularly in light of the nationwide racial and ethnic disparities exacerbated by the COVID-19 pandemic (National Center for Education Statistics, 2023; US Department of Education, 2021). This study contributes to the literature examining the impact of school-based and academic programs, such as Head Start (Gray-Lobe,Pathak, & Walters, 2022; Ludwig & Miller, 2007) or free in-class breakfast (Imberman & Kugler, 2014), on academic achievement, which in turn may influence later-life outcomes, such as employment, earnings, health, and involvement in criminal activity (e.g., Becker and Chiswick, 1966; Clark and Royer, 2013; Lochner and Moretti, 2004). As a result, supporting the academic progression of disadvantaged groups is vital for social equity and future economic growth. In that regard, Lynch and Oakford (2014) estimate that closing the educational achievement gaps would expand the US economy by 5.8 percent (or $2.3 trillion) by 2050, with an average annual increase in GDP of $551 billion. Understanding the role of safe-zone policies in improving academic outcomes among diverse students and narrowing racial and ethnic inequities in education is more important than ever.
2. Related Literature
Since its inception after 9/11, the budget of Immigration and Customs Enforcement (ICE) has more than doubled, and that of Customs Border Patrol (CBP) has more than tripled. Their joint budgets far exceed the $9.7 billion appropriated by the Federal Bureau of Investigation or the $2.3 billion appropriated by the Drug Enforcement Administration (American Immigration Council, 2021a). This surge in financial support for ICE and CBP has driven the escalation in the coercive enforcement of immigration law, resulting in the deportation of over 3.6 million migrants between 2008 and 2018 (US Immigration and Customs Enforcement, 2015, 2018) and the fragmentation of families across the country.
Existing research has documented the harmful effects of immigration enforcement on the educational achievement of racially/ethnically diverse students—mainly Hispanic—and their participation in academic programs (Santillano, Potochnick, & Jenkins, 2020). Although not all Hispanic students are foreign born, this group faces a disproportionate vulnerability to immigration enforcement given that 55 percent of Hispanic children have at least one immigrant parent, and up to a quarter have an unauthorized immigrant parent (Clarke, Turner, & Guzman, 2017).
Prior research has found detrimental effects of immigration enforcement on marginalized students’ educational achievement and inequities. This literature has documented, for example, how enhanced immigration enforcement reduces school enrollment rates among Hispanic individuals (e.g., Amuedo-Dorantes & Lopez, 2017; Bucheli, Rubalcaba, and Vargas, 2021; Dee & Murphy, 2020). Other studies show that deportations are associated with higher levels of absenteeism and a wider math achievement gap between White and Latino students (Kirksey et al., 2020). Moreover, the pervasive effects of these policies have also been found to lower performance in standardized tests. Bellows (2019) documents how immigration enforcement initiatives, such as Secure Communities and 287(g) agreements, negatively impact Hispanic students’ achievement in English language tests. More recently, evidence shows that these negative impacts may even lead to a decline in the perceived English proficiency (Arenas‐Arroyo & Schmidpeter, 2022).
In addition, research on the mental health effects of immigration enforcement has unearthed the mechanisms through which enforcement negatively impacts children’s academic achievement. Several studies document a higher prevalence of posttraumatic stress disorder (PTSD) symptoms and higher levels of internalizing (e.g., anxiety and depression) and externalizing problems (e.g., aggression) in children of deported parents (Allen, Cisneros, and Tellez, 2015; Rojas-Flores et al., 2017; Zayas et al., 2015). Other studies find that parental vulnerability to deportation harms the quality of parent-child relationships and parents’ financial ability to support their children, raising the prevalence of anxiety manifestations among Latino adolescents (Brabeck & Xu, 2010; Cardoso et al., 2021). The racial dimension of these impacts is likely driven by the fact that 97 percent of deported migrants are of Latino descent (US Department of Homeland Security, 2014).
In light of the well-documented harmful effects of immigration enforcement on the mental health and educational outcomes of immigrant-origin and Hispanic children, investigating the potential mitigating effects of safe-zone policies is paramount for promoting equity and supporting the academic achievement of marginalized students. Our analysis aims to provide policymakers with empirical evidence on the effectiveness of safe-zone policies in reducing achievement disparities and identifying the key components that enable their success.
3. Institutional Context
As noted in the prior section, the United States witnessed an exceptional increase in interior immigration enforcement after 9/11. A series of local and state level initiatives ranging from 287(g) programs to the rollout of Secure Communities, starting in 2008, resulted in a significant increase in deportations, averaging close to 400,000 per year during 2008–2012. Because many deportees were men who had lived in the US for more than a decade, often having formed families during their stay, the intensification of immigration enforcement had significant consequences for immigrants and their relatives. These included a surge in household poverty (Amuedo-Dorantes, Arenas-Arroyo, & Sevilla, 2018) and housing and food insecurity (Potochnick et al., 2017), as well as a detrimental impact on the physical and mental health of these individuals (Wang & Kaushal, 2019; Young et al., 2022). These adverse effects have been shown to negatively impact children’s ability to focus and learn at school (Amuedo-Dorantes, Bucheli, & Martinez-Donate, 2023).
In that context, several localities and states started enacting policies to mitigate the adverse effects of intensified immigration enforcement. One such example is sanctuary policies. The “sanctuary movement” can be traced back to the 1980s, when its primary objective was to protect Central Americans fleeing persecution and civil conflict at home. Churches, community-based organizations, and cities and towns offered safe haven to Central American refugees who had difficulties qualifying for asylum in the United States (Stoltz Chinchilla, Hamilton, & Loucky, 2009). The expansion of the sanctuary movement into classrooms and the development of safe-zone policies were facilitated by the landmark 1982 US Supreme Court decision in Plyer v. Doe, which established that public schools cannot deny children access to education based on their immigration status.3Plyler v. Doe, 457 US 202 (1982). See https://www.loc.gov/item/usrep457202/, retrieved March 2023.
Today, the safe-zone movement also draws support from other legal protections, including the Family Educational Rights and Privacy Act (FERPA) and the US Constitution (Immigrants Rising, n.d.). FERPA keeps schools accountable for safeguarding student records, including their immigration status, and holds them liable for releasing information without the consent of parents or guardians. In addition, the Fourth Amendment of the US Constitution grants individuals the right to be free from unlawful searches, seizures, and warrantless arrests from law enforcement, which includes immigration enforcement activities, according to the US Supreme Court.4This implies that immigration officers “must have sufficient facts that would lead a reasonable person to believe, based on the circumstances, that the alien has violated federal immigration laws and is likely to escape before an ICE warrant can be obtained” (Smith, 2021). Students at school are unlikely to meet the latter requirement.
The safe-zone movement gained momentum in response to the intensified interior immigration enforcement and the surge in anti-immigrant rhetoric that followed the 2016 presidential election. Even though the Department of Homeland Security has traditionally considered schools as “sensitive locations” to be avoided during enforcement actions (Morton, 2011), in reality, this directive did not prevent ICE from apprehending migrant parents who were on their way to pick up, or dropping off, their children at school (Castillo, 2017; Hughes, 2020; Selk, 2017). These potentially traumatic experiences for children and the mounting evidence of their ensuing academic setbacks prompted many school districts nationwide to adopt safe-zone or sanctuary policies to safeguard their students’ education rights.5In one of the cases where ICE arrested migrant parents near schools, a 13-year-old student in Los Angeles stated, “It was the hardest thing to watch, but I still went to school because my father showed me the importance of education. I knew I’d have someone to support me there [emphasis added]” (Bever & O’Keefe, 2017). The LAUSD had already adopted a safe-zone policy at the time of the arrest. It is worth noting that while these resolutions do not ensure further protections for students than the ones already recognized by law, they help schools establish policies and procedures, directing staff on how to respond to various immigration enforcement activities.
Safe-zone resolutions generally incorporate some or all of the following elements: (a) restricting immigration enforcement agents’ access to school campuses without the superintendent’s prior approval; (b) restricting cooperation with ICE in enforcement actions whenever legally possible; (c) prohibiting district staff from collecting or sharing information that could be used to identify students’ or their families’ immigration status; (d) supporting diversity and inclusion initiatives; (e) issuing public calls for comprehensive reforms that protect immigrant students; and (f) providing additional resources for immigrant students and their families, including counseling and legal assistance services. In some cases, school districts have adopted relatively vague safe-zone resolutions to avoid being targeted by the Trump administration’s effort to defund sanctuary jurisdictions.6See Executive Order 13768 of January 25, 2017, “Enhancing Public Safety in the Interior of the United States,” available at https://www.federalregister.gov/d/2017-02102.
In response to President Donald Trump’s support for the mass deportation of unauthorized immigrants and the termination of the Deferred Action for Childhood Arrivals (DACA) program (Diamond & Murray, 2015), the Los Angeles Unified School District (LAUSD)—the second largest in the country—adopted a resolution in 2016 declaring its campuses as “safe zones and resource centers for students and families threatened by immigration enforcement.”7Los Angeles Unified School District, “LA Unified Campuses as Safe Zones and Resource Centers for Students and Families Threatened by Immigration Enforcement (Res-032-15/16).” As part of this declaration, the LAUSD launched the “We Are One” campaign to offer resources, advice, and information about immigrants’ rights. The effort also included public support for immigrants and other diverse student groups (Boessenkool, 2017). Since then, other school districts have followed suit and declared themselves safe zones.
At the state level, California passed state law AB 699 in 2017 to protect students’ right to public education, making it the first state to enact such legislation. This law emphasizes that “it is more important than ever for California to work to protect students and ensure that, regardless of their immigration status, they may continue to take advantage of the education to which they are entitled, free from intimidation or risk of a loss of access to resources and programs that other students enjoy” (California State Assembly, 2017). Many school districts simply changed their internal policies to ensure that they complied with AB 699. Other districts took a more public stance by declaring themselves safe zones or sanctuary schools and going beyond what AB 699 required, signaling to students and families that they would not assist in immigration enforcement activities and would do everything in their power to ensure a safe and welcoming learning environment for all students.
Safe-zone initiatives can impact children’s educational outcomes through various channels. First, they prohibit discrimination in academic, extracurricular, and other school opportunities based on immigration status or race. This prohibition supports an inclusive and welcoming environment, even if it is only through a symbolic signaling effect. Second, these initiatives transform schools into safe spaces for immigrant-origin children and their families, where they are less likely to encounter immigration authorities. The lower risk of psycho-emotional trauma from such experiences may facilitate students’ learning and social interactions. Third, safe-zone declarations often call for creating or expanding information sites that provide students with financial, legal, and academic resources or a rapid response network to assist when immigration authorities detain parents.
Last, safe zones may allocate funds for school staff training. For instance, the San Francisco Unified School District directed resources to work “with immigrant and undocumented students and their families on issues such as rights to college access, financial assistance for college, employment and career opportunities” (San Francisco Unified School District, 2021). In an environment of heightened immigration enforcement, policies that create a safer and more welcoming environment at school have the potential to support students’ academic progression, even among children not directly targeted by enforcement efforts.
4. Data
4.1. Safe-Zone Policies
Our study examines the impact of safe-zone policies on education in California. To create a comprehensive data set of safe-zone policies, we collected information on all policies adopted by school districts in California between 2007 and 2019. Despite the passage of state law AB 699 in October 2017, mandating equal access to education regardless of students’ immigration status, approximately 160 school districts had already adopted a safe-zone policy. The early policy adoption was mainly in response to the 2016 presidential election.
To determine each school district’s safe-zone status and policy activation date, we used various sources, including information released by the California Department of Education (2022), the National Education Association (2022), information retrieved manually by reviewing each school board’s publicly available resolutions and other relevant documentation, and by contacting school districts by phone when needed. Our data collection process also included identifying specific policy components enacted by each school board. We gathered information on whether the policy prohibits enforcement actions on school campuses and the collection or sharing of immigration information from students or families with immigration authorities. Additionally, we documented whether these policies provided professional development opportunities for staff and faculty or counseling services for students on immigration-related issues.
The data reveal that as of 2019, approximately 299 out of the 940 school districts in the state had implemented such policies, as shown in Figure 1. This number accounted for over 60 percent of all students in the public school system in California. Figure 1 also indicates that 83 percent of the school districts that implemented a safe-zone policy within our study period did so in 2017 and 2018—a relatively short time window. In addition, roughly two-thirds of the school districts did not adopt the policy over the period under study.
4.2. Student Characteristics and Academic Outcomes
Our main data set on educational outcomes comes from the CALPADS, which includes demographic and longitudinal academic information for the universe of students in grades K-12 for each academic year. Depending on the educational outcome being examined, the data set starts in 2013–2014 for standardized testing and 2009–2010 for high school graduation. Our study period ends before the 2019–2020 academic year to avoid potential confounding effects of the COVID-19 pandemic disruptions.
Empirical research has found that test scores are a good predictor of individuals’ college enrollment, the quality of the institutions they attend, and earnings later in life (Chetty, Friedman, & Rockoff, 2014).8Even within the state of California, a 2020 report from the University of California Academic Council’s Standardized Testing Task Force (STTF) concluded that high school standardized testing scores are among the best predictors of first-year college GPA, first-year retention, undergraduate GPA, and graduation rates (University of California Academic Senate, 2020). Hence, one of the outcomes we focus on is standardized test scores in ELA and math. Since 2014, the California Assessment of Student Performance and Progress (CAASPP) system has evaluated public school students statewide by implementing standardized testing based on California’s common core state standards. All students in grades 3 through 8 and 11 are required to participate (California Department of Education, 2021). Raw ELA and math CAASPP test scores are reported in the CALPADS data set for over 14 million students, with complete information for academic years 2013–2014 through 2018–2019. We standardize the raw scores by school grade and year for the entire state to make the test scores comparable through time and across grades.
We also explore the effect of safe zones on students’ high school graduation rates. According to the US Bureau of Labor Statistics, the median earnings of high school graduates are approximately $8,400 per year above those of individuals who do not graduate from high school (Torpey, 2021). The annual differential rises to almost $36,000 if we compare college graduates to high school dropouts. Even obtaining a GED certificate instead of a high school diploma fails to close this gap (Heckman & LaFontaine, 2010; Murnane, Willett, & Tyler, 2000). Accordingly, California’s State Board of Education has established increasing graduation rates as one of the leading long-term goals in its Every Student Succeeds Act (ESSA) Consolidated State Plan (State Board of Education, 2022). To evaluate the impact of safe-zone policies in this dimension, we use CALPADS individual-level graduation data for 3.4 million 12th graders during the 2009–2010 through 2018–2019 academic years. We focus on graduation, defined as a student leaving school after meeting all state and local high school graduation requirements and receiving a high school diploma.
In addition to academic outcomes, the CALPADS data set contains individual-level information on students’ school, gender, ethnicity, migrant status, and socioeconomic disadvantage, and whether the student has an individualized educational plan. It also identifies the schools and school districts in which students are enrolled. This level of geographical information allows us to merge the individual-level data to the safe-zone policies database and school district information obtained from Ed-Data (2022).
Finally, we also merge county-level data, primarily gathered from the US Census Bureau and the Bureau of Labor Statistics, on population composition, median household income, poverty, and unemployment rates. This information enables us to conduct identification checks to analyze the nonrandom adoption of safe zones.
Tables 1 and 2 provide a preview of the data used in our analysis. The statistics in Table 1 underscore the significantly lower standardized math and ELA test scores of students in policy-adopting school districts than their counterparts in never-adopting school districts. The two sets of districts also differ significantly in the composition of their student population. For instance, never-adopting districts have a 10 percentage point higher share of White students but lower shares of Black, Hispanic, ELLs, and economically disadvantaged students than policy-adopting districts. Additionally, never-adopters have a smaller student-teacher ratio, a lower percentage of students receiving free or reduced-price meals, and a significantly smaller student enrollment. Table 2 provides a similar picture, although the disparities in graduation rates between students in school districts that adopt the policy and those that never do are relatively small compared to the gap in standardized test scores shown in Table 1. These descriptive statistics emphasize the importance of considering the composition of the student population and school endowments when evaluating the effects of safe-zone policies on student outcomes. In what follows, we do so in a more thorough analysis that accounts for all those factors.
5. Methodology
Our study employs a quasi-experimental design that leverages geographic and temporal variations in the adoption of safe-zone policies to compare changes in academic outcomes between students in treatment and control school districts. We examine the effects of safe-zone policies by comparing educational outcomes before and after the policy implementation in treated districts to those in control districts that had not adopted a safe-zone policy by the end of the study period as follows:
(1) 
where  captures the academic outcome of interest (e.g., standardized test scores) of the
  student, attending grade
  , in school district
  , during academic year
  .
.  is an indicator variable for the presence of a safe-zone policy in school district during academic year . We are primarily interested in the
  coefficient, which measures the effect of the safe-zone policy on the outcome variables.
Equation (1) includes student, grade, school district, and academic year fixed effects (  vectors) to account for unobserved time-invariant traits potentially affecting student academic performance. Including student fixed effects accounts for time-invariant characteristics such as gender, race, ethnicity, immigrant background, parental education, and unobserved personal factors correlated with academic performance. Concurrently, grade fixed effects capture factors specific to each grade level, including the school curriculum difficulty and students’ average developmental stage. The district fixed effects capture factors at the district level that can influence academic performance, such as the demographic composition, local policies, and other district-specific attributes. Last, we incorporate academic year fixed effects to account for broader, state, or nationwide factors affecting all school districts, such as changes in immigration policies and the overall political climate. Standard errors are clustered at the school district level to account for the policy adoption at the district level.
The validity of our estimate relies on multiple identification assumptions that we confirm through various checks. First, we address potential biases in the traditional two-way fixed effects estimates resulting from the staggered adoption of safe-zone policies across school districts in our sample. Specifically, we rely on the imputation methodology developed in Borusyak, Jaravel, & Spiess (2023) to estimate treatment effects and conduct event studies in a staggered setting. This methodology involves modeling the outcomes of nontreated units and then using these estimates to extrapolate the nontreated potential outcomes of treated units. It then proceeds to calculate the difference between the realized and potential outcomes for treated observations. The resulting estimated treatment effect is derived as the average of these differences. This approach enables us to evaluate treatment effects in staggered settings while circumventing the need to contrast treated units with other already-treated units. We use the event studies to assess whether academic outcomes in treated school districts trended parallelly to those in control districts before the implementation of the safe-zone policies.
Second, we use a more restrictive control group to verify that the policy does not affect individuals in the nontreated group, that is, the SUTVA. Finally, to test the robustness of our findings and rule out potential spurious correlations, we conduct a series of placebo estimations by randomly moving the adoption of safe-zone policies to earlier years. This exercise allows us to assess whether the observed impacts of the policy on academic outcomes are driven by chance or factors other than the implementation of the safe-zone policy itself. After assessing the reliability of our findings, we further investigate the mechanisms responsible for the observed impact by examining the heterogeneous policy impacts and the role played by different safe-zone policy components in achieving the observed outcomes.
6. The Impact of Safe-Zone Policies on Academic Outcomes
6.1. Main Results
Our main goal is to gauge how school districts’ adoption of safe-zone policies might have helped K-12 students’ academic performance, as captured by math and ELA standardized test scores and high school graduation rates. Table 3 displays the results from estimating Equation (1) with the imputation method (Borusyak, Jaravel, & Spiess, 2023).
Our analysis reveals how safe-zone policies appear to have led to improved academic outcomes. Adopting safe-zone policies is linked to a 0.01 and a 0.021 standard deviation increase in math and ELA test scores, respectively, although the effect appears statistically significant at conventional levels only for ELA. This effect is equivalent to 10–30 percent of the effect observed for other programs such as Head Start (Ludwig & Miller, 2007) or free in-class breakfast (Imberman & Kugler, 2014). Furthermore, the adoption of these policies resulted in a 1.4 percentage point increase in students’ graduation likelihood, representing about half of the gap between policy-adopting and never-adopting school districts in our study period (see Table 2). Relative to other interventions, this impact is about one-third of the average estimated effects of several US preschool programs, including Head Start, on high school graduation rates (Gray-Lobe,Pathak, & Walters, 2022).
6.2. Identification Checks
To support the causal interpretation of the estimated impacts of safe-zone policies adopted at different times, we perform several identification checks.
6.2.1. Assessing the Parallel Trends Assumption
A main threat to the causal interpretation of the estimates in Table 3 is if, without safe-zone policies, the difference in educational outcomes between districts that adopt a safe-zone policy and never-adopters would not have followed a parallel trend. While we cannot observe that counterfactual, we can gauge if test scores and graduation rates were evolving similarly in never-adopters and in districts that eventually adopted the policy, before doing so, by estimating the following event study model:
(2) 
where represents the educational outcome for student  in district during academic year .
  is a binary variable indicating whether district has adopted a safe-zone policy at time , and the
  terms are individual, grade, school district, and academic year fixed effects, respectively. The model omits the grade subscript and fixed effects
  when focusing on high school graduation among 12th graders. The
  and
and  parameters represent the difference in educational outcomes in academic year relative to the period in which the policy is adopted. To account for the dynamic treatment effects resulting from the staggered adoption of safe-zone policies (as shown in Figure 1), we also employ the Borusyak, Jaravel, & Spiess (2023) imputation estimator for Equation (2).
Figures 2–4 illustrate the estimated coefficients and 95 percent confidence intervals for and for the three outcomes of interest. The results indicate that the estimates for the periods before the policy adoption are statistically indistinguishable from zero, suggesting no significant pre-policy differential trends in educational outcomes among students in districts that adopted safe-zone policies versus those that did not. Additionally, there is a positive and significant break in the trends observed in Figures 3 and 4 for standardized ELA test scores and high school graduation rates following the implementation of safe-zone policies, which remain significantly different from zero throughout the sample period. These results support the parallel trends assumption and, in turn, the interpretation of the estimated policy impacts in Table 3 as causal.
6.2.2. Assessing the SUTVA
A second important threat in most policy analyses refers to the so-called SUTVA, namely that the assumption that our estimates are not biased by potential policy spillovers. This assumption would be violated if, for example, diverse and migrant students at school districts that did not pass a safe-zone resolution still benefited from other districts’ adoption of the policy. One could foresee the restrictions safe-zone policies imposed on the schools’ collaboration with ICE-led immigration authorities benefiting students in nontreated districts. At the individual level, students who benefited from access to legal and counseling services could have shared resources with peers and relatives at other districts. While these spillovers would bias the policy impact downwards, we try to gauge the extent to which they may be biasing our findings by reestimating Equation (1) with an alternative control group defined to mitigate the likelihood of policy spillovers.
Table 4 shows the difference-in-differences (DID) coefficients obtained with the Borusyak, Jaravel, & Spiess (2023) estimator when we narrow our attention and use a more restrictive control group, namely students in never-treated districts observed in 2015 (i.e., before the adoption of the safe-zone policies). Notably, the estimated policy impact for the math and ELA test scores are similar to those presented in Table 3 and greater for graduation, suggesting that spillovers from students in treated to comparison school districts, and therefore potential SUTVA violations, are not a significant source of bias.
6.2.3. Addressing Other Sources of Policy Endogeneity
Finally, another policy evaluation concern is the potential endogeneity of the policy adoption. While California’s state law AB 699 required the protection of all students, particularly those in immigrant-origin families, the policy adoption did not occur randomly. However, we are particularly concerned if the policy adoption was driven by students’ performance (reverse causality) or by unobserved heterogeneity/confounding factors (omitted variable biases) driving the measured policy impacts. To gauge the extent of reverse causality, we first model school districts’ adoption of safe-zone policies as a function of baseline district and community characteristics. Table 5 presents the results of this exercise. Columns 1–3 show that the size of the student body is the main factor predicting the activation of a safe-zone policy by the end of the study period, with larger school districts being significantly more likely to become a safe zone. Importantly, we find weak correlations between the likelihood of policy adoption and students’ academic characteristics, including graduation and dropout rates and the share of students meeting or exceeding the math and ELA standards.
Columns 4–6 present a similar story for the year of policy activation, with larger districts being more likely to adopt a safe-zone policy sooner. In addition, schools with higher student-teacher ratios and those with higher standardized math scores adopt the policy later, raising concerns about the endogeneity of the policy adoption in our case. Finally, both the adoption and adoption timing appear to be impacted by the share of school-age youth in the county, with counties that have a higher percentage of students in this age group being less likely to adopt the policy and, if they adopt it, doing so later.
As noted above, we are also concerned about the possibility of unobserved heterogeneity and confounding factors, such as changes in the population composition of the counties adopting safe-zone policies, being responsible for the measured policy impacts. To address this concern, Appendix Table A1 displays the results from estimating the impact of the adoption of a safe-zone policy by school districts on the population composition of the counties. This composition is captured by the share of foreign-born residents, the share of non-English speakers at home, the share of residents with a high school diploma, the share of residents aged 5–17, and the median household income of the counties. Overall, we fail to find much evidence of the population composition of the counties changing on account of safe-zone policy adoption, with only a marginally statistically significant and noneconomically meaningful relationship with median household income. As such, the results in Tables 5 and A2 suggest that, while nonrandom, the adoption of a safe-zone policy is not driven by reserve causality. In addition, the policy does not appear to have significantly altered the demographic or economic traits of adopting counties.
6.2.4. Using Treatment Propensity to Identify Treated and Control Units
An additional identification concern arises from potential differences between school districts that implemented a safe-zone policy and their nontreated counterparts across dimensions that may impact student outcomes. As indicated in Table 5, student enrollment is the primary and most consistent predictor of a school district adopting a safe-zone policy. Student enrollment may function as a proxy for a district’s resources but may also lead to overcrowded classrooms. Both traits could significantly alter student academic performance.
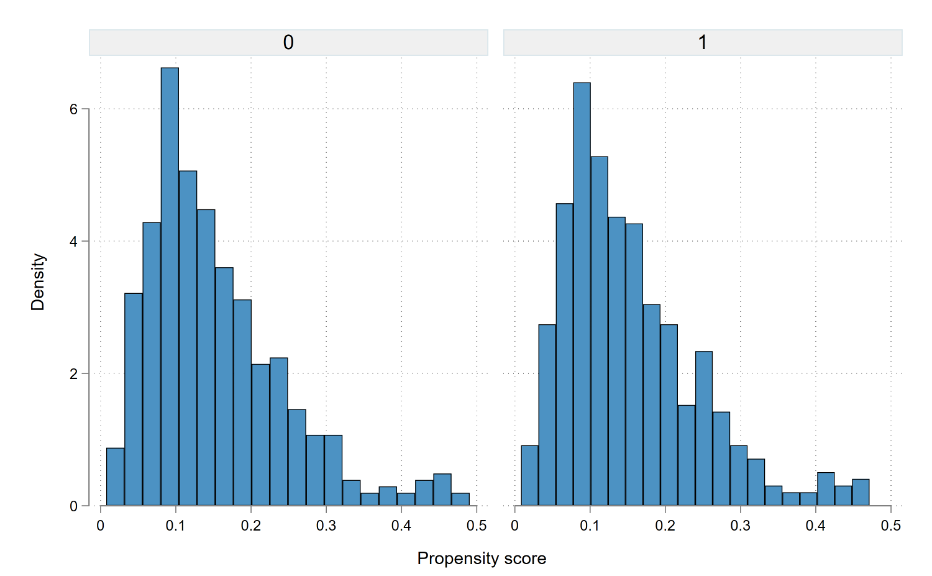
To address this concern, we use propensity score matching to estimate the propensity of having a safe-zone policy in place based on school enrollment at baseline. We adopt a nearest-neighbor matching technique to identify more comparable groups of treated and control school districts. Appendix Figures A1 and A2 depict the overlapping distributions of the districts’ propensity scores, confirming there is sufficient common support. Table 6 presents the coefficients from reestimating the model specification for our main results in Table 3 using the matched sample. Consistent with our prior findings, the estimates suggest that the implementation of safe-zone policies led to improvements in students’ math and ELA test scores and graduation rates.
6.3. Robustness Checks
We conduct several robustness checks to evaluate the sensitivity of our findings. These include dropping the LAUSD from the sample, excluding school districts that adopted a safe-zone policy before state law AB 699 was enacted, and clustering standard errors at the school level to account for variation in the policy implementation at a more local level.
As the LAUSD represents approximately 10 percent of California’s total public school enrollment (Ed-Data, 2023), we explore whether the observed policy impacts were driven by this district given its relative size and early adoption of the safe-zone policy in 2016. The results of these checks in columns 1–3 of Table 7 show that when we exclude the LAUSD, the estimated effects on standardized test scores and graduation remain positive, albeit smaller in size and more imprecisely estimated than when using the entire sample. A similar result is observed in columns 4–6 when we exclude school districts that activated a safe-zone policy before the state legislature adopted AB 699. Finally, as shown in columns 7–9, the findings are robust to clustering standard errors at the school level, which might help address the distinct implementation of the district policy by schools.
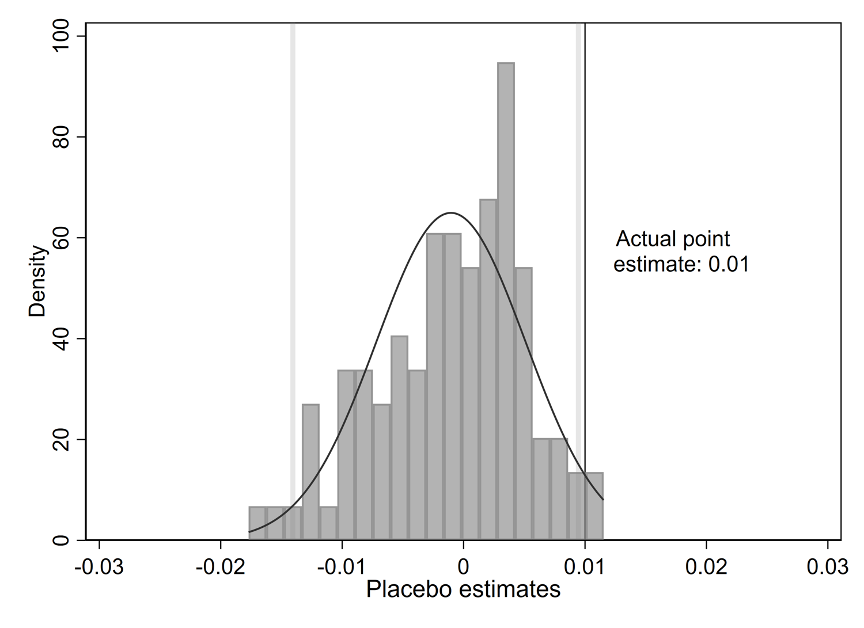
Finally, we conduct placebo tests to determine whether the estimated impacts are likely the result of spurious correlations. We randomly alter the district-specific policy activation month to periods before its actual implementation to examine whether our results are coincidental and statistically similar to other estimates generated with random policy activation dates. We repeat this exercise 500 times by randomizing the activation month and reestimating Equation (1), and then compare the results to the treatment effect in Table 3. Figures 5–7 show the resulting distribution from this exercise, along with 95 percent confidence intervals, for the three outcomes of interest. In all cases, we observe that the actual point estimate is situated outside and to the right of the placebo distribution, indicating that our estimated treatment effects are not driven by spurious correlations or chance alone.
6.4. Heterogenous Impacts
A main goal of safe-zone policies is to ensure students’ access to education, especially those more likely threatened by the intensification of interior immigration enforcement, as has been the case with many Hispanic children residing in mixed-status households. In this section, we explore how the policy may have helped reduce educational inequities by safeguarding the academic performance of children more likely to be directly impacted by the intensification of interior immigration enforcement since the early 2000s. In addition, we look at their classroom peers, as the policy might have had some positive externalities on other children. Table 8 reveals the results from repeating the analysis, distinguishing by Hispanic ethnicity, ELL status, economically disadvantaged status, as well as by a group defined by the combination of all three characteristics.
Columns 1 and 2 indicate that safe zones appear to have benefited both non-Hispanic and Hispanic students across all outcomes under examination, although the impact is more pronounced among Hispanic students. Specifically, non-Hispanic students experienced a 0.012 standard deviation increase in ELA test scores and a 0.7 percentage point increase in graduation rates. In contrast, they saw a 0.018 standard deviation improvement in ELA scores and a 1.8 percentage point surge in graduation propensity. It is worth emphasizing these gains, particularly considering that Hispanic students are likely to encompass the population most threatened by the intensification of interior immigration enforcement.
Similarly, safe zones improved the ELA test scores and graduation likelihood of students in greater need and more likely to come from immigrant households, as is the case of ELLs and economically disadvantaged students. Both groups experienced significant gains in standardized ELA test scores (averaging 0.014 of a standard deviation) as well as in their graduation propensity, ranging between 0.7 and 1.2 percentage points). Importantly, when we further zoom in on the group that is most likely capturing students from an immigrant background—that is, those who are Hispanic, English learners, and economically disadvantaged—safe zones increase ELA test scores by 0.016 of a standard deviation and graduation rates by 1 percentage point. Overall, the results in Table 8 underscore the consistently positive benefits of safe zones on students’ academic performance, particularly among Hispanic students and those more likely to live with immigrant families, highlighting the potential of this policy to improve their performance.
7. Policy Components
Given the positive impacts of safe zones, it is worth paying closer attention to the mechanisms at play. What aspects of this policy are responsible for the observed improvements in children’s standardized test scores and graduation rates? Understanding the channels through which these policy impacts materialize is crucial for policy implementation and replicability. It is also an aspect worth examining in the case of safe-zone policies given their diverse nature.
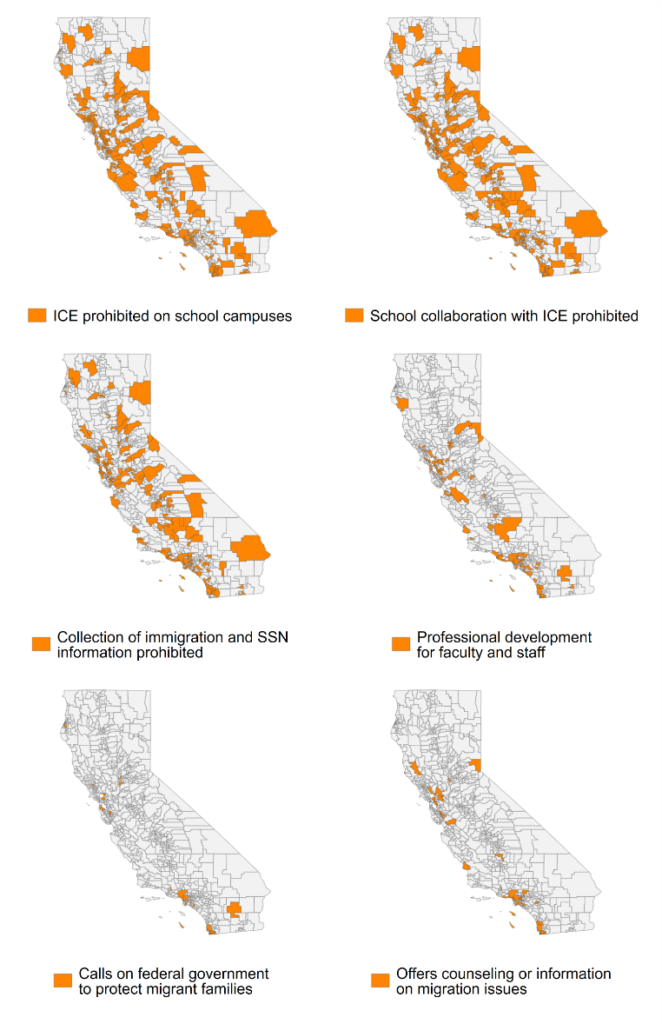
We focus on some of the most frequent policy components in our sample. These include a variety of aspects ranging from lack of collaboration with ICE—either by barring ICE from entering the school campus, banning any cooperation with the agency, or banning the collection of information revealing students’ migrant status—to more proactive policies involving the training of school personnel, calling on the federal government to protect migrant children, or providing student counseling on immigration issues. Appendix Figure A3 indicates the school districts that adopted each of these policy components. In all cases, we create indicators signaling the presence of that policy component and use it in place of the safe-zone policy dummy in our main model specification.
Table 9 displays the results of this exercise. Most of the various components prove helpful in improving students’ academic performance, as captured by their standardized ELA test scores and graduation rates. Policies aimed at limiting the potential interaction of students with immigration authorities by banning ICE from entering school campuses, or prohibiting the collaboration of schools with ICE, boost ELA test scores by 0.015 standard deviations and graduation likelihood by up to 1.5 percentage points. Offering professional development for staff and faculty has similar effects on both outcomes. In addition, public displays of support, such as school districts’ call on federal officials to protect migrant families, and the provision of student counseling have even more meaningful impacts by improving performance in ELA test scores by 0.018 standard deviations and graduation propensity by up to 2.9 percentage points. These components likely capture a greater compromise of the school district with the population it serves as well as a more holistic approach to helping students beyond assisting them with academics.
In sum, the collective effect of safe-zone policies, particularly the lack of collaboration with ICE, the active calling on federal authorities to protect children, and schools’ provision of student counseling on immigration-related issues and concerns, proves beneficial in helping children improve their academic performance. This may occur through children’s increased ability to focus while at school as well as support and encouragement by staff, which may go a long way in improving expectations about their academic achievements. Furthermore, it can facilitate the collaboration of schools with parents and the community they serve, which is crucial to ensuring academic progression and averting school dropouts (Amuedo-Dorantes, Bucheli, & Martinez-Donate, 2023).
8. Mechanisms
What is driving the impact of safe-zone policies and their various components on students’ academic outcomes? In this section, we address this question by examining changes in the perceptions and experiences of students and teachers regarding their schools and learning environments following the adoption of safe-zone resolutions. We consider these changes as potential channels for the observed policy impacts. If the various policy measures make students feel safer or experience a more welcoming and supportive environment, they may be more focused and motivated to learn. They may also enhance student access to better resources and, ultimately, improve their academic experiences and performance. We turn to data from the CHKS and the CSSS to assess these possibilities.
The CHKS is an anonymous comprehensive health risk and resilience survey sponsored by the California Department of Education and administered by WestEd. The data set provides information on several measures, including demographic characteristics, student connectedness, victimization, and academic engagement for students in grades 6–12 (CalSCHLS, 2023). Our sample includes over two million student-year observations spanning the academic years 2012–2013 through 2019–2020. The CSSS teacher data set provides information on 136,000 teachers in grade 5 and above for the same academic years. Specifically, the survey assesses teachers’ experiences and perceptions about their schools’ environment and student support.
Appendix Table A2 presents descriptive statistics for the student characteristics contained in the CHKS sample. The summary statistics indicate that the gender and racial/ethnic composition, as well as the student distribution in policy-adopting school districts, mirror the characteristics of schools in the CALPADS data used in the main analysis (see Tables 1 and 2). Furthermore, according to the characteristics in Appendix Table A2, about half of the students are female, predominantly Hispanic (45 percent), and living at home with one or more parents/guardians (90 percent), and almost half have at least one parent or guardian who graduated college (45 percent). Nearly 60 percent were enrolled in a school district that eventually adopted a safe-zone policy, while the remaining 40 percent attended a school district that never implemented such a policy.
To estimate the impact of safe-zone policies on the perception and experiences of students and teachers, we employ the same identification strategy as in Equation (1). We directly apply the Callaway & Sant’Anna (2021) estimator to address variations in treatment timing.9Because of the sample size, it is not as computationally intensive as with the CALPADS data. In the analysis, we control for student characteristics and report standard errors clustered at the school district level to account for the level of policy implementation.
Table 10 reports the average treatment effect for students covered by a safe-zone policy on their connectedness, relationships with teachers, and victimization experiences at school. The first row indicates that, on average, there were no pre-policy differences between students in treated and untreated districts. However, the second row reveals significant policy impacts on several outcomes. The post-policy estimates in columns 1 and 2 indicate a positive effect on students’ sense of belonging to their schools and on their propensity to report feeling close to people at school, which increase by 3.2 and 2.1 percentage points, respectively (equivalent to 5.8 and 3.3 percent relative to the respective variable means). These impacts are accompanied by a 4.7 percentage point increase in the likelihood of feeling happy at school, as shown in column 3. Additionally, column 4 shows a 3.5 percentage point drop in the probability of students expressing fear of physical assault within the past 12 months.
Aside from feeling safer, happier, and welcome, there appear to be significant improvements in student-teacher relationships following the policy adoption. Based on column 5, students are 4 percentage points more likely to report being fairly treated by their teachers following the policy implementation. In addition, according to the estimates in columns 6 and 7, students are 3.4 percentage points more likely to feel cared for by a teacher or another adult at school and 3.7 percentage points more likely to report being encouraged by a teacher when they perform well.
In Table 11, we examine the impact of safe-zone policies on teachers’ perceptions about the schools they work at with regard to safety, support, and equity. Similar to Table 10, the first row shows no pre-policy differences, whereas the second row reveals notable policy effects. Columns 1 and 2 reveal a significant and positive policy impact on teachers’ perceptions regarding student and staff safety at the school, which improved by approximately 8 percentage points. Similarly, column 3 indicates that teachers perceive their schools as more welcoming for parents while facilitating their involvement. Columns 4 and 5 indicate that teachers are 4.8 and 4.4 percentage points more likely to perceive their schools as inviting for student learning and providing adequate support services. In addition, the results also point to safe-zone policies leading to an improved perception of equity.
According to the estimate in column 6, teachers’ propensity to report believing the school offers equal opportunities to all students in classroom activities rises by 2 percentage points following the policy adoption. Further, as reported in column 7, teachers become almost 6 percentage points more likely to view their schools as fostering appreciation for student diversity and respect for each other. This is also reflected in column 8, which shows that teachers perceive safe-zone schools as more interested in closing the racial/ethnic achievement gap. Even in the context of discipline problems, the estimate in column 9 indicates that teachers are 5 percentage points more likely to perceive their schools as handling discipline issues fairly following the adoption of a safe-zone policy.
Overall, the results in Tables 9 and 10 suggest that safe-zone policies positively impact students’ and teachers’ perceptions of their schools, enhancing their sense of safety, support, and equity and fostering an inclusive and respectful learning environment.
9. Summary and Conclusions
The prevalence of pervasive ethnic and racial inequities has increased interest in policies that may promote the academic achievement of disadvantaged groups. We focus on one such approach—namely safe-zone policies—adopted by many school districts in California. Using data on nearly the universe of students in K-12 in the state, we find that the adoption of safe-zone policies appears to have significantly contributed to raising standardized test scores in ELA and math. In addition, the policies have had a nonnegligible impact in boosting graduation rates. These impacts, which prove robust to a series of identification checks, including an assessment that the policy effects did not predate the policy adoption, are not spurious and do not merely reflect changes in confounding county or school district traits. Importantly, the policy impacts were particularly prevalent among Hispanic and more vulnerable students. These results underscore the promising nature of the policies in narrowing academic achievement gaps across ethnic and racial groups in the state.
We also explore the role played by various policy characteristics to understand the critical components that protect students. Among the most important are preventing ICE from entering school campuses and offering student counseling on matters related to immigration, followed by the school district’s call on the federal government to protect migrant families and the district’s provision of professional development to faculty and staff. These findings emphasize the importance of providing direct and specific services to students and families, along with public declarations of support.
Finally, we focus on understanding potential mechanisms for the observed effects of policies protecting students’ access to academic opportunities. To that end, we use the CHKS and the CSSS, which enable us to analyze the effects of safe-zone policies on students’ connectedness, relationships with teachers, and victimization experiences, as well as teachers’ perceptions of safety, support, and equity. We find that students attending schools in safe-zone districts report an increase in their feelings of belonging, reduced fear of assault, and improved relationships with teachers. Additionally, teachers perceive their schools as safer, more supportive, and promoting equity, indicating a positive impact of safe-zone policies on the overall school environment.
In general, safe-zone policies appear to have been effective in supporting students’ academic achievement, often through measures that might be relatively inexpensive, as in the case of calling on the federal government to protect migrant families or providing students with counseling on immigration-related issues. Given the long-term impacts of education on life-long outcomes, including employment, earnings, health, and involvement in criminal activity (e.g., Becker and Chiswick, 1966; Clark and Royer, 2013; Lochner and Moretti, 2004), this type of support might prove vital for closing educational gaps and promoting economic growth.
Tables
Figures
Figure 1. California Public School Districts by Safe-Zone Activation Year
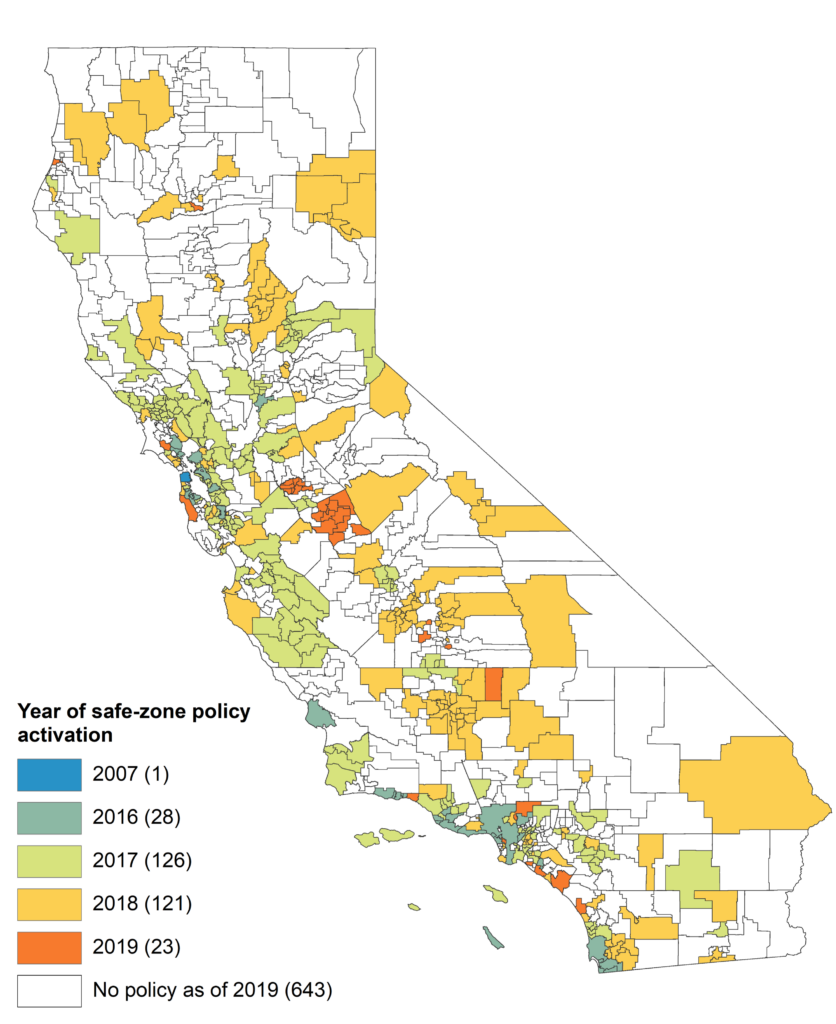
Notes: The figure is created by the authors using data from the California Department of Education, the National Education Association, and individual school districts’ boards of education. The map shows the year each school district activated its safe-zone policy. The number of districts is indicated in parentheses.
Figure 2. Event Study for Standardized Math Test Scores
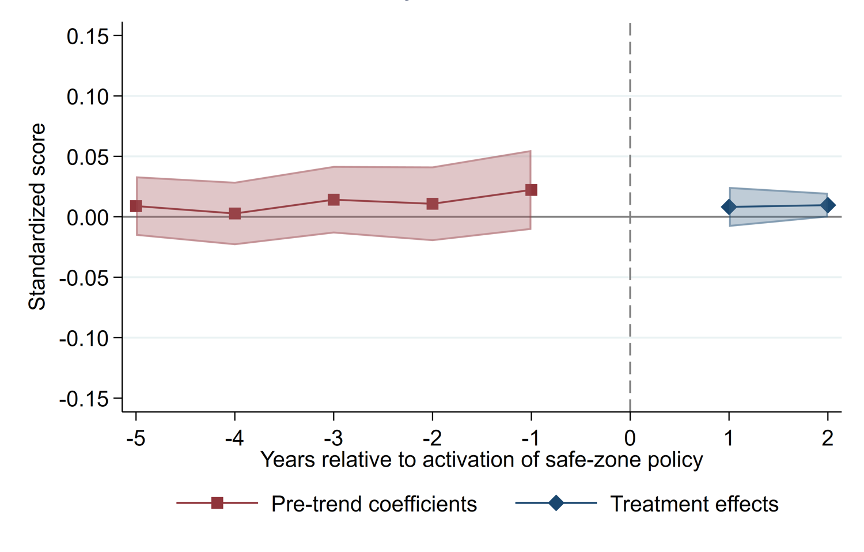
Notes: The figure illustrates the estimated coefficients and 95 percent confidence intervals from the estimation of Equation (2), using the Borusyak, Jaravel, & Spiess (2021) imputation estimator. Period =0 represents the academic year when a safe-zone policy was first adopted in the school district and is used as a reference.
Figure 3. Event Study for Standardized ELA Test Scores
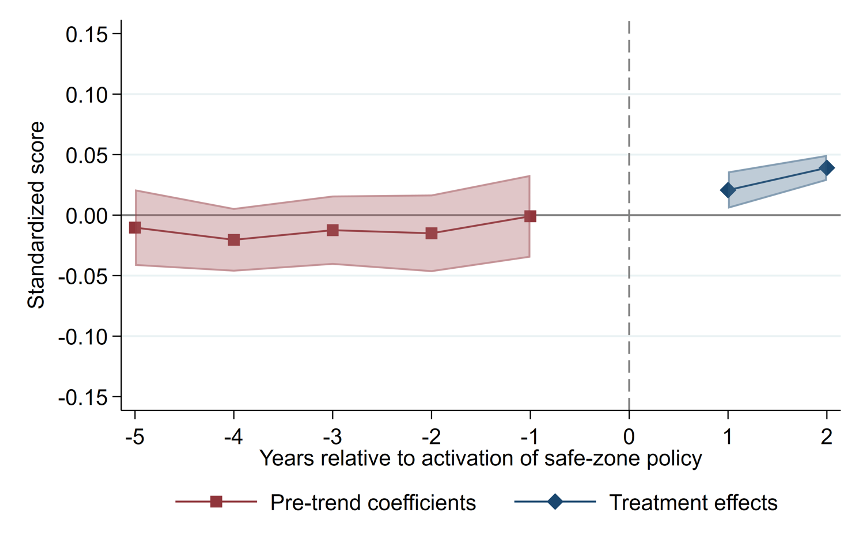
Notes: The figure illustrates the estimated coefficients and 95 percent confidence intervals from the estimation of Equation (2), using the Borusyak, Jaravel, & Spiess (2021) imputation estimator. Period t=0 represents the academic year when a safe-zone policy was first adopted in the school district and is used as a reference.
Figure 4. Event Study for Graduation Likelihood
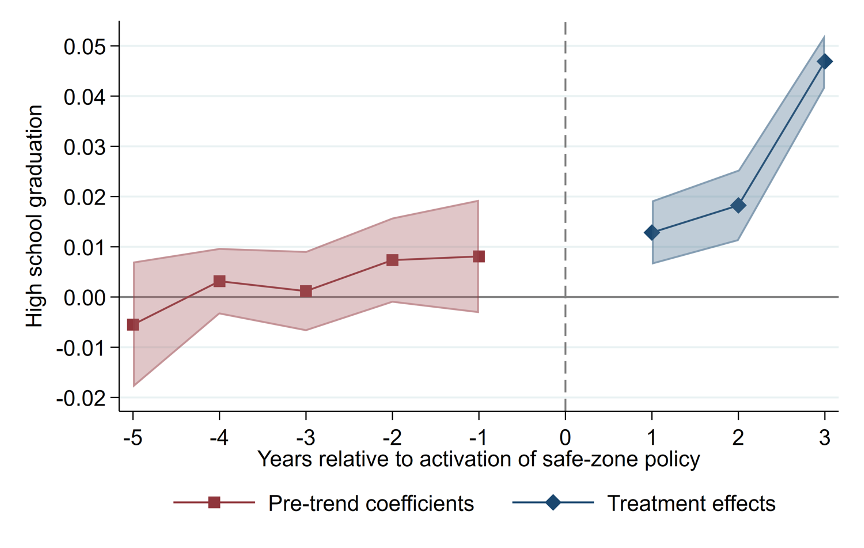
Notes: The figure illustrates the estimated coefficients and 95 percent confidence intervals from the estimation of Equation (2), using the Borusyak, Jaravel, & Spiess (2021) imputation estimator. Period =0 represents the academic year when a safe-zone policy was first adopted in the school district and is used as a reference.
Figure 5. Placebo Check for Standardized Math Test Scores
Notes: The figure illustrates the distribution of placebo estimates generated by randomly changing the policy activation month in Equation (1) and reestimating it 500 times. The gray vertical bars represent the 95 percent confidence interval for the placebo distribution, and the black vertical line indicates the point estimate obtained using the actual policy activation date.
Figure 6. Placebo Check for Standardized ELA Test Scores
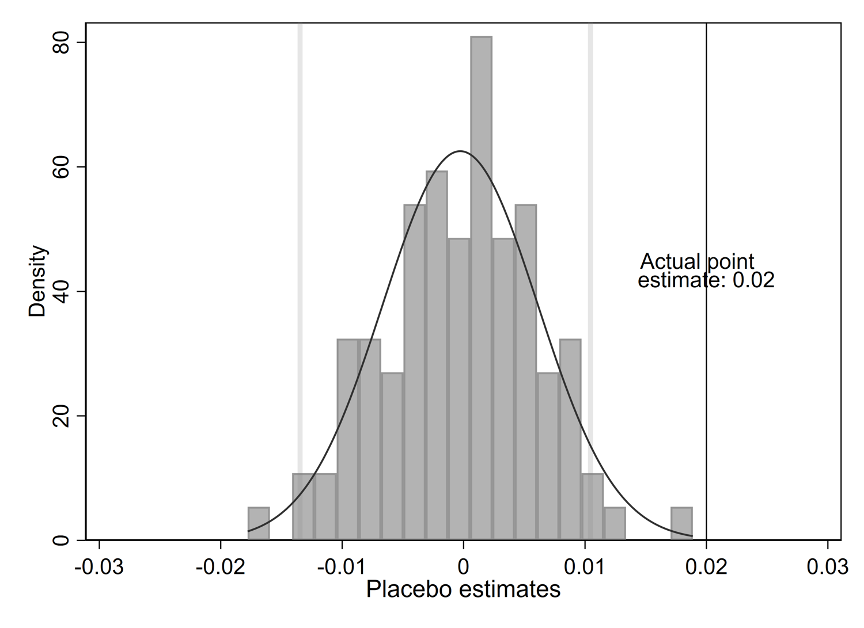
Notes: The figure illustrates the distribution of placebo estimates generated by randomly changing the policy activation month in Equation (1) and reestimating it 500 times. The gray vertical bars represent the 95 percent confidence interval for the placebo distribution, and the black vertical line indicates the point estimate obtained using the actual policy activation date.
Figure 7. Placebo Check for Graduation Likelihood
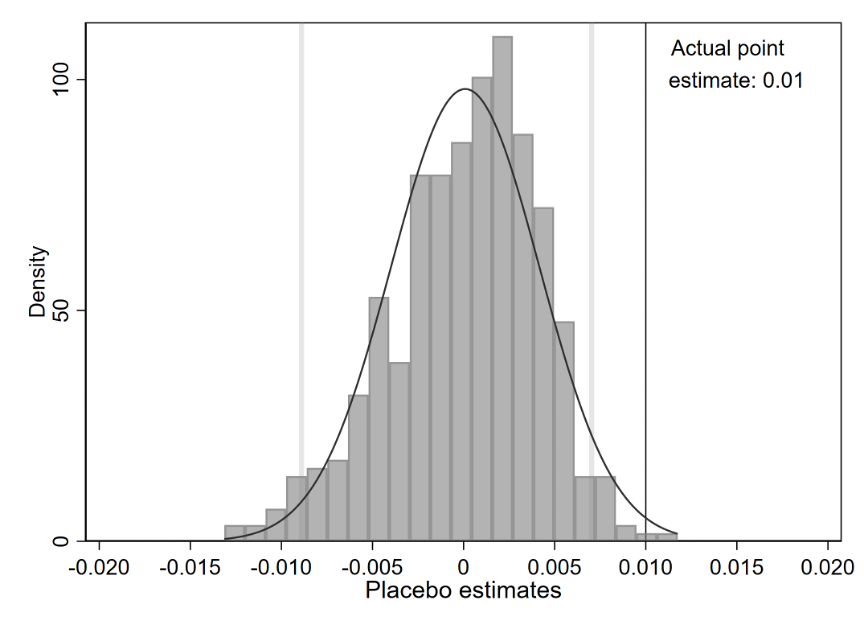
Notes: The figure illustrates the distribution of placebo estimates generated by randomly changing the policy activation month in Equation (1) and reestimating it 500 times. The gray vertical bars represent the 95 percent confidence interval for the placebo distribution, and the black vertical line indicates the point estimate obtained using the actual policy activation date.
Appendix
Figure A1. Propensity Score for Policy Activation with the Test Scores Sample by School District
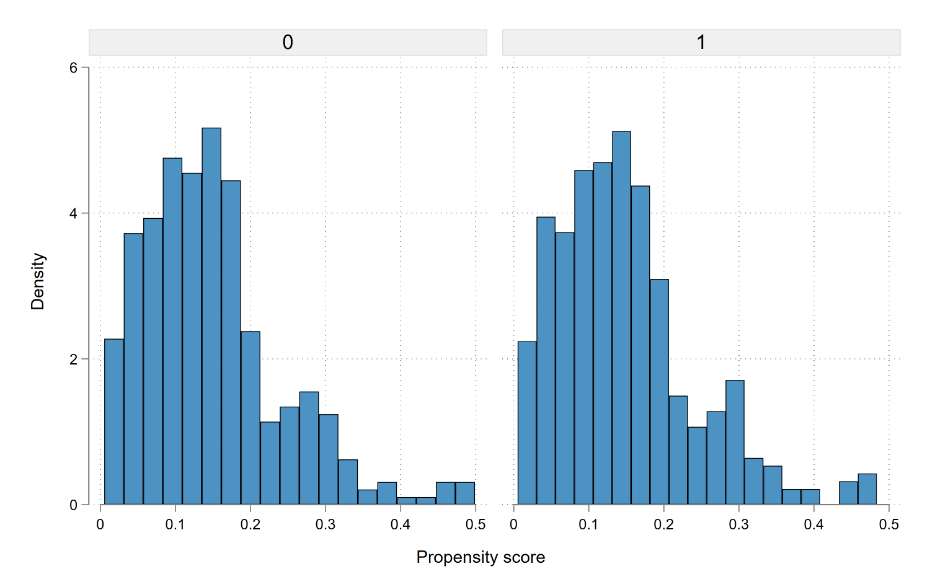
Notes: The figure plots the propensity score distribution for treated (right) and nontreated (left) school districts in the region of common support.
Figure A2. Propensity Score for Policy Activation with the Graduation Sample by School District
Notes: The figure plots the propensity score distribution for treated (right) and nontreated (left) school districts in the region of common support.
Figure A3. Adoption of Individual Safe-Zone Policy Components by School District
Notes: The figure is created by the authors using data from the California Department of Education, the National Education Association, and individual school districts’ boards of education. The map shows the individual safe-zone policy components that each school district activated.
References
Allen, B., Cisneros, E. M., & Tellez, A. (2015). The Children Left Behind: The Impact of Parental Deportation on Mental Health. Journal of Child and Family Studies, 24(2), 386–392. https://doi.org/10.1007/s10826-013-9848-5
American Immigration Council. (2021a). The Cost of Immigration Enforcement and Border Security. Accessed August 2023. https://www.americanimmigrationcouncil.org/research/the-cost-of-immigration-enforcement-and-border-security
American Immigration Council. (2021b). U.S. Citizen Children Impacted by Immigration Enforcement. https://www.americanimmigrationcouncil.org/research/us-citizen-children-impacted-immigration-enforcement
Amuedo-Dorantes, C., Arenas-Arroyo, E., & Sevilla, A. (2018). Immigration enforcement and economic resources of children with likely unauthorized parents. Journal of Public Economics, 158, 63–78. https://doi.org/10.1016/j.jpubeco.2017.12.004
Amuedo-Dorantes, C., Bucheli, J. R., & Martinez-Donate, A. P. (2023). Safe-zone schools and the academic performance of children in mixed-status households: Evidence from the ‘between the lines’ study. Migration Studies, 11(1), 143–173. https://doi.org/10.1093/migration/mnac040
Amuedo-Dorantes, C., & Lopez, M. J. (2017). The Hidden Educational Costs of Intensified Immigration Enforcement. Southern Economic Journal, 84(1), 120–154. https://doi.org/10.1002/soej.12207
Amuedo‐Dorantes, C., & Bucheli, J. R. (2023). Immigration Policy and Hispanic Representation in National Elections. Journal of Policy Analysis and Management, 42(3), 815–844. https://doi.org/10.1002/pam.22444
Arenas‐Arroyo, E., & Schmidpeter, B. (2022). Spillover Effects of Immigration Policies on Children’s Human Capital. The Center for Growth and Opportunity Working Paper, 1–46. https://www.thecgo.org/research/spillover-effects-of-immigration-policies-on-childrens-human-capital/
Becker, G. S., & Chiswick, B. R. (1966). Education and the Distribution of Earnings. American Economic Review, 56(1/2), 358–369. https://www.jstor.org/stable/1821299
Bellows, L. (2019). Immigration Enforcement and Student Achievement in the Wake of Secure Communities. AERA Open, 5(4), 1–20. https://doi.org/10.1177/2332858419884891
Bever, L., & O’Keefe, E. (2017, March 29). A 13-year-old sobbed on camera when ICE took her father away. Now she has a plan. The Washington Post. https://www.washingtonpost.com/news/post-nation/wp/2017/03/29/a-13-year-old-sobbed-on-camera-when-ice-took-her-father-away-now-she-has-a-plan/
Boessenkool, A. (2017). As LA students head back to school, LAUSD has message for immigrants: “We stand together.” Los Angeles Daily News. https://www.dailynews.com/2017/08/14/as-la-students-head-back-to-school-lausd-has-message-for-immigrants-we-stand-together/
Borusyak, K., Jaravel, X., & Spiess, J. (2023). Revisiting Event Study Designs: Robust and Efficient Estimation. Review of Economic Studies. http://arxiv.org/abs/2108.12419
Brabeck, K., & Xu, Q. (2010). The Impact of Detention and Deportation on Latino Immigrant Children and Families: A Quantitative Exploration. Hispanic Journal of Behavioral Sciences, 32(3), 341–361. https://doi.org/10.1177/0739986310374053
Bucheli, J. R., Rubalcaba, J. A.-A., & Vargas, E. D. (2021). Out of the Class and Into the Shadows: Immigration Enforcement and Education Among U.S.-Citizen and Foreign-Born Hispanics. AERA Open, 7, 1–19. https://doi.org/10.1177/23328584211056349
California Department of Education. (2021). CAASPP Description. Accessed October 2022. http://www.cde.ca.gov/ta/tg/ai/cefcaaspp.asp
California Department of Education. (2022). California Safe Haven School Districts List. Accessed January 2022. https://www.cde.ca.gov/eo/in/casafehavendistrictslist.asp
California State Assembly. (2017). AB 699 Educational Equity: Immigration and Citizenship Status. 2017-2018 session. https://leginfo.legislature.ca.gov/faces/billTextClient.xhtml?bill_id=201720180AB699
Callaway, B., & Sant’Anna, P. H. C. (2021). Difference-in-Differences with multiple time periods. Journal of Econometrics, 225(2), 200–230. https://doi.org/10.1016/j.jeconom.2020.12.001
CalSCHLS. (2023). The Surveys. Accessed June 2023. https://calschls.org/about/the-surveys/
Capps, R., Fix, M., & Batalova, J. (2020). Anticipated “Chilling Effects” of the Public-Charge Rule Are Real: Census Data Reflect Steep Decline in Benefits Use by Immigrant Families. https://www.migrationpolicy.org/news/anticipated-chilling-effects-public-charge-rule-are-real
Cardoso, J. B., Brabeck, K., Capps, R., Chen, T., Giraldo-Santiago, N., Huertas, A., & Mayorga, N. A. (2021). Immigration Enforcement Fear and Anxiety in Latinx High School Students: The Indirect Effect of Perceived Discrimination. Journal of Adolescent Health, 68(5), 961–968. https://doi.org/10.1016/j.jadohealth.2020.08.019
Castillo, A. (2017, March 3). Immigrant arrested by ICE after dropping daughter off at school, sending shockwaves through neighborhood. Los Angeles Times. https://www.latimes.com/local/lanow/la-me-immigration-school-20170303-story.html
Chaudry, A., Capps, R., Pedroza, J. M., Castañeda, R. M., Santos, R., & Scott, M. M. (2010). Facing Our Future: Children in the Aftermath of Immigration Enforcement. The Urban Institute, 1–80. http://www.urban.org/sites/default/files/publication/28331/412020-Facing-Our-Future.PDF
Chetty, R., Friedman, J. N., & Rockoff, J. E. (2014). Measuring the Impacts of Teachers II: Teacher Value-Added and Student Outcomes in Adulthood. American Economic Review, 104(9), 2633–2679. https://doi.org/10.1257/aer.104.9.2633
Clark, D., & Royer, H. (2013). The Effect of Education on Adult Mortality and Health: Evidence from Britain. American Economic Review, 103(6), 2087–2120. https://doi.org/10.1257/aer.103.6.2087
Clarke, W., Turner, K., & Guzman, L. (2017). One Quarter of Hispanic Children in the United States Have an Unauthorized Immigrant Parent. Accessed June 2023. https://www.hispanicresearchcenter.org/wp-content/uploads/2019/08/Hispanic-Center-Undocumented-Brief-FINAL-V21.pdf
Dee, T. S., & Murphy, M. (2020). Vanished Classmates: The Effects of Local Immigration Enforcement on School Enrollment. American Educational Research Journal, 57(2), 694–727. https://doi.org/10.3102/0002831219860816
Diamond, J., & Murray, S. (2015, August 17). Trump outlines immigration specifics. CNN. https://www.cnn.com/2015/08/16/politics/donald-trump-immigration-plans/index.html
Dreby, J. (2012). The Burden of Deportation on Children in Mexican Immigrant Families. Journal of Marriage and Family, 74(4), 829–845. https://doi.org/10.1111/j.1741-3737.2012.00989.x
Ed-Data. (2020). Ethnic Diversity Index. Accessed March 2023. https://www.ed-data.org/article/Ethnic-Diversity-Index
Ed-Data. (2022). Comparisons. Accessed March 2023. https://www.ed-data.org/Comparisons?compType=districts
Ed-Data. (2023). California Public Schools. Accessed March 2023. https://www.ed-data.org/state/CA
Ee, J., & Gándara, P. (2020). The Impact of Immigration Enforcement on the Nation’s Schools. American Educational Research Journal, 57(2), 840–871. https://doi.org/10.3102/0002831219862998
Gray-Lobe, G., Pathak, P. A., & Walters, C. R. (2022). The Long-Term Effects of Universal Preschool in Boston. The Quarterly Journal of Economics, 138(1), 363–411. https://doi.org/10.1093/qje/qjac036
Heckman, J. J., & LaFontaine, P. A. (2010). The American High School Graduation Rate: Trends and Levels. Review of Economics and Statistics, 92(2), 244–262. https://doi.org/10.1162/rest.2010.12366
Hughes, T. (2020, February 27). Immigration agents accused of targeting parents taking their kids to school. USA Today. https://www.usatoday.com/story/news/nation/2020/02/27/ice-criticized-detaining-parents-school-trump-enforcement-push/4891529002/
Imberman, S. A., & Kugler, A. D. (2014). The Effect of Providing Breakfast in Class on Student Performance. Journal of Policy Analysis and Management, 33(3), 669–699. https://doi.org/10.1002/pam.21759
Immigrants Rising. (n.d.). Understanding the Sanctuary School & Safe Zone Movement: A Quick Guide for Educators. Accessed June 2023. https://immigrantsrising.org/wp-content/uploads/Immigrants-Rising_Understanding-the-Sanctuary-School-and-Safe-Zone-Movement.pdf
Kirksey, J. J., Sattin-Bajaj, C., Gottfried, M. A., Freeman, J., & Ozuna, C. S. (2020). Deportations Near the Schoolyard: Examining Immigration Enforcement and Racial/Ethnic Gaps in Educational Outcomes. AERA Open, 6(1), 1–18. https://doi.org/10.1177/2332858419899074
Lochner, L., & Moretti, E. (2004). The Effect of Education on Crime: Evidence from Prison Inmates, Arrests, and Self-Reports. American Economic Review, 94(1), 155–189. https://doi.org/10.1257/000282804322970751
Ludwig, J., & Miller, D. L. (2007). Does Head Start Improve Children’s Life Chances? Evidence from a Regression Discontinuity Design. The Quarterly Journal of Economics, 122(1), 159–208. https://doi.org/10.1162/qjec.122.1.159
Lynch, R. G., & Oakford, P. (2014). The Economic Benefits of Closing Educational Achievement Gaps. Center for American Progress, 1–29. cdn.americanprogress.org/wp-content/uploads/2014/11/WinningEconomyReport2.pdf
Morton, J. (2011). Enforcement Actions at or Focused on Sensitive Locations. Accessed June 2023; U.S. Immigration and Customs Enforcement. https://www.ice.gov/doclib/ero-outreach/pdf/10029.2-policy.pdf
Murnane, R. J., Willett, J. B., & Tyler, J. H. (2000). Who Benefits from Obtaining a GED? Evidence from High School and Beyond. Review of Economics and Statistics, 82(1), 23–37. https://doi.org/10.1162/003465300558605
National Center for Education Statistics. (2023). Reading and mathematics scores decline during COVID-19 pandemic. Accessed June 2023. https://www.nationsreportcard.gov/highlights/ltt/2022/
National Education Association. (2022). Safe Zone School Districts. Accessed January 2022. https://www.nea.org/resource-library/safe-zone-school-districts
Olivos, E., & Mendoza, M. (2009). Immigration and Educational Inequity: An Examination of Latino Immigrant Parents’ Inclusion in the Public School Context. Journal of Latino/Latin American Studies, 3(3), 38–53. https://doi.org/10.18085/llas.3.3.k12913266121047h
Pivovarova, M., & Vagi, R. (2020). Better schools or different students? The impact of immigration reform on school-level student achievement. The Social Science Journal, 1–18. https://doi.org/10.1016/j.soscij.2019.05.014
Potochnick, S., Chen, J.-H., & Perreira, K. (2017). Local-Level Immigration Enforcement and Food Insecurity Risk among Hispanic Immigrant Families with Children: National-Level Evidence. Journal of Immigrant and Minority Health, 19(5), 1042–1049. https://doi.org/10.1007/s10903-016-0464-5
Rojas-Flores, L., Clements, M. L., Hwang Koo, J., & London, J. (2017). Trauma and psychological distress in Latino citizen children following parental detention and deportation. Psychological Trauma: Theory, Research, Practice, and Policy, 9(3), 352–361. https://doi.org/10.1037/tra0000177
San Francisco Unified School District. (2021). Student and Family Handbook: 3.6.6 Rights of Undocumented Students. Accessed January 2022. https://www.sfusd.edu/student-and-family-handbook
Santillano, R., Potochnick, S., & Jenkins, J. (2020). Do Immigration Raids Deter Head Start Enrollment? AEA Papers and Proceedings, 110, 419–423. https://doi.org/10.1257/pandp.20201113
Selk, A. (2017, March 4). He dropped his daughter off at school. Minutes later, immigration agents took him away. The Washington Post. https://www.washingtonpost.com/news/post-nation/wp/2017/03/04/he-dropped-his-daughter-off-at-school-minutes-later-immigration-agents-took-him-away/
Smith, H. R. (2021). Immigration Arrests in the Interior of the United States: A Primer. Congressional Research Service, LSB10362. https://crsreports.congress.gov/product/pdf/LSB/LSB10362
State Board of Education. (2022). California ESSA Consolidated State Plan. Accessed October 2022; California Department of Education. https://www.cde.ca.gov/re/es/
Stoltz Chinchilla, N., Hamilton, N., & Loucky, J. (2009). The Sanctuary Movement and Central American Activism in Los Angeles. Latin American Perspectives, 36(6), 101–126. https://doi.org/10.1177/0094582X09350766
Torbati, Y. (2018, September 22). Trump administration moves to restrict immigrants who use public benefits. Reuters. https://www.reuters.com/article/us-usa-immigration-benefits/trump-administration-moves-to-restrict-immigrants-who-use-public-benefits-idUSKCN1M20YP
Torpey, E. (2021). Education Pays, 2020. In Career Outlook. U.S. Bureau of Labor Statistics. https://www.bls.gov/careeroutlook/2021/data-on-display/education-pays.htm
U.S. Department of Education. (2021). Education in a Pandemic: The Disparate Impacts of COVID-19 on America’s Students. https://www2.ed.gov/about/offices/list/ocr/docs/20210608-impacts-of-covid19.pdf
U.S. Department of Homeland Security. (2014). Fiscal Year 2014 ICE Enforcement and Removal Operations Report. https://www.ice.gov/doclib/about/offices/ero/pdf/2014-ice-immigration-removals.pdf
U.S. Immigration and Customs Enforcement. (2015). Fiscal Year 2015 ICE Enforcement and Removal Operations Report. U.S. Immigration and Customs Enforcement. https://www.ice.gov/removal-statistics/2015
U.S. Immigration and Customs Enforcement. (2018). Fiscal Year 2018 ICE Enforcement and Removal Operations Report. https://www.ice.gov/features/ERO-2018
University of California Academic Senate. (2020). Report of the UC Academic Council Standardized Testing Task Force (STTF). Accessed October 2022. https://senate.universityofcalifornia.edu/_files/underreview/sttf-report.pdf
Wang, J. S.-H., & Kaushal, N. (2019). Health and Mental Health Effects of Local Immigration Enforcement. International Migration Review, 53(4), 970–1001. https://doi.org/10.1177/0197918318791978
Wessler, S. F. (2011). Shattered Families: The Perilous Intersection of Immigration Enforcement and the Child Welfare System. Applied Research Center, 1–65. https://www.raceforward.org/research/reports/shattered-families
Young, M.-E. D. T., Chen, L., Sudhinaraset, M., Saadi, A., Kietzman, K. G., & Wallace, S. P. (2022). Cumulative Experiences of Immigration Enforcement Policy and the Physical and Mental Health Outcomes of Asian and Latinx Immigrants in the United States. International Migration Review, 019791832211267. https://doi.org/10.1177/01979183221126726
Zayas, L. H., Aguilar-Gaxiola, S., Yoon, H., & Rey, G. N. (2015). The Distress of Citizen-Children with Detained and Deported Parents. Journal of Child and Family Studies, 24(11), 3213–3223. https://doi.org/10.1007/s10826-015-0124-8
Zayas, L. H., & Gulbas, L. E. (2017). Processes of Belonging for Citizen-Children of Undocumented Mexican Immigrants. Journal of Child and Family Studies, 26(9), 2463–2474. https://doi.org/10.1007/s10826-017-0755-z