
Introduction
Large wildfires, common in remote areas of the western United States, have been burning across the country more frequently and with more devastating effects over the past two decades. According to the National Interagency Coordination Center (NICC), the average annual number of acres burned each year increased by almost 200% between 2000 and 2017 (McCoy and Walsh (2018)). Westerling (2016) finds that this increase can at least be partially attributed to earlier spring snow melt resulting from climate change. Fire suppression, a fire management strategy widely used by the US Forest Service throughout the last century, is also thought to have contributed to the increased severity of recent wildfire seasons (Davis and Parks (2010)). Perhaps most importantly, enormous increases in the number of homes located in wildland urban interface (WUI)1The US Fire Administration defines WUI as the zone of transition between unoccupied land and human development and the area where structures and other human development meet or intermingle with undeveloped wildland or vegetative fuels. areas have contributed to the devastation caused by recent wildfires (Radeloff et al. (2018)). As of 2020, 50 million homes in the United States are located in WUI areas. Every three years, another one million houses are added to these areas (Burke et al. (2020)).
The amount of damage caused by individual wildfires can be enormous. In 2018, more than 18,000 residential structures were destroyed by wildfires that burned almost 9 million acres across the country.2https://www.nfpa.org/Public-Education/Fire-causes-and-risks/Wildfire The most catastrophic fire in 2018, the Camp Fire in Butte County, CA, caused the loss of 85 lives and 18,804 structures. The damages caused by this fire alone are estimated to total about $10 billion. Even when wildfires do not lead to the loss of lives or structures, they often require large-scale evacuations and can significantly disrupt an area’s economic activity and affect the livelihood of people in the area.
While wildfires inflict large damage each year, their destruction is significantly reduced and in many cases even adverted by firefighting efforts. This comes at a large price tag: Baylis and Boomhower (2022) estimate that direct firefighting cost by federal agencies alone for 1985–2019 totaled $48 billion. Given the combination of damage and disruption and the influx of local, state, and federal funds caused by wildfires, it is not immediately clear how local net migration is affected by a wildfire. Yet, any impact on net migration has the potential to significantly shape wildfire-affected areas.
In this paper, I estimate the impact of wildfires on ZIP code–level net migration and the socioeconomic composition of the population. Existing research on migration in response to a climate change or natural disaster, often across countries or within foreign countries, does not provide a clear prediction of the impact of a disaster on migration patterns.3For example, Cattaneo and Peri (2016) evaluate the migration response to raising temperatures and find increased out-migration from rural areas as a result. In countries with lower median incomes, an increase in temperature leads to a decrease in out migration. These findings suggest that financial means matter for disaster migration. A number of studies have found that international migration may be unaffected or reduced by natural disasters (Beine, Noy, and Parsons (2019); Beine and Parsons (2015); Cattaneo and Peri (2016); DeWaard and Nawrotzki (2018)). A different set of papers (Mahajan and Yang (2020); Spitzer, Tortorici, and Zimran (2020); Gr´ada and O’Rourke (1997)) finds that disasters and other economic shocks increase migration as migration can provide an opportunity for affected individuals to improve their economic situation My analysis provides specific insights for the impact of wildfires, a natural disaster that has been and will be increasingly affecting the lives of millions of Americans each year. Given the close linkage of people’s migration decisions to local home and labor market conditions, I also consider the impact of a wildfire on home values and total annual payroll in an affected ZIP code. Since the majority of moving within the US occurs within counties, I am likely able to estimate a more accurate impact on net migration than existing research by conducting my analyses at the ZIP code level.
I use GIS mapping software to overlay perimeter data of all wildfires in the United States from 2000–18 with a granular mapping of wildfire risk and population estimates. This allows me to determine when a ZIP code is directly or very closely affected by a wildfire, as well as the percentage of the ZIP code’s population directly in harms way. It also allows me to focus on ZIP codes that experience exactly one wildfire from 2000–18.
Relative to areas that are repeatedly exposed to wildfires, the experience of these ZIP codes is much more likely to provide insights about how newly expanding WUI areas may be impacted by wildfire. My analysis exploits the differential timing of wildfires across ZIP codes eventually affected by a wildfire and uses both a standard difference-in-differences estimation strategy as well as Callaway and Sant’Anna (2021)’s method to credibly estimate the causal dynamic effects of wildfire exposure in the face of heterogeneous and dynamic treatment effects with a two-way fixed effect model. By conducting a secondary within-county difference-in-differences analysis, I am also able to evaluate if any effects of a wildfire occur directly or indirectly through their impact on the larger local home and labor markets.
I find that a first wildfire in a 19-year period within a ZIP code leads to a roughly 2% increase in my measure of net in-migration, as well as some evidence that it leads to a slight decrease in the share of the low-income population. I find a 5% increase in home values and a 2% increase in total annual payroll. I do not find the same increase in net migration, home values, and payroll when I estimate the impact of a consecutive wildfire. My within-county analysis suggests that impacts of a wildfire spill over to other ZIP code areas within an affected county. Consequently, it appears that any impacts of a wildfire on migration occur indirectly through their impact on the larger local home and labor markets.
Together, these findings suggest that wildfires affect migration by stimulating local economic conditions, but only when a ZIP code has not previously been exposed to a wildfire. This allows for some speculation about the possible mechanisms through which wildfires increase net in-migration. Specifically, the role of local, state, and federal expenditures in the wake of a wildfire and the role of home insurance regulation may be promising avenues for future research. Further, if wildfires lead to a decrease in the share of the low-income population, fire fighting and other fire mitigation expenditures, which Baylis and Boomhower (2022) estimate to increase home developments in high-risk areas by as much as 2.5%, may become increasingly regressive transfers of tax-payer funds.
The main contribution of this paper is to further the understanding of how a wildfire affects net migration. Using county-level disaster data from the Federal Emergency Management Agency (FEMA), Boustan et al. (2020) estimate the migration response to natural disasters, specifically including wildfires, over the course of a decade. The authors find that counties affected by a wildfire experience greater out-migration, lower home prices, and higher poverty rates. However, given that wildfires typically directly and severely affect only a small percentage of the population and homes in an affected county, it is not clear that these county-level estimates can provide insights on the impact wildfires have within a shorter time frame on directly-affected areas. In fact, my analysis suggests that the immediate effect of a wildfire is opposite to the long-run findings by Boustan et al. (2020).
This paper also contributes to the literature that evaluates the effect of wildfires on local labor markets. Using county-level data from 1991 to 2015 on climate-related disasters from the Spatial Hazard Events and Losses Database and economic data from QCEW, Zeenat Fouzia, Mu, and Chen (2020) find a positive impact on employment. Similarly, also using county-level data, Nielsen-Pincus, Moseley, and Gebert (2013) find a positive impact on employment and wages. To my knowledge, only Borgschulte, Molitor, and Zou (2022) consider the impact at a more granular level by using satellite images of wildfire smoke plumes and pollution monitoring data to find a negative effect of smoke exposure on earnings and labor force participation. My paper considers the impact of wildfire exposure, rather than smoke exposure. Given that I find that any local impact of a wildfire is also borne by ZIP codes within the same county, my results confirm the findings by Nielsen-Pincus, Moseley, and Gebert (2013) and Zeenat Fouzia, Mu, and Chen (2020).
Finally, this paper adds to the literature on the impact of wildfires on housing markets. In line with Mueller, Loomis, and González-Cabán (2009) and McCoy and Walsh (2018), I find a decrease in home values following a repeated wildfire. However, I find the opposite effect of first wildfires within a 19-year period.
The remainder of this paper is organized as follows. Section 2 explores the possible economic mechanisms through which net migration may be impacted. Section 3 presents the data used in this project, and section 4 discusses the empirical strategy. I present the results of my analysis in section 5 and explore their robustness in section 6. Section 7 provides a discussion of the results and offers some conclusions.
Theoretical Impact
It is not immediately clear how active exposure to a wildfire might affect net migration or the composition of net migration to or from an area. Most households that are exposed to a wildfire, even if asked to evacuate temporarily, do not experience loss or damage of property. Similarly, local businesses are actively affected only by the most severe fires. Consequently, local economic opportunities may not be impacted by the vast majority of fires, giving people in the area little reason to relocate.
While the threat of a wildfire and the smoke from a fire are likely to cause stress and discomfort to local communities, households in the western United States are routinely exposed to it. Wildfire smoke is becoming a part of life during wildfire season, even when a community is not at all at risk from an active wildfire. It is not clear that such exposure would affect net migration or affect its composition. On the other hand, wildfires have become increasingly devastating and have become an issue of constant worry for many communities in the United States. This suggests that wildfire threat and exposure are likely to play an increasing role in individuals’ migration decisions.
A simple consideration of a number of different mechanisms that may occur when a community is exposed to a wildfire provides testable hypotheses of the short-run impact on the size and composition of net migration.
- If a wildfire leads to a decrease in local firm productivity, perhaps because of temporary closures due to evacuations or smoke, we would expect to observe a decrease in wages, leading to a decrease in net migration. If a decrease in net migration occurs as the result of productivity declines, we might expect to see a decrease in home prices, a variable that is easily observable.
- Instead, we might expect a wildfire to reduce local amenities. At least in the short-run, access to outdoor recreational activities becomes limited and smoke may reduce the quality of life of existing residents. A wildfire might also lead to additional restrictions on homes and activities. In this case, we would also see a decrease in net migration accompanied by a decrease in home values. However, if businesses are not negatively affected by a wildfire, we might expect wages to increase in an attempt to attract workers.
- As a wildfire actively reduces the housing stock or affects a communities’ willingness to allow new developments in WUI areas, a relative decrease in the number of homes would lead to an increase in home values. This would likely cause a decrease in in-migration. In particular in-migration of lower income individuals likely declines.
- A wildfire may also change risk perception and lead to geographic resorting of the population according to individuals’ ex-post risk perception and tolerance. In this case, while net migration may or may not be impacted, in- and out-migration would be increasing.
- Wildfires typically attract a large amount of spending from local, state, and federal agencies, both to fight structural loss and damage and to support recovery efforts. This spending, in particular when fire fighting operations are successful in preventing much of the damage a wildfire could have caused, has the potential to improve local economic conditions. In this case, wages and employment would likely increase locally, as would home values and net in-migration.
- Finally, while difficult to parse out empirically, property insurance is likely to play a role. In many cases, property insurance policies may disincentivize homeowners in areas directly affected by a fire to relocate. Different from other natural disasters such as hurricanes or flooding, almost all basic residential property insurance plans cover losses due to fire. Additionally, homeowner’s insurance is ubiquitously required in the United States.4It is required in all states for homeowners who have a mortgage Property insurance is regulated by each state. For example, in California insurance companies calculate their own rates based on factors such as location, coverage features, home features, local fire protection, and wildfire risk. However, rate changes have to be approved by the California Department of Insurance (CDI) and cannot be based on future expected damages. California’s recent policy initiatives illustrate the tension between protecting homeowners from rate increases and accurately priced risk: In response to increasing rates of non-renewal and greater difficulty for homeowners in WUI areas to find policies, California issued a non-renewal moratorium that prohibits all property insurance companies from canceling or refusing to renew an insurance policy of a homeowner in a ZIP code adjacent to a 2019 or 2020 wildfire perimeter for one year following the fire.55The bulletin pursuant to insurance code section 675.1(b) lists all affected ZIP codes by fire: http://www.insurance.ca.gov/0250-insurers/0300-insurers/0200-bulletins/bulletin-notices-commissopinion/upload/SOEMoratorium-CancelResIns2020.pdf. The 2020 moratorium reportedly covers one fifth of the state’s residential insurance market or about 2.1 million households (Flavelle (2020)). Both the premium regulation and moratorium likely contribute to wildfire risk not being accurately priced into insurance payments. This could potentially lead to increased net migration to areas that experienced a wildfire. On the other hand, once moratoriums for increases in insurance premiums expire, we would likely see those become increased in an effort to capture the updated risk. In this case, a decrease in the demand for homes and a decrease in net migration appear likely, albeit not immediately following a wildfire.
Data
Wildfire Data
I obtain GIS data of the perimeter of each wildfire that occurred in the United States from 2000 to 2018 from the National Interagency Fire Center (NIFC) (GeoMAC). Next, I spatially merge the perimeter data with the USDA Forest Service Fire Modeling Institute’s wildfire hazard potential data (Institute (2022)).
To identify which communities were exposed to a wildfire, I utilize the most granular level of data available in the wildfire hazard potential data, the 50 km2 hexagon data. These data split the entire US into hexagon bins with a side length of about 2.7 miles. For each hexagon, the data provide a wildfire hazard potential (WHP) score between 0 (no risk) and 5 (extremely high risk), as well as a 2010 and 2020 population estimate.
I use GIS software to overlay these data with the wildfire perimeters to determine which hex-bins overlapped with a burn area. If there is overlap, I consider the population of the entire hex-bin to have been exposed to the wildfire. Consequently, wildfire exposure will imply that an individual is estimated to live within at most 5.4 miles of an active burn area.6A 5.4 mile distance would imply that an individual lives at one corner of the hexagon, whereas the wildfire burned at the far side of the hexagon, and barely crossed into it.
In the next step, I overlay the hexagon data with the WHP GIS file at the ZIP code level. This allows me to determine which ZIP codes were affected by a wildfire, as well as the percentage of a ZIP code’s population that was exposed to the fire. Note that this method also accounts for the possibility that a wildfire that burned outside but very close to a ZIP code area might impact this ZIP code. Rather than considering this ZIP code affected by a wildfire only if its perimeter overlaps, I consider the ZIP code affected by a wildfire if its perimeter overlaps with a hexagon bin in which a wildfire occurred. This means that ZIP code–level wildfire exposure implies that a wildfire burned within the ZIP code’s area or within 5.4 miles of the ZIP code’s boundary.
Figure 1 provides a geographical overview of the ZIP code areas that were affected by a wildfire between 2000–18 and in how many of those years they were affected by a wildfire.7Given that my outcome variables are at the annual level, I do not differentiate according to the number of wildfires a ZIP code is exposed to in a given year. Instead, I consider a ZIP code exposed to a wildfire regardless if it was exposed to one or multiple wildfires in that year.
Figure 1: ZIP Code–Level Wildfire Exposure 2000–18
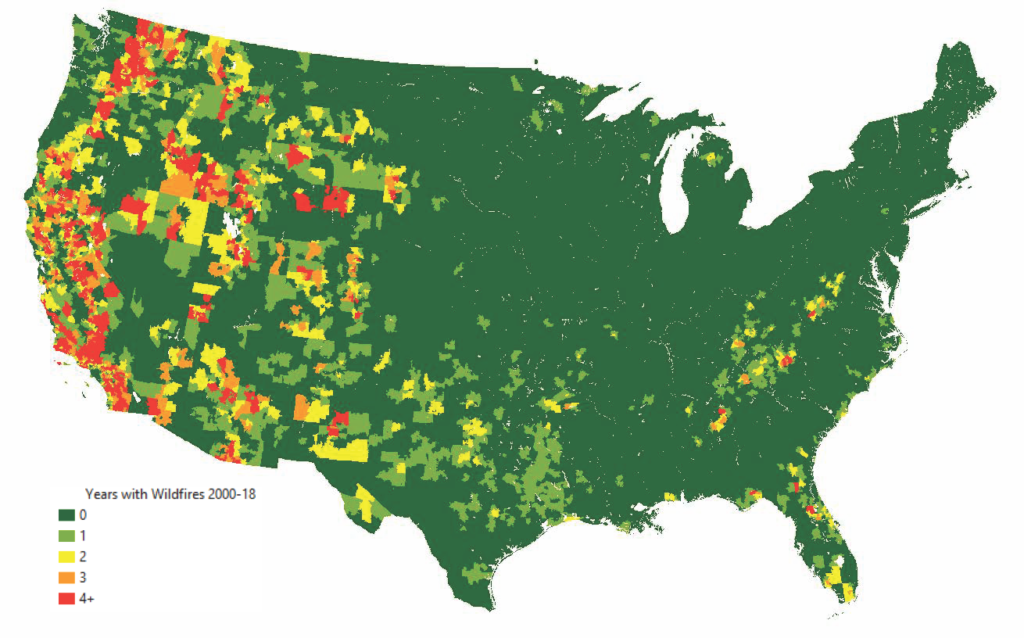
Figure 1 shows the number of years from 2000–18 during which a ZIP code area experienced a wildfire. Exposure is identified at the hex-bin level, where a ZIP code that overlaps geographically with a 50 km2 hex-bin that overlaps with a wildfire perimeter is considered exposed to a wildfire.
ZIP codes that are more frequently exposed to a wildfire on average are considered to be at higher risk for wildfires based on their geographic features and are less populated. Yet, many rural ZIP codes and ZIP codes with high WHS are not affected by a wildfire from 2000–18. Figure 2 provides a visual summary of the relationship between frequency of wildfires, WHP score, and population.
Figure 2: Characteristics of Wildfire Exposed ZIP Codes
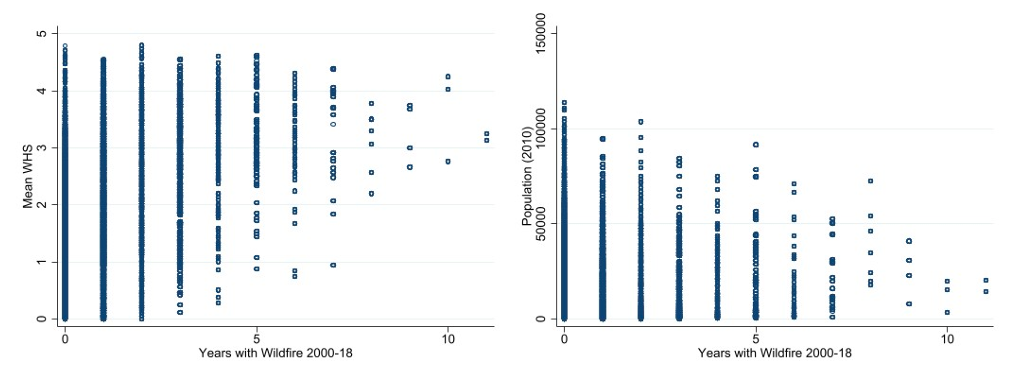
Figure 2 shows that ZIP code areas that experience one or multiple wildfires on average have a higher WHS and lower population than ZIP code areas that are not affected by a wildfire from 2000–18.
The final data set contains 223,013 ZIP codes that did not experience a wildfire from 2000– 18, 15,471 ZIP codes that had one year with wildfire exposure, and 10,975 ZIP codes that had multiple years with wildfire exposure. In other words, more than 10% of ZIP codes in the US have dealt with at least one wildfire in the past two decades.
Net Migration Data
To measure within-country migration, researchers typically have to rely on between-county migration data. However, county-level statistics are likely to miss a significant amount of relocation. According to the 2016 American Community Survey (ACS), only 3.9% of individuals moved between different counties within one year, whereas 11.2% of individuals report living in a different home. In other words, the majority of moving occurs within counties. If a wildfire triggers a change in migration patterns, it is possible that this change cannot be observed with county-level data. Given the lack of more granular migration data in the US, I rely on a number of proxy variables to measure to assess changes in net migration at the ZIP code level. In 2010, the average ZIP code population was just above 1,000 inhabitants. Therefore, while these measures cannot answer whether in- or out-migration is driving any observed changes, they do help paint a picture of how the population and its composition is changing at a granular level.
I use income and tax data from the IRS Individual Income Tax Statistics at the ZIP code level. My main outcome of interest is the annual number of personal exemptions, which approximates the population of a ZIP code. Based on a person’s adjusted gross income, these data also provide the income category of each person so that I can exploit these data to assess changes in the socioeconomic composition of a ZIP code. Specifically, I consider the fraction of low-income returns with an annual household income of $50,000 or less as a secondary outcome variable. Together, these two variables allow me to gain understanding of how a net migration is changing. Figure 3 shows of the means of the two outcome variables from 2010–18 by the number of years that a ZIP code is affected by a wildfire. In this time period, ZIP codes that were not affected by a wildfire saw much lower population growth than ZIP codes that were affected by a wildfire. Conversely, the share of low-income returns declined steadily by about eight percentage points across all types of ZIP codes.
Figure 3: Summary of IRS Outcome Variables
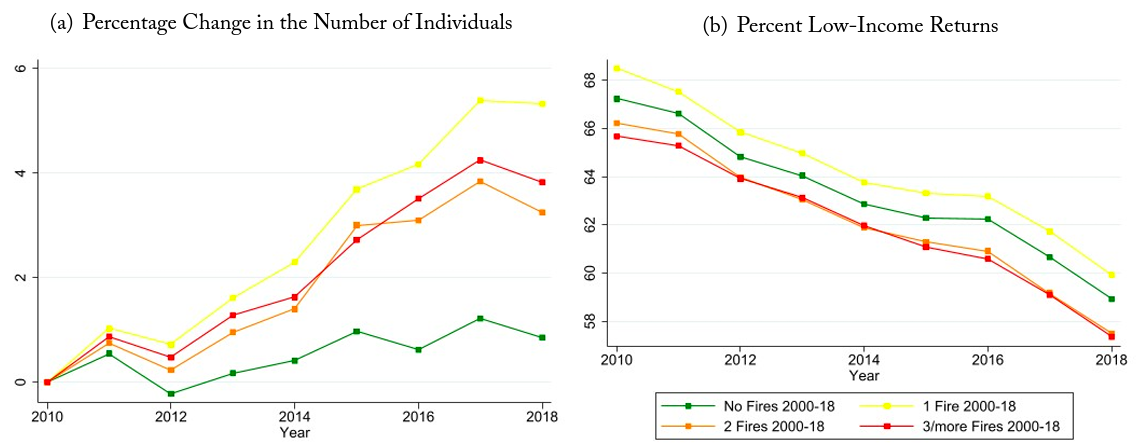
Figure 3 shows the mean percentage change in the number of personal exemptions and the percent low-income returns according to how many years a ZIP code was exposed to a wildfire from 2000–18.
Auxiliary Data
While the IRS data allow me to look at population changes at a very granular level, they do not allow me to evaluate how in- or out-migration separately are being affected. In an attempt to address this shortcoming, I collect additional data at the ZIP code level to gain some insights about the mechanisms of any observed changes in migration. Migration is likely closely linked to the housing and labor markets and by considering the impact of wildfires on these markets, researchers may be able to get a better understanding of in- and out-migration patterns.
I consider the impact of ZIP code–level wildfire exposure on the value of homes in the ZIP code. To do so, I obtain the Zillow Home Value Index (ZHVI) data. These data provide a smoothed, seasonally adjusted monthly measure of the typical home value in the 35th to 65th percentile at the ZIP code level. I calculate the mean of these data to create an annual series. Note that this index values homes that do or do not sell within a given time period, so it is not exclusively a measure of the value of homes that changed ownership. Figure 4 shows the change in this variable over time. Notably, ZIP codes with more frequent wildfire exposure have higher average home values and have seen a faster increase in their average home values over the period of time of interest. I also obtain a measure of a ZIP code’s annual total payroll from the Census Bureau’s County Business Patterns (CBP). Again, a summary of the mean of this variable is shown in figure 4.
Figure 4: Home and Labor Market Data
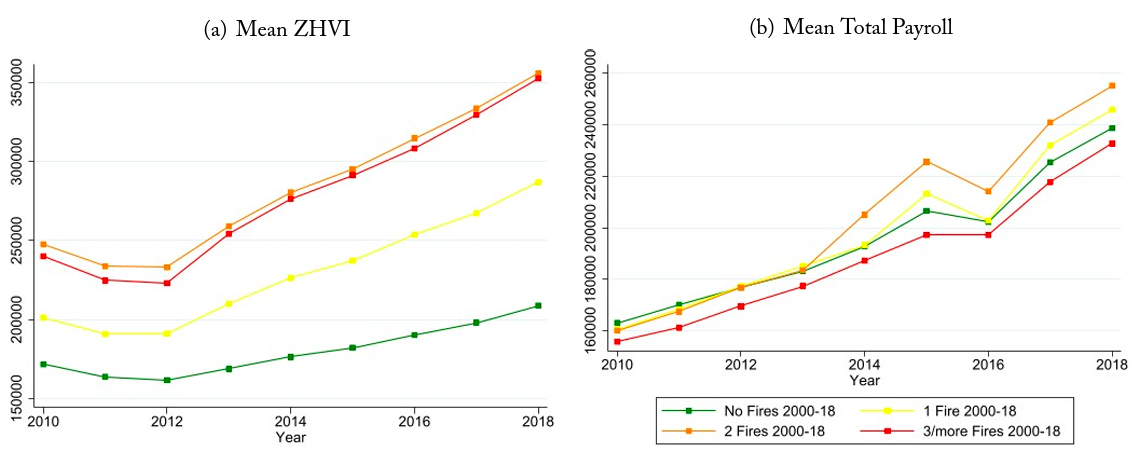
Panel (a) of figure 4 shows the annual mean Zillow Home Value Index (ZHVI) by the number of wildfires a ZIP code was exposed to from 2000–18. The mean annual ZHVI is calculated as the mean of the smoothed, seasonally-adjusted monthly measures of the typical home value in the 35–65th percentile in a given ZIP code. Panel (b) shows the mean total annual payroll obtained from the CBP.
Empirical Strategy
Impact of First Wildfire Exposure
To ensure that I can estimate the impact of a wildfire without it being affected by prior or consecutive wildfires in the same ZIP code (temporal spillover effects), I limit my initial analysis to the set of treated ZIP codes that experience only one wildfire from 2000–18, which occurs during my period of analysis, 2010–18, and comparison ZIP codes that do not experience a wildfire in this 2000–18 period. Figure 5 provides a visual summary of these ZIP code areas. Treated ZIP code areas are shown in red, whereas comparison ZIP code areas are shown in gray. Orange ZIP code areas experience either multiple wildfires from 2010–18, or are exposed to a wildfire from 2000–10. Consequently, all orange ZIP code areas are omitted from this analysis to ensure better identification of the impact of a wildfire in a given year.
Figure 5: Treated and Comparison Group with ZIP Code Fixed Effects
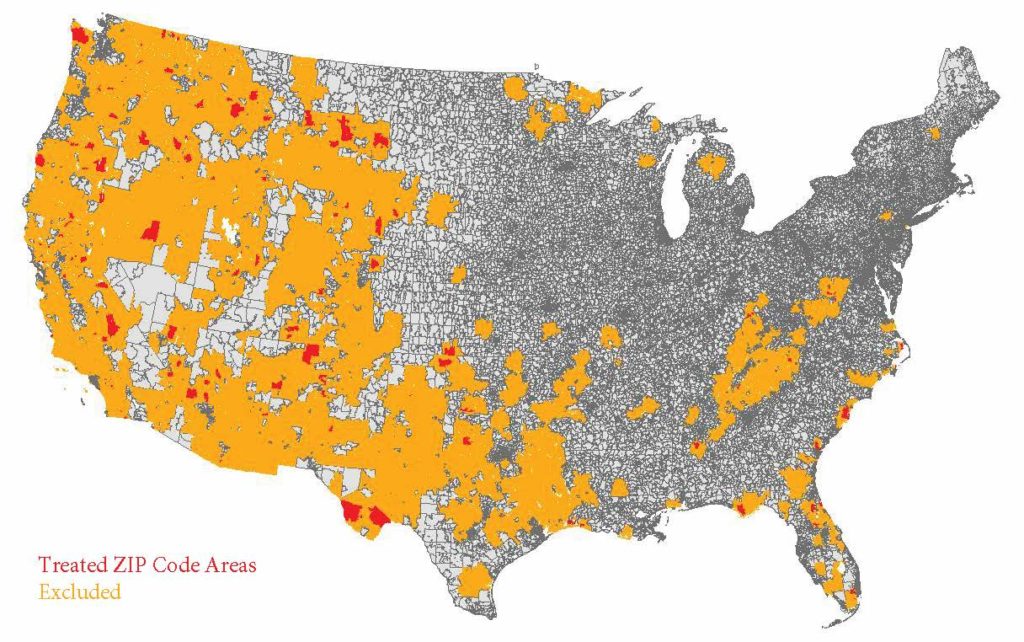
Figure 5 shows in red ZIP codes that experienced exactly one wildfire from 2000–18, which occurred from 2010–18. ZIP codes which experienced a wildfire prior to 2010 or multiple wildfires from 2010–18 are highlighted in orange. All other ZIP codes did not experience a wildfire from 2000–18. Consequently, the initial ZIP code fixed effect analysis compares the outcomes in red ZIP codes to the outcomes in gray ZIP codes.
This analysis allows me to estimate the impact of a wildfire on a specific subset of ZIP code areas in the US. This analysis does not consider the impact of a wildfire in an area that regularly or even routinely deals with wildfire exposure. Instead, it estimates the impact of a wildfire on an area for which a wildfire is less expected. As figure 8 shows, this subset of ZIP codes includes areas with the full range of wildfire hazard scores. In particular, it also includes ZIP codes that are considered to be at almost no risk of a wildfire. Arguably, as wildfire activity in WUI areas in the US is worsening, the impact on areas that do not necessarily expect exposure to wildfires and are not well prepared is particularly interesting.
In my main analysis, I exploit the exogenous timing of wildfires to implement a difference-in-differences (DD) framework, which allows me to compare the change in outcomes in affected ZIP codes to the change in outcomes in not and not-yet affected ZIP codes:
(1) ![\begin{equation*} M_{zt} = \beta_0 + \beta_1 \text{[Wildfire Exposure]}_{zt} + \gamma_t + \delta_z + \epsilon_{tz} \end{equation*}](https://www.thecgo.org/wp-content/ql-cache/quicklatex.com-b19ff35a2c0994ab6b68f12e5810d185_l3.svg "Rendered by QuickLaTeX.com")
Using equation (1), I estimate the impact ZIP code level–wildfire exposure in year t on the outcome variable Mzt in ZIP code z and year t. γt are year fixed effects included to capture changes in the outcome variable over time that are common to all ZIP codes in the analysis. δz are ZIP code fixed effects that capture time invariant differences between ZIP code areas that may affect the outcome variables, such as differences in geographic appeal or differences in access to recreation areas.
While ZIP code fixed effects account for the likelihood that ZIP codes at higher risk for wildfire are different from urban ZIP codes, concerns about potentially different migration trends remain. To account for this, I consider the impact of a wildfire on all ZIP codes as well as the impact of a wildfire on higher wildfire risk ZIP codes only. For this second approach, I only include ZIP codes with an average WHP score greater than two as my treated and comparison groups. This ensures that ZIP codes that likely will never see a wildfire are excluded from my analysis, but it also omits ZIP codes that were considered likely to never see a wildfire yet still experienced one. Figure 8 shows the average WHP score of each ZIP code. ZIP codes shaded in light and dark green are dropped from this second approach.
Regression equation (1) relies on the standard DD assumption for causal identification: In the absence of a wildfire, I require the trend of the outcome variable to be equal in treated and untreated ZIP code areas. Then, β1 can be interpreted as the causal impact of a wildfire on the outcome variable. However, given that this analysis compares not only untreated to treated ZIP codes, but also newly-treated to previously-treated ZIP codes, β1 may be biased when treatment effects are heterogeneous and dynamic (Baker, Larcker, and Wang (2022)).
Wildfires differ vastly in their size, burn length, burn location relative to populated areas, and their ultimate impact depends on a large number of difficult to assess factors such as wind, weather, ability to firefight in a given area, resources, community preparedness etc. Therefore, it is conceivable that the effects of a wildfire are heterogeneous. To account for this possibility, I verify the results of my above analysis with the DD framework with multiple time periods as proposed by Callaway and Sant’Anna (2021).
A major advantage of their method is that it allows me to compare treated ZIP codes only to never-treated or only to not yet–treated ZIP codes. Additionally, I follow their procedure of first calculating the average treatment effects for each group of ZIP codes affected by a wildfire in the same year. Callaway and Sant’Anna (2021) show that when the parallel counterfactual trends assumption holds, we can write these group effects of the average treatment effects of ZIP code areas that experience a wildfire in year fy in year t as the difference of the change in the affected ZIP codes and the not-yet affected ZIP codes:
(2) ![\begin{equation*} ATT(fy,t) = E[M_t - M_{fy-1}| F_{fy}=1] - E[M_t - M_{fy-1}| C=1] \end{equation*}](https://www.thecgo.org/wp-content/ql-cache/quicklatex.com-3b39a8517ad8cdf66e08a317400bb3a9_l3.svg "Rendered by QuickLaTeX.com")
By averaging these group effects weighted by the number of ZIP codes affected in a year, I determine the average treatment effect for all ZIP codes in the analysis relative to the year in which they experience a wildfire. These estimates allow for simple visual presentation that I will exploit. Callaway and Sant’Anna (2021) also allow for calculation of a single point estimate as the average of all average treatment effects in post-fire time periods. Finally, their bootstrapping method allows for reporting of simultaneous confidence intervals while clustering at the ZIP code level.
Addressing Spatial Spillover Effects
Aside from the concern about possible temporal spillover effects discussed above, it is also possible that ZIP code–level wildfire exposure may have spatial spillover effects. Spatial spillover effects may occur for two reasons: First, it is possible that a wildfire that does not burn within a ZIP code’s boundary, but very close to it, impacts this ZIP code because of its proximity to the fire. For example, it may be that the homes in the ZIP code were at risk and evacuations occurred in this ZIP code. Second, nearby ZIP codes that are not threatened or actively affected by a wildfire may be part of the same labor or housing market as an affected ZIP code. In that case, net migration to those ZIP codes may be indirectly impacted by a wildfire in a different ZIP code.
I address the first type of spatial spillover effects in my main analysis by defining ZIP code level–wildfire exposure as a 50 km2 hexagon bin that overlaps with a ZIP code’s boundary having a wildfire within its boundary. This GIS process is explained in section 3.1. I also conduct a robustness check where I limit the treated and comparison group as shown in figure 5 further and exclude any ZIP codes that are adjacent to a ZIP code with a wildfire from 2010–18. Figure 9 shows the ZIP codes that remain in the treated group in red. Orange ZIP codes are excluded from this robustness check, and the comparison group is made up by the gray ZIP codes.
To take into account the second type of spatial spillover effects, I conduct a secondary DD analysis where I compare wildfire-affected ZIP codes in a county before and after the wildfire to ZIP codes within the same county that do not experience the wildfire. I adapt regression equation (1) to include county fixed effects rather than ZIP code fixed effects and estimate the following regression equation:
(3) ![\begin{equation*} M_{zt} = \delta_0 + \delta_1\text{[Treated ZIP]}_z + \delta_2 \text{[Wildfire Exposure]}_{zt} + \gamma_t + \alpha_c + \epsilon_{tz} \end{equation*}](https://www.thecgo.org/wp-content/ql-cache/quicklatex.com-9e10349ea387f0fe06f94df4ff34f4a4_l3.svg "Rendered by QuickLaTeX.com")
Here, δ2 is the impact of a wildfire on a directly-affected ZIP code, relative to indirectly affected ZIP codes within the same county. Figure 6 shows in red ZIP code areas that are directly exposed to a wildfire and in green ZIP code areas that are only indirectly exposed to the same wildfire by nature of being in the same county.88While most ZIP codes lie within one county, some ZIP code boundaries overlap with multiple counties. When this is the case, I code a ZIP code to be in the county in which the highest share of the ZIP code’s population resides. By comparing the results for this parameter with the results for β1 in equation (1), I can shed light on the direct versus indirect results of a wildfire. If my estimates for β1 and δ2 are identical, this would suggest that a wildfire affects net migration mostly through a direct impact on the wildfire-exposed areas. If δ2 is closer to zero than β1, this would suggest that a wildfire affects net migration mostly indirectly. In this case, both ZIP codes affected by a wildfire and ZIP codes not affected by a wildfire, but within the same county and therefore within the same housing and labor markets, are similarly indirectly impacted by a wildfire.
Figure 6: Treated and Comparison Group with County Fixed Effects
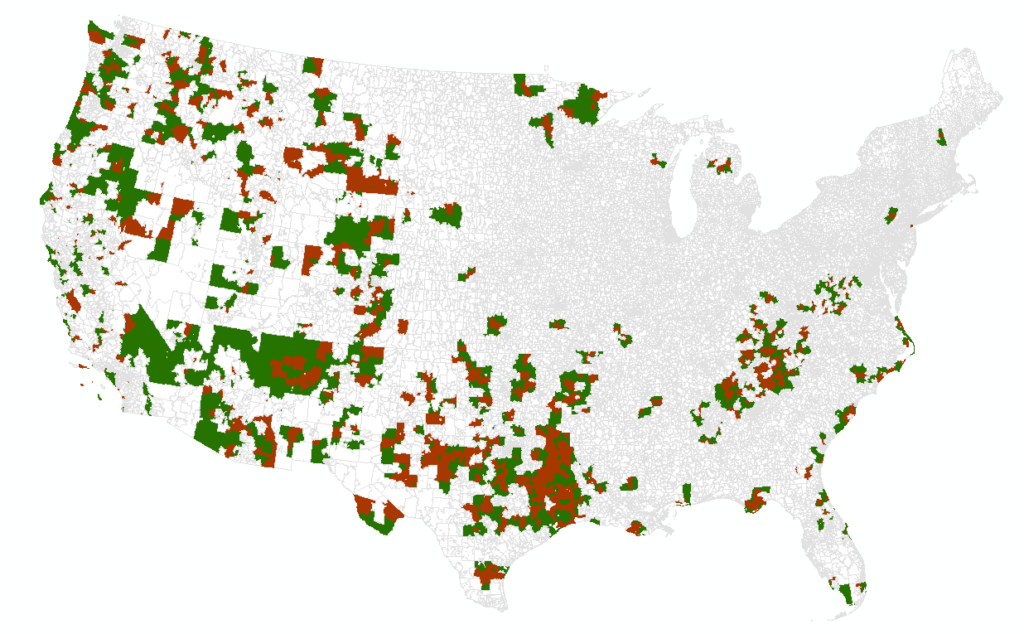
Figure 6 shows in red ZIP codes that experienced exactly one wildfire from 2000–18, which occurred from 2010–18, and in green ZIP codes in the same counties that did not experience a wildfire from 2000–18.
Impact of Repeated Wildfire Exposure
Finally, to address the question of whether a first wildfire in any given area has a greater impact than consecutive fires, I conduct a second round of analyses. As WUI areas are expanding and more areas may be at risk of wildfires, it is important to understand if communities that have never experienced a wildfire are more ill equipped to deal with a wildfire. To test the impact of repeated wildfire exposure, I restrict my sample to ZIP codes that experienced a wildfire from 2000–2005 and compare those that experienced a second wildfire from 2000–18 to those that did not. Figure 7 shows the 130 treated and 313 comparison ZIP codes included in this analysis.
Figure 7: Repeated Wildfires Treated and Comparison Group
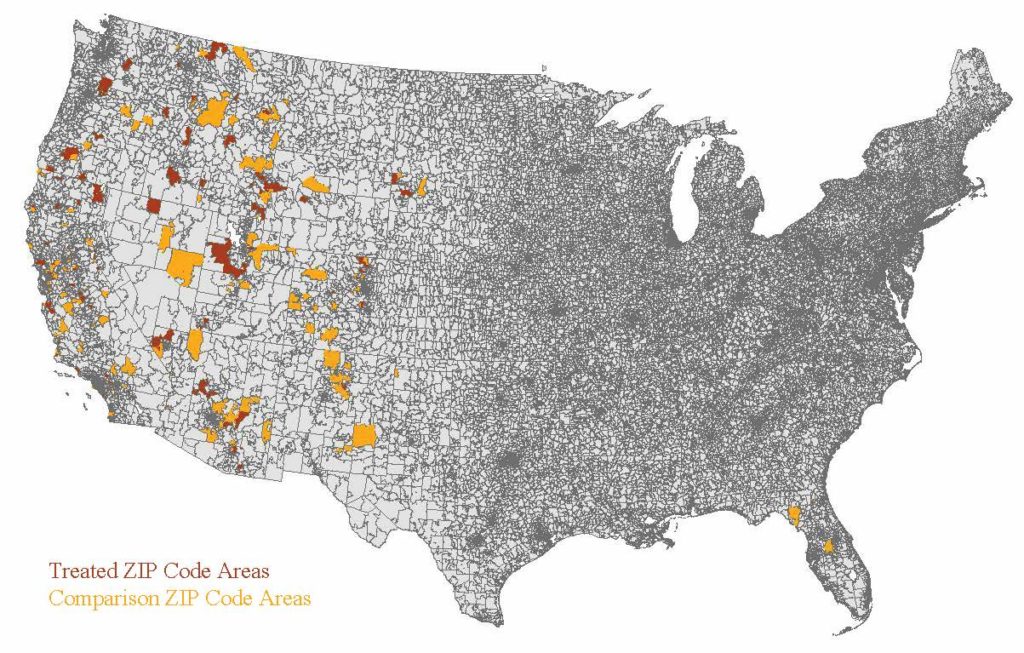
Figure 7 shows in orange ZIP codes that experience a wildfire from 2000–05 and not thereafter and in red ZIP codes that experience a wildfire from 2000–05 and a second wildfire from 2010–18.
Results
Impact on Net Migration
I first evaluate the impact of a first wildfire on the number of individuals who filed their taxes in an affected ZIP code and the fraction of those returns filed with an annual household income of less than $50,000. Table 1 shows the results of the difference-in-differences analyses. Columns 2 and 4 provide the results when ZIP codes with a WHP score of less than two are excluded. I find that wildfire exposure leads to a 1.4% increase in the number of personal exemptions and a 0.1 percentage point change in the fraction of low-income returns in my main specification. When I restrict my analysis to ZIP code areas at higher risk for a wildfire, I find that wildfire exposure leads to a 1.7% increase in the number of personal exemptions and a 0.5 percentage point change in the fraction of low-income returns. Given that the two samples yield essentially the same results, it seems that higher-risk ZIP codes are impacted no differently by a wildfire than lower risk ZIP codes and that the counterfactual trends are likely the same in low- and higher-risk ZIP codes.
Outcome variable Log Personal Exemptions is weighted according to the ZIP code’s population in 2005. The fraction low income is calculated as the fraction of tax returns filed at below $50,000. Each regression includes ZIP code and year fixed effects.
These findings are strengthened by the results of the two-way fixed effects framework as presented in figure A.10, which shows the dynamic, event-study style effects of this analysis and table B.7, which reports the overall average treated on the treated (ATT) parameters. The parameters on the log personal exemptions are larger than with my basic DD estimation and show a roughly 2% increase in the estimated population following a wildfire, regardless if treated ZIP codes are compared only to not yet–treated or never-treated ZIP codes. In contrast, this analysis does not find a statistically significant increase in the fraction of low-income returns. Figure A.10 also provides a visual check for the existence of pre-trends. I do not see any evidence that the outcome variable follows a different trend in the treated ZIP code areas prior to wildfire exposure.
Impact on Housing and Labor Markets
Table 2 shows the results of my main analysis for the impact of a first wildfire on the home value indicator and on total annual payroll. When I include ZIP codes with all WHP scores, I find that a wildfire leads to a roughly 5% increase in home values and a 2% increase in total payroll. When I restrict the analysis to higher-risk ZIP codes, I find a roughly 6% increase in home values and again a roughly 2% increase in payroll. Again, I verify this analysis with the two-way fixed effects estimation. Panels (c) and (d) of figure A.10 show the dynamic effects presented in an event-study framework. Table B.7 shows that the ATT estimates are very similar to the results from the DD analysis.
Each regression includes ZIP code and year fixed effects.
Direct versus Indirect Impact of a Wildfire
In order to differentiate whether the estimated impact of a wildfire on net migration can be interpreted as a direct effect of a wildfire on an affected area or as an indirect effect through its impact on housing and labor markets, I compare my findings from above to the parameter estimates of a within-county comparison. The results for the parameters estimated with equation (3) are shown in table 3.
Each regression includes ZIP code and year fixed effects.
Unlike in my previous analysis, I do not find a statistically significant impact of a wildfire on any of my outcomes of interest when conducting a within-county fixed effects analysis. Again, this analysis compares the change in the outcomes of wildfire-affected ZIP codes to the change in the outcomes of ZIP codes in the same county that were not directly affected by a wildfire. Consequently, the lack of statistically significant results suggests that all ZIP codes within the same county experience a similar shock following a wildfire. This means that the results for the regressions including ZIP code fixed effects should be interpreted as indirect effects of wildfires on affected ZIP codes. In other words, it appears that when a wildfire affects a ZIP code, it impacts net migration in the affected ZIP codes and in indirectly–affected ZIP codes within the same county. I interpret this to imply that wildfires have an impact on regional home and labor markets.
Impact of a Second Wildfire
To evaluate if first wildfires in a ZIP code have a different impact from repeated wildfires, I next present the results of the impact of a second wildfire within my period of analysis. This analysis provides an estimate of how consecutive wildfires may differently affect areas, but also looks at a different subset of ZIP codes with higher WHP scores and are lower population. Table 4 shows the results of this analysis.
Each regression includes ZIP code and year fixed effects.
Unlike with a first wildfire, I do not find that a second wildfire impacts my measure of net migration or the socioeconomic composition in an affected ZIP code. I find that a second wildfire leads to a 2.5% decrease in local home values, and no statistically significant change in the annual total payroll.
Robustness Checks
To address any remaining concerns about potential spatial spillover effects, I adapt my main analysis of the impact of a first fire to exclude treated and comparison ZIP codes in direct proximity to a (different) wildfire. Specifically, I exclude ZIP codes that are adjacent to a wildfire-exposed ZIP code. Figure 9 shows in red the ZIP codes that remain as treated in my analysis and in gray the comparison ZIP codes. All orange ZIP code areas are excluded from the analysis to limit spillover effects. Table 5 shows the results of this analysis. The parameter estimates of this limited analysis lie well inside the confidence intervals for my estimates from the main analysis. In other words, I do not find that my results are biased by spatial spillover effects in my main analysis.
Each regression includes ZIP code and year fixed effects.
Finally, I verify that the impact of a wildfire identified by my analysis is in fact driven by wildfire exposure. To do so, I adapt regression equation (1) to include an interaction term between wildfire exposure and the percentage of a ZIP code’s population that lives in the hexagon areas in which the wildfire burned (actively exposed). Table 6 shows that the impact of a wildfire increases with the fraction of the population actively exposed for all of my outcome variables except the fraction of low-income returns.
Each regression includes ZIP code and year fixed effects.
Conclusion
Over the last few decades, wildfire activity in the United States has been affecting more and more communities. Wildfires lead to large-scale evacuations, loss of structures, and threaten the lives and livelihood of an increasing number of people each year. Yet, it is not well understood how wildfires themselves shape communities and people’s relocation decisions. In this paper, I find that a first wildfire within a ZIP code area leads to a roughly 1.5-2% increase in net in migration.
Given that migration decisions are intrinsically linked to local housing and labor markets, I also test how those are affected by a wildfire. I find that a first wildfire leads to a 5% increase in home values and a 2% increase in annual payroll. Put together these results suggest that wildfires stimulate economic growth in affected areas. Further, these effects don’t seem to be constrained to the area immediately affected by a wildfire, but pass through to other ZIP code areas within an affected county. This suggests that the impact is indirect and operates through equilibrium changes in local markets, rather than through a direct impact to the affected areas only.
My analysis shows some evidence that wildfire exposure also leads to a small decrease in the share of the low-income population. While I cannot shed light on whether this stems from an increase in income levels across the area or changes in the composition of in- or out-migration9Anecdotal evidence, such as by a project at California State University that mapped the relocation of survivors of the 2018 Camp Fire (https://today.csuchico.edu/mapping-a-displaced-population/) suggests that wealthier households may be more likely to be able to rebuild or relocate within the same area, consequently decreasing out-migration in higher income categories. , this finding implies that federal firefighting and other fire mitigation expenditures may become increasingly regressive welfare transfers. Baylis and Boomhower (2022) show that federal firefighting functions as a large transfer of tax-payer funds and estimate that federal firefighting increases home developments in high-risk areas by as much as 2.5%. If wildfires increase the share of higher-income households, these subsidies would become increasingly regressive.
This paper raises a number of questions and potential avenues for future research. First, local, state, and federal expenditures in the wake of a wildfire may play a significant role in stimulating local economies. In many cases, agency spending on firefighting efforts can significantly reduce or even avert loss and damage of private homes. However, such efforts come at a significant price tag. The extent to which this is the driver of the findings of this paper warrants further investigation.
Second, the role played by homeowner’s insurance also deserves closer examination. State regulations do not typically allow for premium increases immediately following a wildfire for areas affected by a wildfire. This may cause these ZIP code areas to become relatively more affordable compared to other ZIP code areas with similar wildfire risk. Policies such as the California non-renewal moratorium may further contribute to the increase in net in-migration. Future research should consider if property insurance policies play a role in creating moral hazard when prices are not allowed to adjust according to changes in wildfire risk.
My analysis does not find the same impact for a second wildfire in the same ZIP code, suggesting that communities with repeated wildfires have a different experience. This is possibly driven by a decrease in home values following a repeated wildfire. While this finding stands in direct contrast with my estimates of the impact on home values of a first wildfire, it is consistent with the impact of repeated wildfire exposure on home values identified by the existing literature. This finding also raises questions about the role of individuals’ risk perception. Champ, Donovan, and Barth (2009) find that most home buyers are not aware of the risk of wildfire at the time of purchase. McCoy and Walsh (2018) show that in the wake of a wildfire, housing values in high-risk zones decrease temporarily relative to low-risk zones and suggest that wildfires may lead to a temporary increase in the awareness of wildfire risk. It is possible that such improved risk perception is more likely to occur with a repeated wildfire, which would help explain the results of my analysis.
A Figures
Figure 8. Average ZIP Code Wildfire Hazard Potential Score
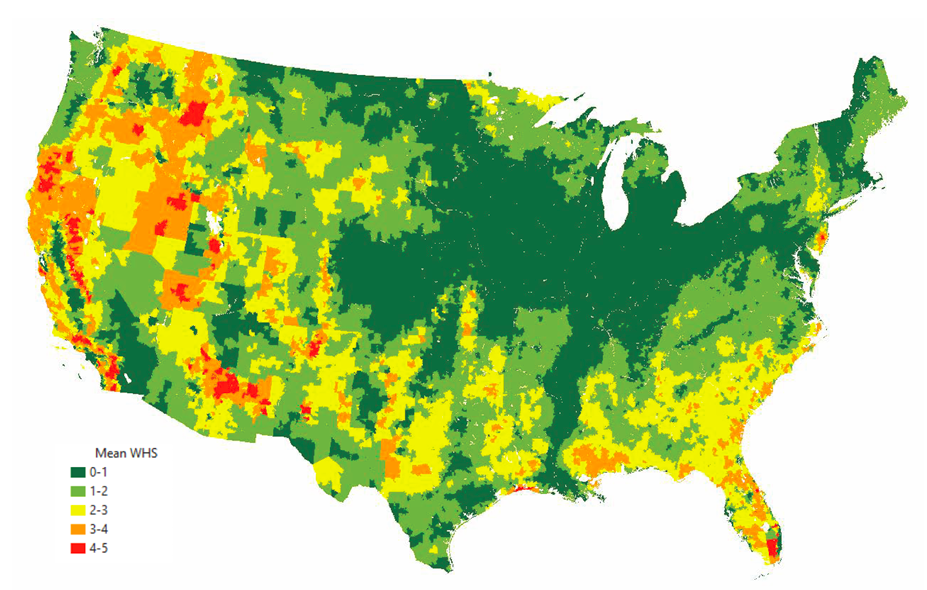
Figure 8 shows the mean wildfire Hazard Potential (WHP) score for each ZIP code. The mean is provided by the USDA Forest Service Fire Modeling Institute’s Wildfire Hazard Data and calculated from the WHP score of each 50 km2 hexagon within a ZIP code.
Figure 9. Treated and Comparison Group when Accounting for Spacial Spillover Effects
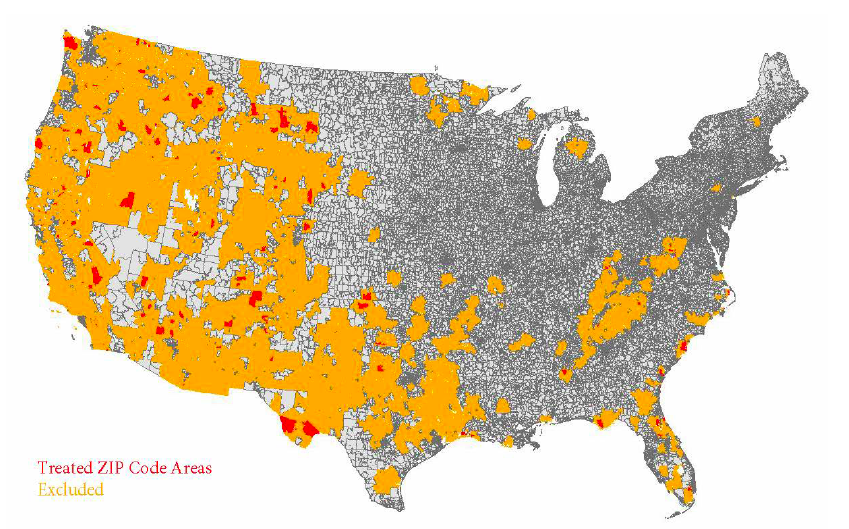
Figure 9 shows the treated (red) and comparison (gray) ZIP code areas for the robustness analysis. The sample is based on the sample shown in figure 9, but all ZIP code areas that are adjacent to a ZIP code with a wildfire from 2010–18 are also excluded from the treated and comparison groups.
Figure 10. Two-Way Fixed Effects Framework
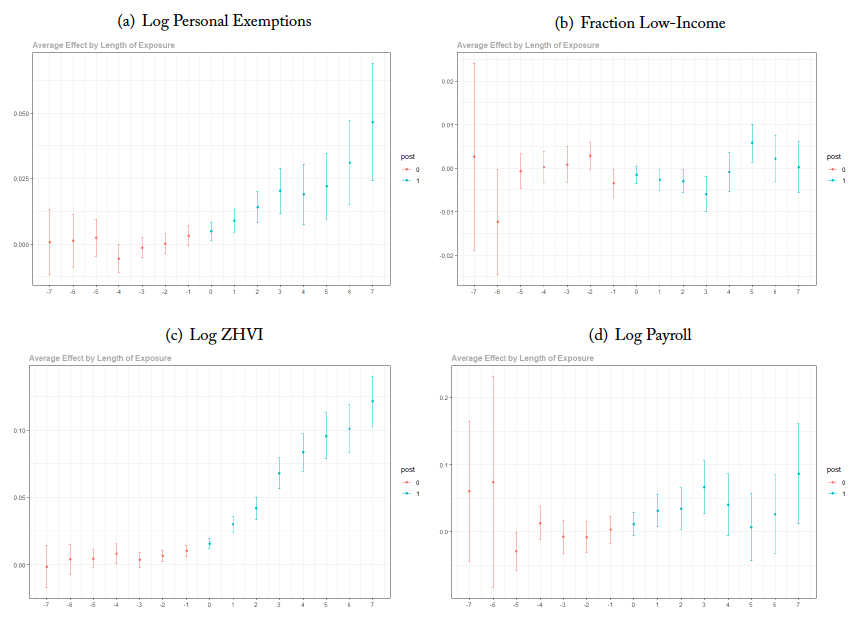
Figure 10 shows the dynamic results of my baseline analysis using the difference-in-differences for multiple time periods framework as proposed by Callaway and Sant’Anna (2021). The figures show the coefficients for the average treatment effect for the ZIP codes in the analysis in years prior (red) and years after (blue) the fire, as well as 95% confidence intervals. The analysis includes ZIP code and year fixed effects. Standard errors are clustered at the ZIP code level, and I follow the bootstrapping procedure proposed by Callaway and Sant’Anna (2021) for inference. All regression results shown in this figure are based on a comparison of treated ZIP codes to never-treated ZIP codes.
B Tables
References
Baker, Andrew, David F Larcker, and Charles CY Wang. 2022. “How much should we trust staggered difference-in-differences Estimates?” Journal of Financial Economics (Forthcoming).
Baylis, Patrick and Judson Boomhower. 2022. “The economic incidence of wildfire suppression in the United States.” American Economic Journal: Applied Economics (Forthcoming).
Beine, Michel and Christopher Parsons. 2015. “Climatic factors as determinants of international migration.” The Scandinavian Journal of Economics 117 (2):723–767.
Beine, Michel AR, Ilan Noy, and Christopher Robert Parsons. 2019. “Climate change, migration and voice: An explanation for the immobility paradox.” (7830).
Borgschulte, Mark, David Molitor, and Eric Zou. 2022. “Air pollution and the labor market: Evidence from wildfire smoke [Unpublished manuscript].” (29952).
Boustan, Leah Platt, Matthew E Kahn, Paul W Rhode, and Maria Lucia Yanguas. 2020. “The effect of natural disasters on economic activity in US counties: A century of data.” Journal of Urban Economics :103257.
Burke, Marshall, Anne Driscoll, Jenny Xue, Sam Heft-Neal, Jennifer Burney, and Michael Wara. 2020. “The changing risk and burden of wildfire in the US [Unpublished manuscript].” (27423).
Callaway, Brantly and Pedro HC Sant’Anna. 2021. “Difference-in-differences with multiple time periods.” Journal of Econometrics 225 (2):200–230.
Cattaneo, Cristina and Giovanni Peri. 2016. “The migration response to increasing temperatures.” Journal of Development Economics 122:127–146.
Champ, Patricia Ann, Geoffrey H Donovan, and Christopher M Barth. 2009. “Homebuyers and wildfire risk: A Colorado Springs case study.” Society & Natural Resources 23 (1):58–70.
Davis, Miller Carol, Brett H and Sean A Parks. 2010. Retrospective fire modeling: Quantifying the impacts of fire suppression. US Dept of Agriculture.
DeWaard, Jack and Raphael J Nawrotzki. 2018. “Modeling migration and population displacement in response to environmental and climate change.” Routledge Handbook of Environmental Displacement and Migration 1:92.
Flavelle, Christopher. 2020. “California bars insurers from dropping policies in wildfire areas.” The New York Times.
(GeoMAC), Geospatial Multi-Agency Coordination Group. 2019. “Historic Perimeters Combined 2000–2018 GeoMAC.” URL https://data-nifc.opendata.arcgis.com/datasets/nifc:: historic-perimeters-combined-2000-2018-geomac/about.
Gráda, Cormac O and Kevin H O’Rourke. 1997. “Migration as disaster relief: Lessons from the Great Irish Famine.” European Review of Economic History 1 (1):3–25.
Institute, USDA Forest Service Fire Modeling. 2022. “USA Wildfire Hazard Potential with Demographics.” URL https://www.arcgis.com/home/webmap/viewer.html?useExisting=1& layers=ce92e9a37f27439082476c369e2f4254.
Mahajan, Parag and Dean Yang. 2020. “Taken by storm: Hurricanes, migrant networks, and US immigration.” American Economic Journal: Applied Economics 12 (2):250–77.
McCoy, Shawn J and Randall P Walsh. 2018. “Wildfire risk, salience and housing demand.” Journal of Environmental Economics and Management 91:203–228.
Mueller, Julie, John Loomis, and Armando González-Cabán. 2009. “Do repeated wildfires change homebuyers’ demand for homes in high-risk areas? A hedonic analysis of the short and long-term effects of repeated wildfires on house prices in Southern California.” The Journal of Real Estate Finance and Economics 38 (2):155–172.
Nielsen-Pincus, Max, Cassandra Moseley, and Krista Gebert. 2013. “The effects of large wildfires on employment and wage growth and volatility in the western United States.” Journal of Forestry 111 (6):404–411.
Radeloff, Volker C, David P Helmers, H Anu Kramer, Miranda H Mockrin, Patricia M Alexandre, Avi Bar-Massada, Van Butsic, Todd J Hawbaker, Sebasti´an Martinuzzi, Alexandra D Syphard et al. 2018. “Rapid growth of the US wildland-urban interface raises wildfire risk.” Proceedings of the National Academy of Sciences 115 (13):3314–3319.
Spitzer, Yannay, Gaspare Tortorici, and Ariell Zimran. 2020. “International migration responses to natural disasters: Evidence from modern Europe’s deadliest earthquake [Unpublished manuscript].” (27506).
Westerling, Anthony LeRoy. 2016. “Increasing western US forest wildfire activity: Sensitivity to changes in the timing of spring.” Philosophical Transactions of the Royal Society B: Biological Sciences 371 (1696):20150178.
Zeenat Fouzia, Sultana, Jianhong Mu, and Yong Chen. 2020. “Local labour market impacts of climate-related disasters: A demand-and-supply analysis.” Spatial Economic Analysis 15 (3):336– 352.