

 Reason
 West Hawaii Today
 National Library of Medicine
 Star Tribune
 Econlib
 TribLive
 SoundCloud
1 Introduction
The sudden emergence and rapid spread of the COVID-19 pandemic in the spring of 2020 incited a variety of public policy responses. Many states in the United States implemented mitigation policies such as “stay-at-home orders” to slow the spread.1For instance, Governor Northam of Virginia issued a statewide “stay-at-home” order for state residents on Monday, the 30th of March, to help contain the pandemic’s outbreak. The order’s full text is available here: https://www.governor.virginia.gov/media/governorvirginiagov/executive-actions/EO-55-Temporary-Stay-at-Home-Order-Due-to-Novel-Coronavirus-(COVID-19).pdf Several states also had or implemented price-gouging regulations that inhibited the degree to which sellers could increase prices during the crisis.2On March 31st, the very next day after the governor’s stay at home orders, the VA attorney general issued a statement announcing stronger crackdowns on price-gouging. Full text of the statement is available here: https://www.oag.state.va.us/media-center/news-releases/1672-march-31-2020-herring-takes-further-steps-to-crack-down-on-price-gouging. Date accessed: July 14, 2020. While mitigation policies primarily sought to decrease social contact among individuals to flatten the infection curve, price-gouging regulation may act against this goal by creating shortages that result in increased consumer searches for goods (Chakraborti and Roberts, 2020a,b; Weitzman, 1991; Deacon and Sonstelie, 1989). This possibility is concerning in the context of the pandemic because higher searches, in turn, may increase interaction between individuals in commercial spaces and undermine mitigation strategies.
This paper examines whether active price-gouging regulation impacted social contacts during the COVID-19 pandemic. We study how price-gouging regulation impacted social contacts in commercial spaces quantified using smartphone location data. Our work informs the literature that forms the basis for the vigorous policy debate surrounding the impacts of price-gouging laws (e.g., Niles (2020); Pan (2020); Chakraborti and Roberts (2020a); Fleck (2014); Snyder (2009); Culpepper and Block (2008); Zwolinski (2008); Montgomery et al. (2007); Brewer (2007)). Further, we contribute to the burgeoning literature on price-gouging specific to the COVID-19 pandemic (e.g., Chakraborti and Roberts (2020a,b); Cabral and Xu (2020); Boshoff (2020)).
Our results are striking. Consistent with the increased search hypothesis, we find that price-gouging regulation is associated with significantly more interpersonal contacts, and that this regulation-induced increase in contacts, in turn, increased COVID-19 cases and deaths during the first wave of the COVID-19 pandemic in the United States. We find that, in the average state with active price-gouging
regulation, the regulation increased average daily COVID-19 confirmed cases by between 57 and 184 cases per day between 3 and 10 days after implementation. We also find that in such states, the regulation increased average daily COVID-19 deaths by between 12 and 17 deaths between 20 and 28 days after implementation. Our data also allow for examination of heterogeneity in treatment effects across income quartiles. We find that price-gouging regulation significantly increased social contacts in all four income quartiles, but the impacts are significantly smaller in the highest income quartile.
2 Background
Forty-two US states activated some type of price-gouging regulation during the COVID-19 pandemic between February and April 2020. Thirty-four of these states had already enacted price-gouging regulation through legislation long before the COVID-19 pandemic began (Tarrant, 2015). For example, Louisiana most recently revised its price-gouging regulation in 2010.3See LA Rev Stat § 29:732: http://legis.la.gov/legis/Law.aspx?d=85680 Date accessed: July 14, 2020. Preexisting price-gouging regulations in most cases activate upon implementation of an emergency declaration by the governor of the state or another official;4See King & Spalding law firm’s COVID-19 Survey of Federal and State Price Gouging Laws:
https://www.kslaw.com/pages/covid-19-survey-of-federal-and-state-price-gouging-laws Date accessed: July 21, 2020. and all US states declared a state of emergency during the pandemic, including those without any form of price-gouging regulation. Importantly, individuals who live in states where price-gouging regulation was active during past emergencies are more likely to have experience with the effects of price regulation, and may anticipate those affects (Chakraborti and Roberts, 2020b; Fleck, 2014).
Figure 1. Statewise Distribution of Price-Gouging Laws, and Activation Dates
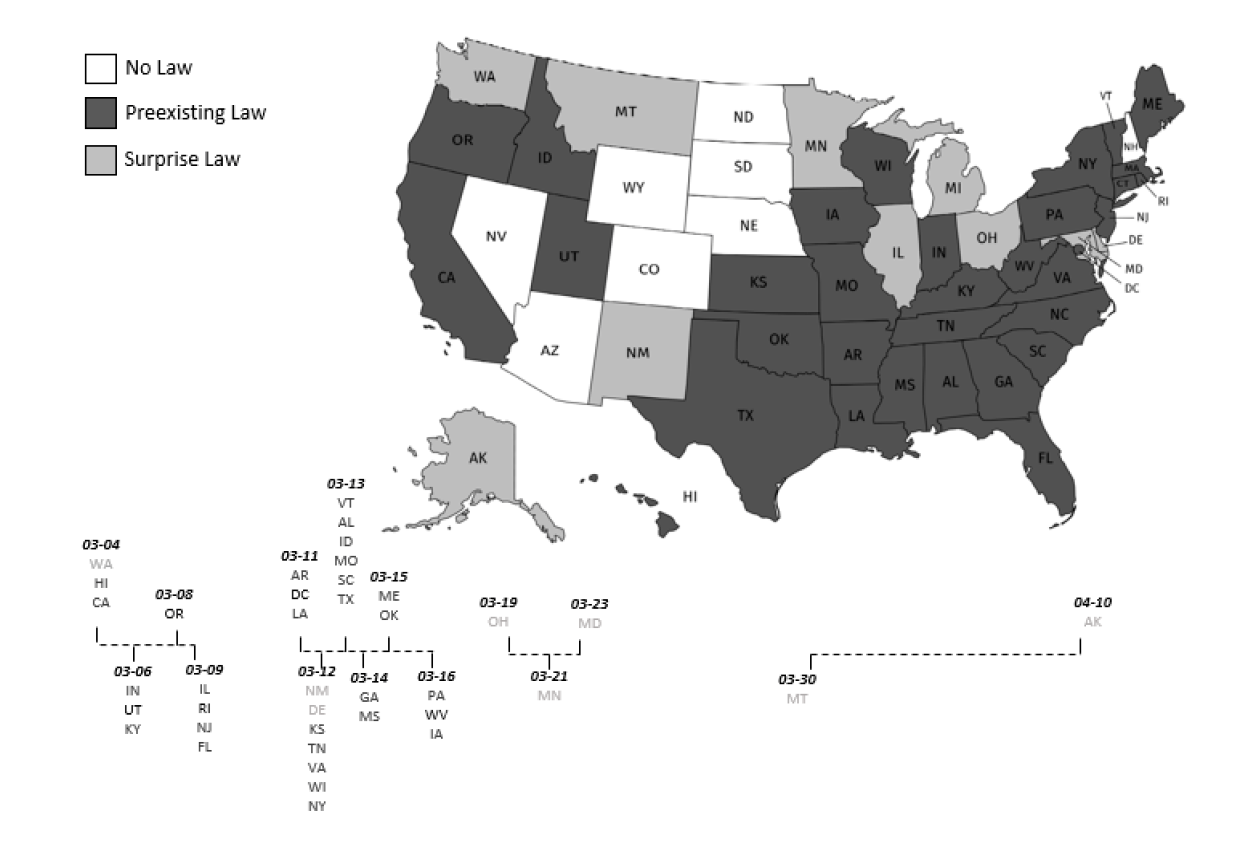
Eight out of the sixteen states that did not have preexisting price-gouging regulations enacted regulations after their COVID-19 emergency declarations.5These were Alaska, Delaware, Maryland, Minnesota, Montana, New Mexico, Ohio, and Washington. See Figure 1 Figure 1 shows the type and dates of activation of state-level price-gouging regulations during the pandemic in the US. Eight states neither had regulatory restrictions on price-gouging before the pandemic nor enacted any in response to the pandemic. These are our control states.6Arizona, Colorado, North Dakota, Nebraska, New Hampshire, Nevada, South Dakota, and Wyoming. See Figure 1.
The specifics of price-gouging regulation vary across states. Some states impose criminal penalties for price-gouging while others only allow for civil actions. We assume that price-gouging regulations had similar effects on sellers’ propensity to change quantities and prices regardless of these differences. Tarrant (2015) provides detailed historical background related to price-gouging laws in states susceptible to hurricanes, and emphasizes that many of these states’ laws were passed in reaction to natural disasters that led to large price increases for certain goods, like retail gasoline. A similar trend occurred during the pandemic with the sudden implementation of price-gouging regulation in eight states.7See also the King & Spalding law firm’s COVID-19 Survey of Federal and State Price Gouging Laws for the latest updates on price-gouging legislation: https://www.kslaw.com/pages/covid-19-survey-of-federal-and-state-price-gouging-laws
Date accessed: July 21, 2020.
Economists have pointed out that price-gouging regulation could lead to binding price ceilings causing shortages, consumer waiting, and increased consumer search (Culpepper and Block, 2008; Brewer, 2007; Montgomery et al., 2007; Weitzman, 1991; Barzel, 1974). Empirical evidence on the effects of price-gouging regulations is relatively rare due to lack of natural experiments allowing measurement of price-gouging regulation effects. Montgomery et al. (2007) estimates that price ceilings resulting from price-gouging regulation would lead economic damages in the two-month period following hurricanes Rita and Katrina to increase by $1.5–2.9 billion. Tarrant (2015) finds that price-gouging regulations decreased economic growth after hurricanes but states quickly recovered after emergency declarations expired.
Recently, Chakraborti and Roberts (2020a) show that online searches, measured by Google Shopping Trends, for hand sanitizer and toilet paper were significantly larger in states with price-gouging legislation compared to states without regulation during the early stages of the COVID-19 pandemic, which indicates such goods may have experienced larger shortages in states with anti-gouging regulation. In another paper, Chakraborti and Roberts (2020b) show that preexisting price-gouging regulation had larger impacts on online searches than surprise regulation, and they attribute this to individuals’ experience with and anticipation of price-gouging regulation effects in preexisting-regulation states. To our knowledge, Cabral and Xu (2020) is the only other study that investigates price gouging in the US in the context of the COVID-19 pandemic. Using consumer reviews as a measure of seller reputation on Amazon, they find evidence indicating that seller reputation has a moderating effect on a seller’s propensity to increase prices substantially following a demand shock.
Individuals in the US and around the world decreased social contacts during the COVID-19 pandemic in a variety of ways and for a variety of reasons. Engle et al. (2020) show that COVID-19 infection prevalence, official stay-at-home orders, larger over-65 populations, and lower shares of Republican voters were all associated with reduced mobility during the COVID-19 pandemic. We hypothesize that price-gouging regulation could also have impacted individuals’ social contacts by causing shortages that led to increased physical searches for goods. These increased physical searches could lead COVID-19 to spread at an increased rate by increasing interpersonal contacts.
The impact of price-gouging regulation on social contacts may be less severe on higher-income households. Shortages induced by price-gouging regulation will have a smaller impact to the extent that individuals have substitution opportunities. For example, higher-income households may be able to stock up ahead, hire delivery services for certain essential goods, or have more opportunities for online searching and ordering. And, while high-income individuals are more likely to use these shopping services like Instacart to get their groceries, lower-income individuals are more likely to work for Instacart as shoppers8See this LA Times article:
https://www.latimes.com/business/technology/story/2020-04-10/instacart-workers-coronavirus-strike-work-conditions. who are exposed to more social contact. Further, retail-sector employees, in general, are likely to be from lower-income groups,9See the relevant BLS data here: https://www.bls.gov/ooh/sales/retail-sales-workers.htm. Date accessed July 14, 2020. who might experience a relatively large increase in social contacts if price-gouging leads to more physical searches for goods as other individuals search more.10See this LA Times article: https://www.latimes.com/business/technology/story/2020-04-10/instacart-workers-coronavirus-strike-work-conditions.
The COVID-19 pandemic offers a rare opportunity to analyze the effects of price-gouging regulation. Over the years, more and more states have adopted price-gouging regulation, and states that implement price regulation suddenly tend to pass longer term measures later. This means opportunities to evaluate the impact of price-gouging regulation by comparing states with and without such regulation are becoming more rare. Price-gouging regulations during emergency events in the past have tended to be localized to a small number of states like Louisiana and Texas during hurricanes. On the other hand, COVID-19 affected all US states, and all US states declared emergencies, while some states did not introduce price-gouging regulation. Further, states implemented price-gouging regulation on different days during the pandemic. We exploit this spatial and temporal variation in price-gouging regulation using over 19,000 state-day observations of social contact data to estimate the impacts of that regulation on social contacts. The next section discusses how.
3 Methods
3.1 Data
Our sample consists of 4,944 state-day observations from the contiguous US states with four income-quartile observations per state-day. The sample runs from January 22, 2020 to May 3, 2020. The limiting data series in our sample are COVID-19 cases provided by John Hopkins University, which are available from January 22, 2020 onward, and we collected our data on May 3, 2020. This start date ensures our sample contains observations from every state in the contiguous US before an emergency was declared in any state, and the pandemic’s initial spread in the US. Summary statistics for key variables are shown in Table 3 in the Appendix.
We measure social contacts by state and day using the device exposure index (DEX) constructed from smartphone location data by Couture et al. (2020). The DEX measures state-level “average exposure of smartphones to each other within commercial venues” (Couture et al., 2020). Couture et al. (2020) construct the state-level DEX series from individual smartphone data to answer the following question: How many distinct devices does the average device in state s encounter at close proximity during simultaneous visits to commercial venues on day d? The DEX series only aggregates over a subset of commercial venues that “are sufficiently small that visiting devices would be exposed to each other.”11Couture et al. (2020) explain that “When measuring potential social contact by the DEX […], we restrict attention to venue categories in which most venues are sufficiently small that visiting devices would be exposed to each other. In particular, we omit the categories ‘Residential’, ‘Nature and Outdoor’, ‘Theme Parks’, ‘Airports’, ‘Universities’, as well as venues without a category identified by PlaceIQ. Finally, note that PlaceIQ excludes certain venue categories for privacy reasons, such as hospitals, schools, and places of worship.” For the purposes of our analysis, we assume that devices in the DEX data set are tied to individuals.
We use the “adjusted DEX index” (Dexa) which Couture et al. (2020) construct to adjust for a potential sample selection issue that may otherwise arise: devices sheltering in place may drop out of the sample if they do not generate any pings, which, in turn, may lead to an underestimation of the drop in average exposure. Couture et al. (2020) implement this adjustment by multiplying the raw DEX by the ratio of pinging devices on a given day by the maximum number of devices in a state that pinged on any day between January 20, 2020 and February 14, 2020 (before significant changes in social contacts related to COVID-19 occurred). The adjusted index may overestimate the reduction in exposure, implying in turn that any estimated increases in exposure our analysis finds will be lower bounds of the true effect.12For robustness we run our analysis using the unadjusted index as well and find very similar effects. Our two-way fixed effects difference-in-differences model, discussed below, only relies on within-state variation in the DEX over time, as suggested by Couture et al. (2020), which helps alleviate these sample selection issues.
These DEX measures control for the number of devices by construction, but not necessarily for state population if the number of devices in the DEX sample is not correlated with population. Couture et al. (2020) provide the number of devices used in the construction of the DEX series, and we compared this data to state populations. The correlation between state population and number of devices in the adjusted DEX sample is greater than 0.93. State-level variation in population density is also a concern because we expect a large degree of heterogeneity in treatment effects when population density is unaccounted for: consumer searches for goods in shortage will increase average social contacts by a larger degree in locations with larger population density.13We confirm population-density-driven heterogeneity in treatment effects by comparison of Goodman-Bacon decomposition of treatment effects with and without population-density weighting in Figure 3 in the Appendix. Further, COVID-19 cases and deaths, and daily changes in cases and deaths, are larger in states with higher population densities, so states with higher population densities may have been more likely to implement policies like price-gouging regulation in response to the pandemic. The summary statistics presented in Appendix Table 3 indicate that population density, cases, and deaths are all larger in our treatment states. In response to these concerns, we normalize all of our continuous variables by population density.
Relative to other cellphone-based mobility indices, the DEX is ideal for our goal of measuring the impact of price-gouging regulation on social contacts. If the regulation-induced shortages we are concerned with do increase social contacts, they will do so in precisely the type of commercial establishments covered in the DEX.14Couture et al. (2020) also disaggregate the data into income quartiles based on estimated locations of households at the census block level. We utilize this disaggregation to estimate different treatment effect estimates for the highest income quartile in one of our specifications.
Information on states with preexisting price-gouging legislation comes from Time magazine’s Summary of State “Price Gouging” Statutes and Regulations.15https://time.com/wp-content/uploads/2014/12/price-gouging-statutes.pdf. Date accessed: July 21, 2020. Information on declarations of new price-gouging regulation comes from the King & Spalding law firm’s COVID-19 Survey of Federal and State Price Gouging Laws 16https://www.kslaw.com/pages/covid-19-survey-of-federal-and-state-price-gouging-laws. Date accessed: July 21, 2020. Information on the dates of emergency declarations for states with preexisting price-gouging regulation, and dates of surprise price-gouging regulation activation are from state government websites. We used this information to construct the Activesd treatment variable in equation (1) below.
We collected daily state-level COVID-19 cases and deaths from the COVID-19 Data Repository by the Center for Systems Science and Engineering (CSSE) at Johns Hopkins University,17https://github.com/CSSEGISandData/COVID-19. Date accessed: May 3rd, 2020 and used these data to construct state-level daily percentage changes in cases and deaths. We also collected information on state “lock-down” or “stay-at-home” orders from the New York Times interactive map,18Available at https://www.nytimes.com/interactive/2020/us/states-reopen-map-coronavirus.html. Date accessed: May 3rd, 2020 and constructed a dummy variable indicating whether state s was under such an order on day d. We refer to this set of variables—cases, deaths, and lock-downs or stay-at-home orders—as pandemic controls.
3.2 Estimation strategy
We employ a two-way fixed effects difference-in-differences strategy to estimate the effect of price-gouging regulation on levels of social contact in the US during the COVID-19 pandemic. Our strategy also accounts for variation in social contact levels by income quartiles within state and day. Our estimation equation is
(1) 
Our outcome variable,  , measures social contacts using the device-exposure index (DEX) constructed and provided by
  . Social contacts vary by state,
  , day,
  , and income quartile,
  . The first three parameters on the right-hand side of equation (1),
  ,
,  , and
, and  , are fixed effects that control for time-invariant state effects, nation-wide daily effects, and income-quartile effects, respectively, on social contacts. The coefficient of interest,
  , is the impact of activating price-gouging regulations on social contacts. The
  variable is equal to 1 if state activated price-gouging legislation through emergency declaration before day
  , and is otherwise equal to 0. Given that our focus is on the impacts of price-gouging laws in general, we don’t distinguish between preexisting and surprise regulation states in our empirical analysis. The variable
  equals 1 for observations from the fourth income quartile, and is zero otherwise. The coefficient
  on the Rich
  Active interaction captures the relative impact of active regulation on social contacts for the 4th income quartile.19We estimated equation \eqref{did} allowing for heterogeneous treatment effects across all four income quartiles, but the results indicated no differences across the bottom three quartiles, so we present only the estimates with the interaction in the next section The
  are a set of
  time- and space- varying pandemic-related control variables that may have impacted social contacts, and the
  are their coefficients. These controls include percent changes in cases and deaths in state on date , and whether a “lock-down” or “stay-at-home” order was in effect in state on day .
Our two-way fixed effects difference-in-differences strategy controls for preexisting differences across states, and changes in social contacts over time that are unrelated to price-gouging regulation. For example, states with more cases and/or deaths would likely have fewer social contacts because individuals respond to the increased risk of catching the disease by sheltering in place. Furthermore, states under lock-down orders may also observe similar effects. We explicitly account for these pandemic-induced differences in social contacts by including our pandemic-related control variables in some specifications. Sellers might increase the price of goods and decrease quantities in markets where they enjoy market power, which might lead individuals to increase physical searches for goods and thus increase social contacts. Differences in market power may exist between states. Market power might also change over time, especially if the pandemic affected supply, for example by disrupting supply chains.
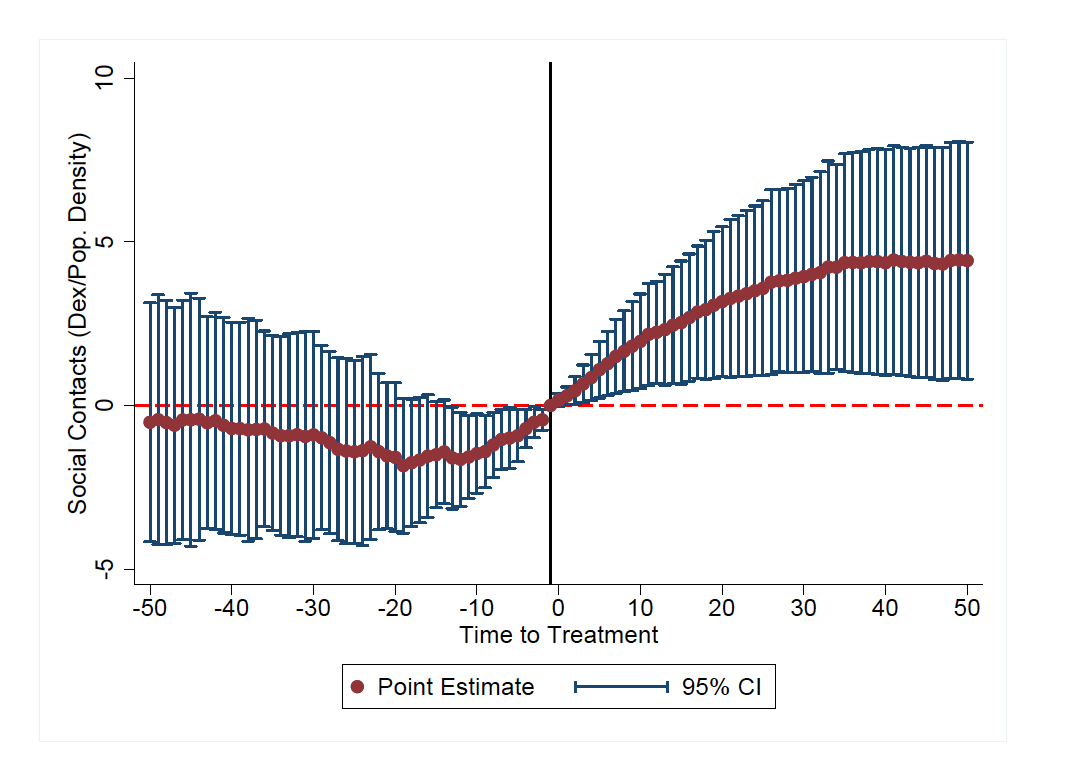
These differences across states and changes over time are unobserved. However, our estimation strategy controls for such unobserved variation so long as it is not correlated with state implementation of price-gouging regulation. Time-invariant differences in market power across states are controlled for by state fixed effects while nation-wide changes in market power over time are controlled for by the day fixed effects. However, if market power changes over time in price-gouging states, but not in control states, that would cause our treatment effect estimates to be biased. We check the robustness of our results to these possibilities in the next section by examining the individual comparisons that make up our treatment effect estimate using a Goodman-Bacon decomposition. We also ran our estimation strategy using only the subset of states with preexisting price-gouging regulation discussed above, and find similar results. (These states had price-gouging regulation long before the COVID-19 pandemic and therefore did not pass it in response to unobserved factors that occurred during the pandemic.) Finally, we also conducted an event study to check for anomalous trends of the treatment effects at different leads and lags (Figure 4 in the Appendix). We find no such evidence.
4 Results
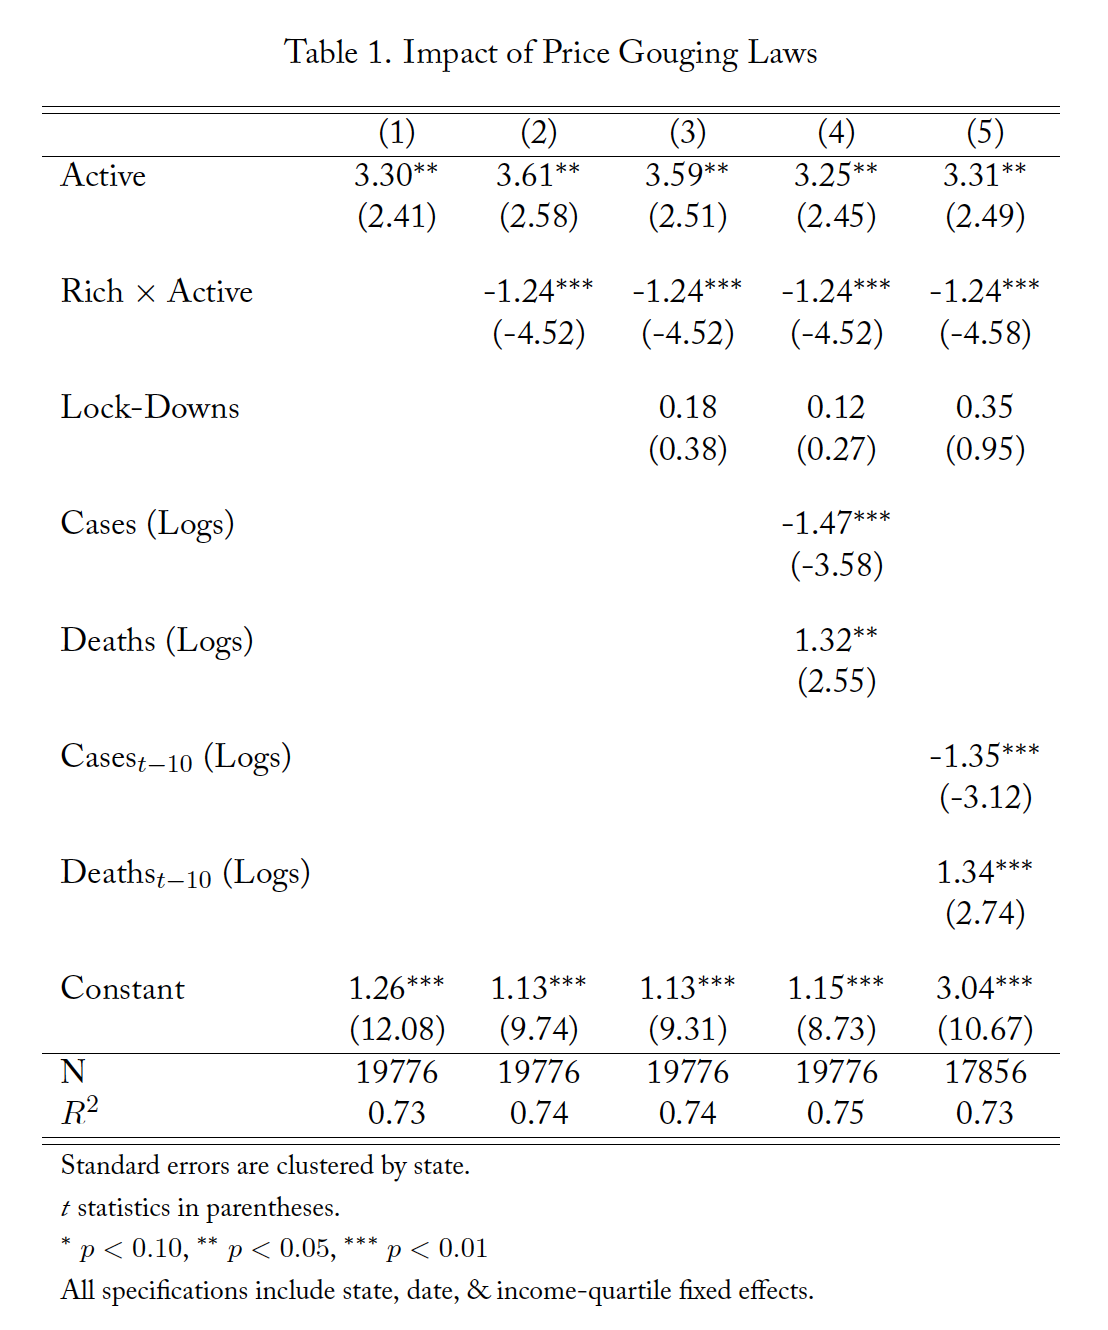
Table 1 presents our estimates of equation (1). The first column displays the results of the most basic specification. The second column introduces the interaction to account for impact heterogeneity on the 4th income quartile. Columns 3 and 4 sequentially introduce our pandemic controls, and column 5 uses lagged cases and deaths as controls instead of current cases and deaths.
The first row in all our specifications shows a stable positive and significant impact of active price-gouging regulation on social contacts. The estimated coefficient ranges between 3.30 and 3.61 (p-values < 0.05). The second row in columns 2–5 shows that the impact is dampened for devices from households in the top income quartile: the estimated coefficient is negative, significant, and stable across all specifications.
Activation of price-gouging regulation led the average individual’s social contacts to increase by at least 3.3 other devices per device per day holding time-invariant state and income effects constant, holding national daily shocks in social contacts constant, and holding our set of pandemic control variables constant. The average exposure for individuals from households in the fourth income quartile is lower by 1.24 other devices per day. Given our normalization by population density, these coefficients reflect an increase in normalized daily social contacts per device (Dexa/Pop.Density) of at least 1.07 standard deviations (for estimated effect of 3.3) due to treatment, but this effect was lower by 0.40 standard deviations for households in the highest income quartile.
Estimated impacts of pandemic controls show that lock-downs have no significant impact, while deaths and cases have opposite impacts. More current cases lead to lower social contacts, which is expected: more cases reflect higher infection risk, which households respond to by reducing their social contacts. The positive estimated impact of deaths is surprising, but may simply be a result of high collinearity with cases and/or lock-downs. An alternative explanation is that increased deaths may influence households to shop around to stock up in anticipation of a growing crisis. While more infections signal higher risk of exposure in the short-term, motivating households to delay their shopping, more deaths may signal a longer and more severe pandemic requiring more preparation to shelter in place, and, in turn, motivate more shopping.
Table 1. Impact of Price Gouging Laws
Standard errors are clustered by state.
t statistics in parentheses.
* p<0.10, ** p<0.05, *** p<0.01
All specifications include state, date, & income-quartile fixed effects.
4.1 Decomposition of Estimated Treatment Effects
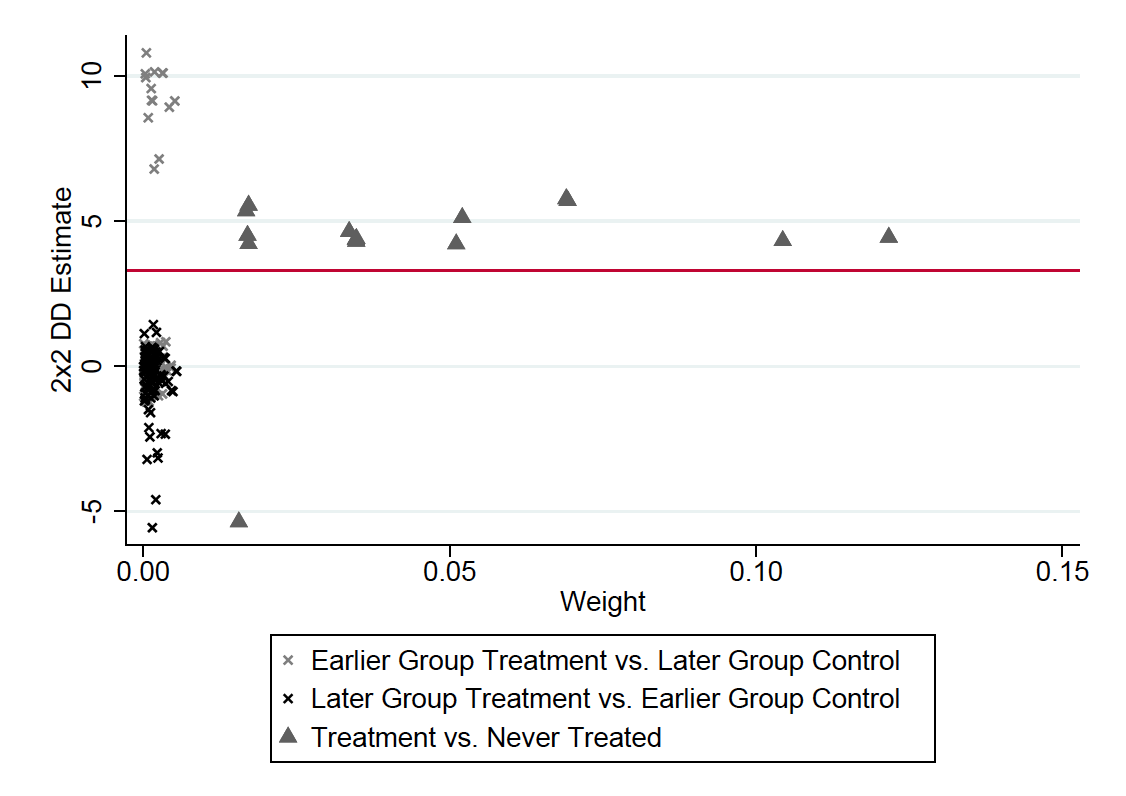
Goodman-Bacon (2018) shows the treatment effect estimated using the two-way fixed effects difference-in-differences estimator is a weighted mean of all possible individual difference-in-differences estimates in the data. In our data, difference-in-differences estimates comparing social mobility changes in New Mexico (treatment state) to Arizona (never-treated control state), Utah after treatment (relatively early-treatment state) to Minnesota before treatment (relatively late-treatment state), and Minnesota after treatment (relatively late-treatment state) to Utah after treatment (relatively early-treatment state) are all examples of such two-by-two comparisons. Note that the latter type of comparison measures the duration of treatment effects. Figure 2 decomposes the overall treatment effect into all of these individual price-gouging treatment effect estimates for our data. Figure 2 indicates consistency across treatment effects across these comparisons: Treated versus never-treated state estimates are all near 5, indicating an approximately 5/3.07 = 1.6 standard deviation increase in normalized social contacts resulting from activation of price-gouging regulation. However, early-treatment states after treatment experienced a larger treatment effect than that, with an increase of approximately 3 standard deviations in normalized social contacts (compared to late-treatment states before treatment). And states that treated early saw normalized social contacts change at a similar rate as states that adopted price-gouging regulation later.
One comparison of treatment versus never treated indicates a negative effect of price-gouging regulation on social contacts, while some comparisons between late-treatment and early-treatment states indicate a larger treatment effect occurred in those states that adopted price-gouging regulation early on in the pandemic. These outliers work against our main result, and Figure 2 indicates that the majority of the weighting is given to the treated versus never treated comparisons that were quite stable across comparisons. Examination of a Goodman-Bacon decomposition using unweighted social contacts as compared to one using social contacts normalized by population density (Figure 2) provides evidence that population density does in fact lead to heterogeneous effects. Figure 3 in the Appendix provides a side-by-side comparison of these decompositions: it shows a much larger degree of variation in these two-by-two treatment effect estimates when social contacts are not normalized through weighting by population density.
These results are consistent with the hypothesis that active price-gouging regulation leads to more physical searches for consumer goods and that these increased searches result in more social contacts. We also discovered a smaller impact of price-gouging regulation on social contacts in the highest income quartile. These increased social contacts resulting from price-gouging regulation may have led COVID-19 to spread faster in states with price-gouging regulation during the pandemic. We examine this possibility in the next section.
Figure 2. Goodman-Bacon Decomposition
4.2 Impact on Cases and Deaths
Media reports including interviews with epidemiologists indicate that congestion related to human traffic in retail environments might have compounded the spread of COVID-19.20For example, see “Coronavirus Panic Buying Puts Grocery Workers and Shoppers at Risk of Infection,” ProPublica https://www.propublica.org/article/coronavirus-grocery-shopping-risk-workers-shoppers-covid-19. Date Accessed: July 14, 2020. Experts emphasize risk among retail employees such as grocery store cashiers due to multiple exposure.21For example, see “Contact Tracing Helps Scientists To Study The Ways The Coronavirus Spreads,” NPR
https://www.npr.org/2020/05/19/858977831/contact-tracing-helps-scientists-to-study-the-ways-the-coronavirus-spreads. Date Accessed: September 29, 2020. One report from Scientific American includes a list of super-spreading destinations that includes shopping areas.22See: https://www.scientificamerican.com/article/how-superspreading-events-drive-most-covid-19-spread1/. Date accessed: September 30, 2020. In this section, we estimate the impact of increased social contacts resulting from anti-gouging regulation on the spread of COVID-19.
In order to determine the impact of these increased social contacts on cases and deaths, we first collect fitted values from our restricted estimation of equation (1),  . By construction, these fitted values capture the variation in social contacts explained by our model. These fitted values then serve as the independent variable of interest in the following two estimation equations.
(2) 
and
(3) 
We expect increases in social contacts to increase the spread of COVID-19 immediately but cannot measure this impact until individuals are tested for COVID-19, or experience recorded negative outcomes related to COVID-19 such as death or hospitalization. Given the CDC’s estimates of the timing between exposure/infection and emergence of symptoms, we expect changes in recorded cases associated with increased social contacts to occur within 3 to 10 days after the increase in social contacts.23See the CDC’s COVID-19 Pandemic Planning Scenarios: https://www.cdc.gov/coronavirus/2019-ncov/hcp/planning-scenarios.html The dependent variable in equation (2),  is the average of daily differences in cumulative cases between day
  and day
  . The average duration between symptom onset and death is 19 days according to the CDC, so we expect deaths to increase between 20 – 28 days after an increase in social contacts. The dependent variable in equation (3),
  is the average of daily differences in cumulative COVID-19 deaths between day
  and day
  .
.
Our key independent variable  measures variation in normalized social contacts based on our empirical model represented by equation (1). That model also provides us with the impact of price-gouging regulation on social contacts. Therefore, both sets of results can be combined to produce estimates of the impact of price-gouging regulation on COVID-19 cases and deaths. We also include a set of pandemic controls: daily cases and deaths in state on day , a dummy variable indicating whether a lock-down order is in effect in state on day ; and state and day fixed effects. The parameters of interest to be estimated in equations (2) and (3) are
  and
and  —the effects of predicted social contacts on increases in cases and deaths.
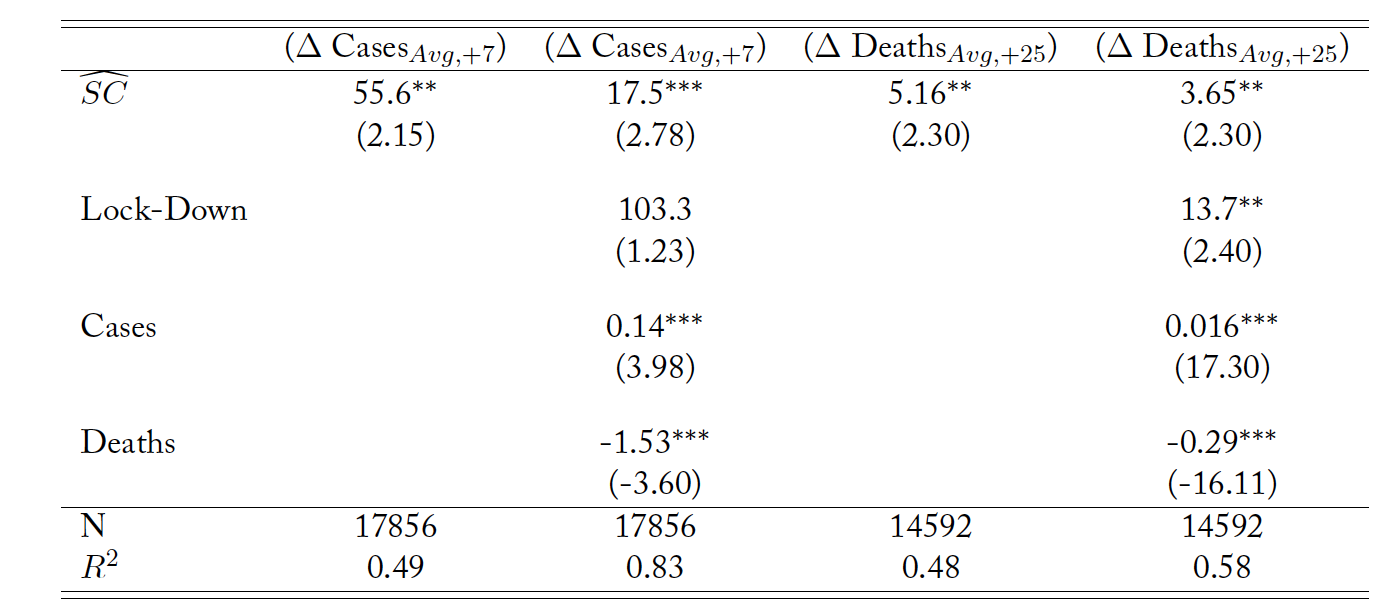
Table 2. Impact of Price-Gouging-Law-Induced Social Contacts on Future Cases and Deaths
Standard errors are clustered by state.
t statistics in parentheses.
* p<0.10, ** p<0.05, *** p<0.01
All specifications include state, date, & income-quartile fixed effects.
Table 2 presents our estimates of the parameters in equations 2 and 3. The first column of Table 2 shows estimates for equation (2) with as dependent variable, and the second column shows estimates for equation (3) with  as dependent variable. The estimated coefficients on are positive and significant in both equations.24As a robustness check, we also estimated equations controlling for cases and deaths on days
  through
  and
and  , respectively. The estimated coefficients on were similar but had slightly smaller magnitudes
Our estimates indicate that when predicted social contacts, SCsd, experiences a unit increase in state s on date d, the average increase in cases between days d + 3 and d + 10 is 55.60 (column 1, in absence of pandemic controls), and 17.5 (column 2, with pandemic controls). Furthermore, when normalized social contacts increase by one, average increase in deaths between days d + 20 and d + 28 is between 5.16 (column 3, without pandemic controls) and 3.65 (column 4, with pandemic controls). Recall from Table 1, we found that price-gouging regulation increased SCsd by 3.3 devices per device per day on average.
Combining these results indicates that active price-gouging regulation led to an extra 57 to 184 cases per day on average 3 to 7 days after implementation, and an extra 12 to 17 deaths per day on average 20 to 28 days after implementation. Our results apply to the first wave of the COVID-19 pandemic in late March and early April 2020, when average daily new cases were approximately 700, and average daily new deaths were approximately 47 in states with price-gouging regulation. These results indicate that price-gouging regulation played a major role in spreading COVID-19 and led to an increase of at least (12/47)×100 ≈ 25% in average daily state-level deaths in April in states with price-gouging regulation.
5 Conclusion
We used cellphone location data and combined it with state-level variation in price-gouging regulations that were enacted in response to the COVID-19 pandemic in March and April 2020 in order to estimate the impact of these regulations on social contacts. We used the estimated impacts of price-gouging regulation on social contacts to estimate the impacts of price-gouging regulation on the spread of COVID-19. Our results indicate that price-gouging regulation worked against COVID-19 mitigation policies during the first wave of the pandemic.
Price-gouging regulation led to an increased average number of social contacts among individuals during the COVID-19 pandemic, and these increased social contacts led to more COVID-19 cases and deaths. These are the key results of our analysis of the impacts of price-gouging regulation on social contacts and COVID-19 contagion. Our estimates also indicate that the treatment effect of price-gouging regulation on social contacts was smaller for the highest-income households.
To conclude, our results highlight that price-gouging regulations have unintended negative consequences that are compounded during a pandemic. Economic theory suggests the possibility that price-gouging-induced shortages will lead consumers to invest more in the search for products, especially for inelastic goods like hand sanitizer during a pandemic. Our results offer empirical evidence that increased search does indeed occur: social contacts in commercial establishments increase as a result of price-gouging regulation. At least part of any benefits associated with savings from paying a lower price are offset by search costs. These increased social contacts led to a faster rate of contagion during the pandemic, and appear to have increased COVID-19 deaths.
Appendix
Table 3. Summary Statistics
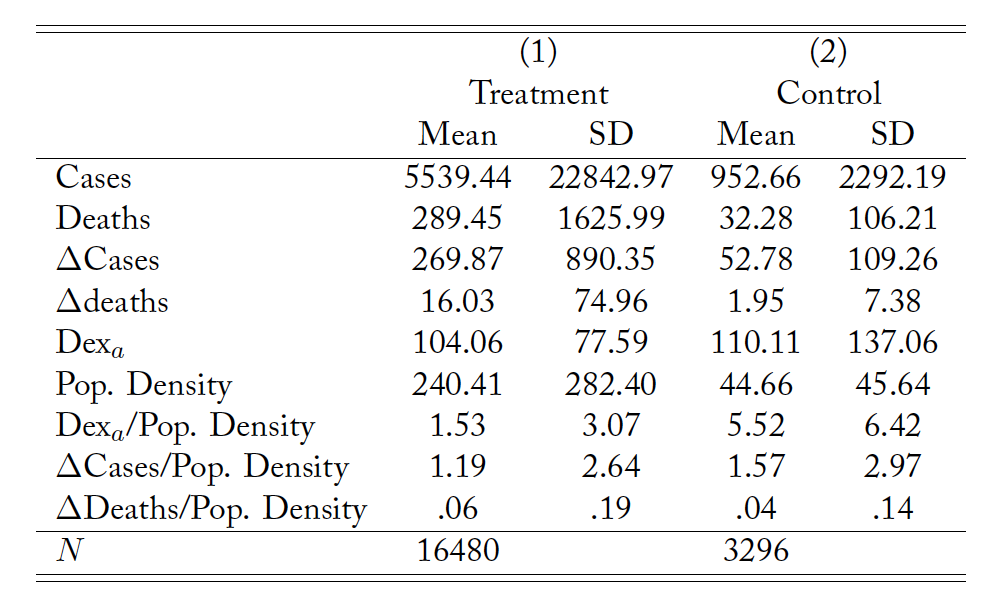
Figure 3. Comparing Goodman-Bacon Decompositions: Left panel — Social Contracts, normalized by population density; Right panel — Social Contracts, non-normalized
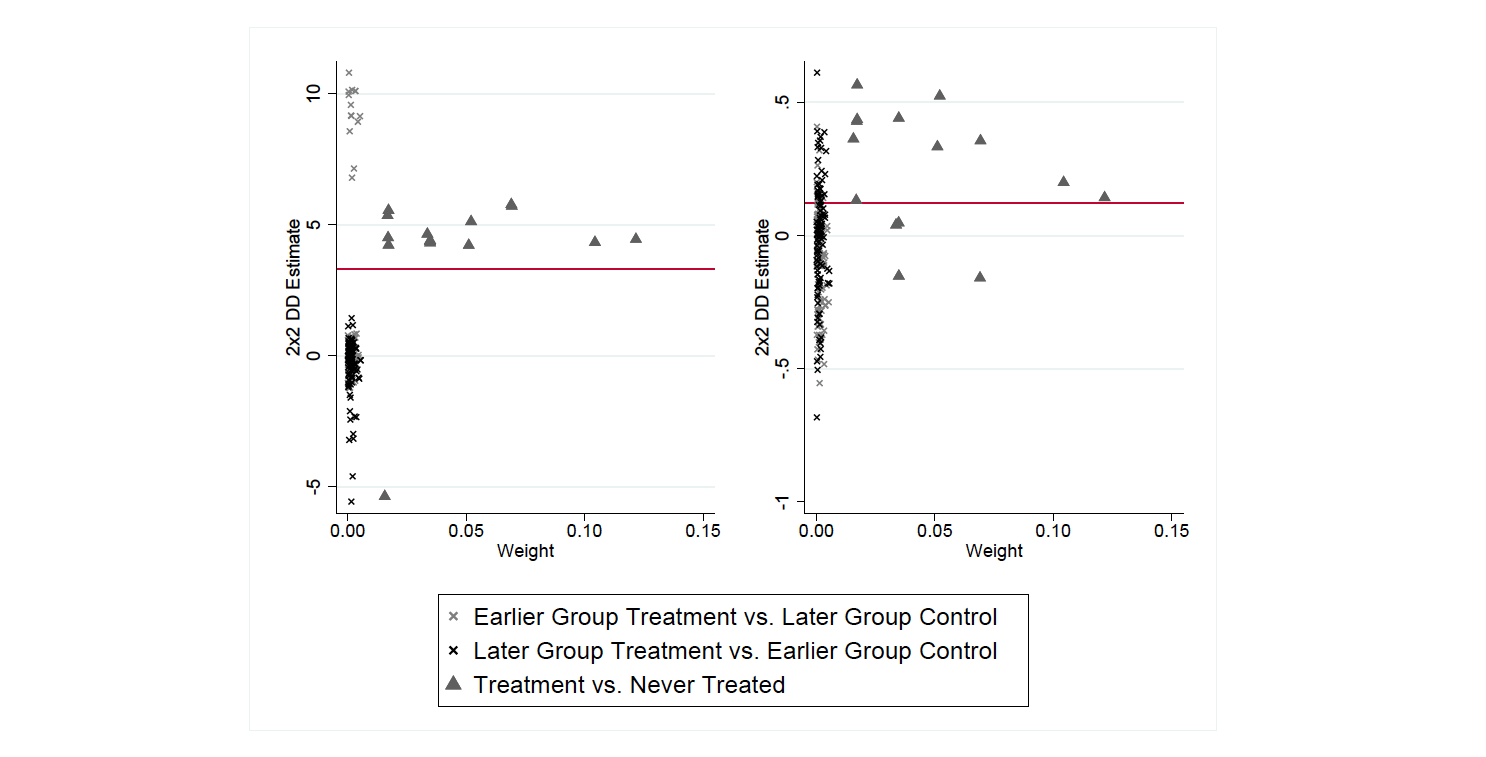
Figure 4. Event Studyof Treatment Effects
References
Barzel, Y. (1974). A theory of rationing by waiting. Journal of Law & Economics 17(1), 73–95.
Boshoff, W. H. (2020). The competition economics of excessive pricing and its relation to price gouging during the COVID-19 disaster period. SSRN Electronic Journal .
Brewer, M. (2007). Planning disaster: Price gouging statutes and the shortages they create. Brook. L. Rev. 72(3).
Cabral, L. and L. Xu (2020). Seller reputation and price gouging: Evidence from the COVID-19 pandemic. Covid Economics (12), 1–20.
Chakraborti, R. and G. Roberts (2020a). Anti-price gouging laws, shortages, and COVID-19: Insights from consumer searches. Journal of Private Enterprise 35(4), 1–20.
Chakraborti, R. and G. Roberts (2020b). Learning to hoard: The effects of preexisting and surprise price-gouging regulation during the COVID-19 pandemic. SSRN Working Paper.
Couture, V., J. I. Dingel, A. Green, J. Handbury, and K. R. Williams (2020). Measuring movement and social contact with cellphone data: A real-time application to COVID-19. National Bureau of Economic Research Working Paper Series No. 27560.
Culpepper, D. and W. E. Block (2008). Price gouging in the Katrina aftermath: Free markets at work. International Journal of Social Economics 35(7).
Deacon, R. T. and J. Sonstelie (1989). The welfare costs of rationing by waiting. Economic Inquiry 27(2), 179–196.
Engle, S., J. Stromme, and A. Zhou (2020). Staying at home: Mobility effects of COVID-19. SSRN Working Paper.
Fleck, R. K. (2014). Can prohibitions on “price gouging” reduce deadweight losses? International Review of Law and Economics 37, 100–107.
Goodman-Bacon, A. (2018). Difference-in-differences with variation in treatment timing. NBER Working Paper (25018).
Montgomery, D. W., R. A. Baron, and M. K. Weisskopf (2007, September). Potential effects of proposed price gouging legislation on the cost and severity of gasoline supply interruptions. Journal of Competition Law and Economics 3(3), 357–397.
Niles, R. (2020, April). To end the shortages, repeal the anti-price gouging laws. Real Clear Markets. Pan, J. (April 3, 2020). The pandemic’s shameless profiteers. New Republic.
Snyder, J. (2009). What’s the matter with price gouging? Business Ethics Quarterly 19(2), 275–293.
Tarrant, M. S. (2015). The effects of anti-price gouging laws in the wake of a hurricane. Master’s thesis, Montana State University, Bozeman, MT.
Weitzman, M. L. (1991). Price distortion and shortage deformation, or what happened to the soap?American Economic Review 81(3), 401–414.
Zwolinski, M. (2008, July). The ethics of price gouging. Business Ethics Quarterly 18(3), 347–378.