

1 Introduction
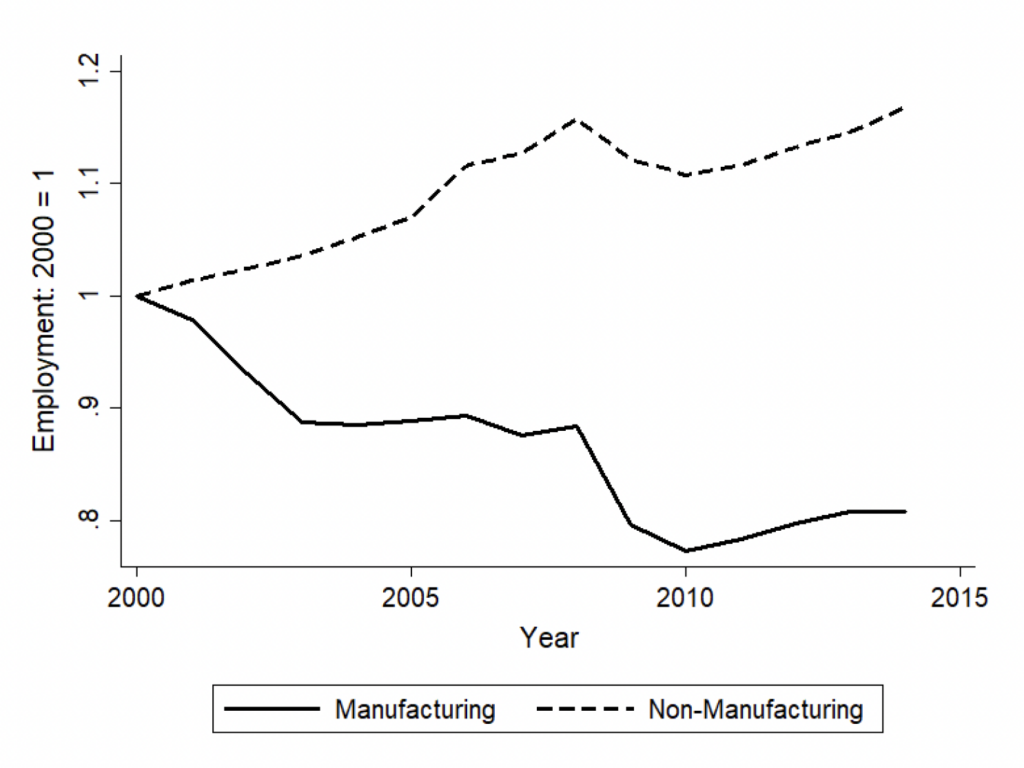
The composition of the US workforce between manufacturing and non-manufacturing industries has changed over the past few decades. Manufacturing employment decreased by more than 20% between 2000 and 2010 while showing small improvements in the post-2010 period (Figure 1a). Much of this slowing down of manufacturing job loss post-2010 can be attributed to the decline in Chinese import penetration which coincides with the period of slowdown in Chinese manufacturing productivity growth which started in 2008 (Brandt et al., 2020). Furthermore, Autor et al. (2021) identifies three phases of Chinese import penetration where the penetration increased dramatically post-2001 and plateaued in 2010. During the same period, non-manufacturing employment increased modestly despite a natural economic order of workers switching sectors due to negative labor demand shocks to a particular sector. There are two opposing effects that lead to a modest increase. First, Bloom et al. (2019) finds, in industries most affected by Chinese import penetration firms increased employment in non-manufacturing which provides evidence of organizational restructuring, and switching from manufacturing affiliation to non-manufacturing affiliation thus increasing overall employment in non-manufacturing. However, Acemoglu et al. (2016) finds the production linkages between manufacturing and non-manufacturing industries negatively impacted non-manufacturing industries that rely heavily on manufacturing input demand thus reducing employment in non-manufacturing industries as well.
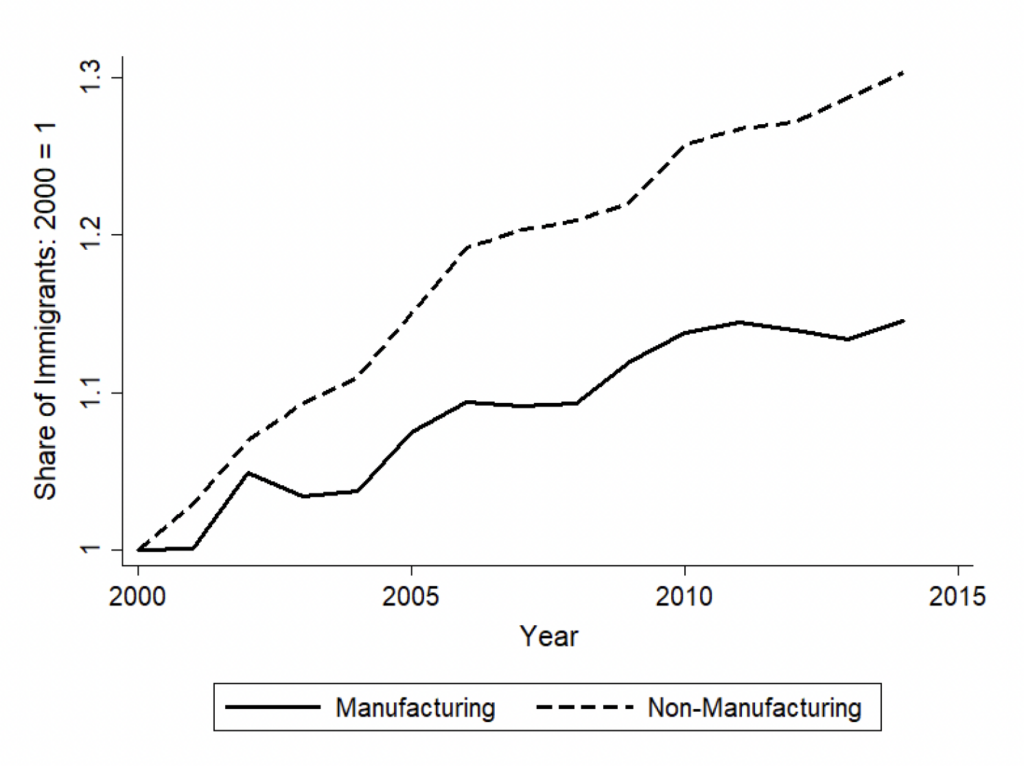
Interestingly, Figure 1b shows that despite the decline in manufacturing employment between 2000 and 2010, the share of immigrants in total manufacturing employment increased by around 14%, and then remained fairly constant between 2010 and 2014. Outside of manufacturing, the share increased by 30% between 2000 and 2014.The increase in immigrant share in both manufacturing and non-manufacturing is suggestive of the evidence that import penetration affected natives and immigrants differently. Over the period, job losses for native workers in manufacturing were higher compared to immigrants, while job gains for native workers in non-manufacturing were lower compared to immigrants.1Using data from the 2000 Census and American Community Survey for 2014, immigrant employment in manufacturing decreased by 8% while native employment in manufacturing decreased by 22%. In non-manufacturing, immigrant and native employment increased by 52% and 12% respectively. In this paper, we analyze these differences in employment trends for natives and immigrants across manufacturing and non-manufacturing industries. Formally, we analyze, if the labor market impacts of import penetration from China was different between natives and immigrants.
Figure 1: Immigrant take-up of manufacturing and non-manufacturing jobs between 2000 and 2014. Employment and shares are normalized to unity in 2000.
(a) Employment levels
(b) Immigrant share
China joined the WTO in 2001; following this, trade between the US and China increased. The trade increase was mostly in manufacturing goods. Autor et al. (2013) were the first to show the negative impact that trade had on US workers. Using a measure of import exposure they show that manufacturing employment fell across the country. But focusing on the losses due to trade is only part of the story. (Clina forthcoming) shows that STEM (Science, Technology, Engineering, and Mathematics) occupations are better off due to this trade and more so in the non-manufacturing sector. Those in STEM occupations receive an increase in wages due to the increased import exposure. However, there is no change in the job growth for STEM jobs. This could be due to the high cost of switching between a non STEM and a STEM occupation. There is also a time lag in the labor supply to adjust to the demand of firms. In this paper, we argue that immigrants can play a key role for firms as a way to import STEM workers.This would provide a way to quickly increase the STEM labor supply while domestic labor catches up and helps mitigate the adverse effect of the shock.
Using an empirical strategy similar to Autor et al. (2013), we identify the labor market adjustments for immigrants and US natives in STEM and non-STEM occupations across sectors in response to the China trade shock. We use employment growth and wage growth as our measures of labor market outcomes, and we estimate the causal effect of imports from China on the employment and wage growth of US natives and immigrants separately across occupation classifications and sectors. We reach our results by comparing the employment effects between US natives and immigrants. We identify both losses and gains for immigrant workers resulting from import penetration from China during the 2000–2007 period. During that period, STEM immigrants experienced falling employment in manufacturing but rising employment in non-manufacturing industries. This shift in immigrant employment led to higher wages for US-native STEM workers in manufacturing but lower wages in non-manufacturing fields. Non-STEM immigrants, on the other hand, experienced no change in employment in either sector but did experience wage growth in the non-manufacturing sector. This wage growth could potentially be attributed to the surge in US-native workers’ employment in the non-manufacturing sector if there is a complementary relationship between US-native and immigrant workers within non-STEM occupations. In fact, from further analysis, we find that wage growth among non-STEM immigrants is driven by low-skilled immigrant workers. Statistically significant employment growth for high-skilled US natives in non-STEM occupations coupled with wage growth for low-skilled immigrants in similar occupations confirms skill complementarity between immigrants and US natives. Overall, the results provide suggestive evidence of differences in the employment effects of import penetration on US natives and immigrants through the channels of adjustment across industries and occupations.
Our paper builds on Autor et al. (2023), who consider the differences between US natives and immigrants in their migratory response to import penetration from China. They find the out-migration response of US natives to be weaker than that of immigrants, a conclusion consistent with Cadena and Kovak (2016). Additionally, Autor et al. (2023) document precise out-migration estimates for high-skilled immigrants but imprecise out-migration estimates for high-skilled US natives, with the impact being greatest during 2000–2007. Our finding of positive wage growth among high-skilled STEM US natives in manufacturing during 2000–2007 can be attributed to this since the outflow of high-skilled immigrants is likely to increase the relative demand for high-skilled US natives. Similarly, Yu (2023) studies immigrant workers’ role in mitigating the adverse labor market shock of imports from China. She finds that US natives experienced smaller negative employment effects in labor markets with higher immigrant shares than in labor markets with no immigrants, given that both labor markets had the same average import penetration between 1990 and 2007. These papers do not consider the adjustments between manufacturing and non-manufacturing industries, while we consider them by analyzing the labor market impacts across the industries.
Our study analyzes labor market responses through the differential adjustments in manufacturing and non-manufacturing industries for US-native and immigrant employment. Ebenstein et al. (2014) and Bloom et al. (2019) find that Chinese import penetration leads to higher wages and leads skilled workers to switch to non-manufacturing employment. Batistich (2019) and Autor et al. (2015) find evidence of a shift toward higher-skilled tasks, such as an increase in computerization, in manufacturing and non-manufacturing industries. In terms of the immigration response to this technological change, Basso et al. (2020) find that low-skilled immigrants tend to specialize in noncomputerized jobs over time, resulting in skill upgrading among US natives and subsequent specialization in analytical computerized jobs by US natives. In our analysis, we consider this adjustment by immigrants in the labor market but in response to the trade shock in manufacturing that coincided with the period of the rapid increase in automation in manufacturing in the US economy (Acemoglu and Restrepo, 2020).
Our approach also differs from existing studies by examining labor market adjustments for immigrants across occupations by focusing on STEM and non-STEM occupations across sectors in response to trade shocks. We base our choice of these occupation categories on the post-2000 immigration patterns in the US. Notably, in 2000, nearly a quarter of STEM workers who held a college degree or higher were immigrants, a share that has since increased. Several empirical studies have analyzed the effect of immigration on labor market outcomes for US-native STEM and non-STEM workers. Kerr and Kerr (2013) find that US natives in STEM occupations tend to switch firms in response to immigration, while Kerr et al. (2015) provide further evidence that older US-native STEM workers are more likely than younger ones to switch firms. US-native non-STEM workers exhibit a similar pattern. In terms of gains, STEM immigration is associated with higher wages among both high-skilled and low-skilled US natives (Peri et al., 2015), and wages of US-native STEM workers rose by around 5% between 2000 and 2015 (Gunadi, 2019).2In general, STEM jobs create positive externalities in the economy through productivity growth. See Stewart et al. (2020) and Winters (2014) for an explanation of how certain STEM jobs benefit other STEM and non-STEM jobs in the local economy.
Even though the literature documents the general impact of immigration on STEM and non-STEM occupations for US natives, little is known about its interplay with the US-native employment effects of Chinese import penetration. Although higher import penetration leads to job losses in manufacturing (Autor et al., 2013, Autor et al., 2014, Pierce and Schott, 2016, Charles et al., 2019), there is evidence of employment gains in manufacturing industries that experienced higher exports over the same period (Bloom et al., 2016, Feenstra et al., 2019). In this paper, we ask whether immigrants (STEM and non-STEM) during the period of import penetration attenuated the negative employment effect of the China shock by allowing industries to adjust their labor demands between US natives and immigrants in the manufacturing and non-manufacturing sectors. We examine whether import penetration impacted US natives and immigrants differently under the presumption that US natives and immigrants with similar education and skills are, to some extent, substitutes for each other.
Our study contributes to the literature in several ways. We are among the first to measure the impact of imports from China on immigrant workers’ employment outcomes compared to US-native workers. We extend our understanding of the effects of trade with China on workers of different skill levels, focusing on the occupation-level impact of import penetration, specifically on STEM versus non-STEM workers. Additionally, we draw inferences about employment outcomes across manufacturing and non-manufacturing industries and how the effects of trade on either immigrant or US-native workers can influence the other group. Finally, we highlight the benefits that trade with China has brought to some workers.
The rest of the paper is organized as follows: section 2 provides a summary of how STEM and non-STEM jobs evolved over the years and their link to import penetration from China, section 3 describes the empirical methodology of this paper, section 4 explains the aggregate results, section 5 breaks down the aggregate results by skill, and section 6 concludes.
2 STEM and non-STEM jobs in the US
We begin our analysis by getting some perspective on the growth of STEM and non-STEM occupations in the US for both US natives and immigrants. Data on occupation and nativity come from the 5% samples of the 1990 and 2000 Census and 1% samples of the American Community Survey for 2007 and 2014 from IPUMS USA (Ruggles et al., 2022). We classify STEM occupations based on the US Census Bureau’s occupation classification for 2010 occupation codes.3The occupation classification list is obtained from https://www.census.gov/topics/employment/industry-occupation/guidance/code-lists.html. We use the “STEM, STEM-related, and Non-STEM Occupation Code List 2010” file to classify occupations. Both STEM and STEM-related occupations are grouped as STEM occupations. We define an immigrant as any individual who is born outside the US.
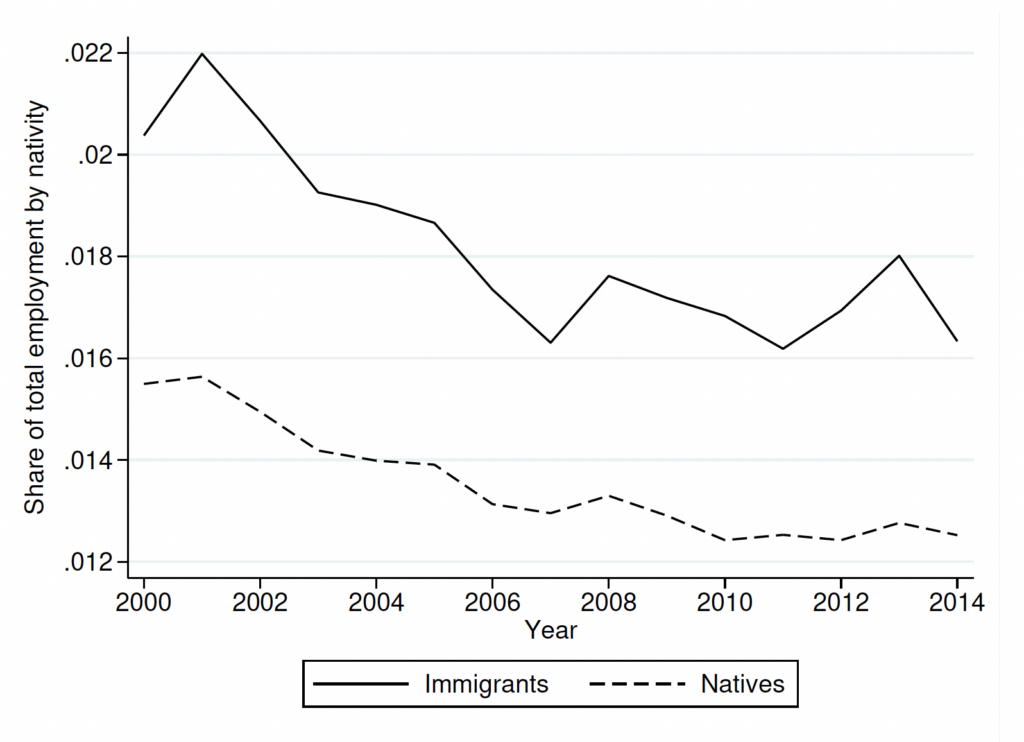
Our primary focus is on the period of heightened import penetration, which coincides with the period after China acceded to the WTO in 2001. Figure 2 provides descriptive evidence of how immigrant and US-native employment trends varied across manufacturing and non-manufacturing during heightened import penetration. It shows the share of workers in total employment by nativity in the US and is computed as follows:
![\[ \frac{emp_{kms}}{\sum_{ms} emp_{k}} \]](https://www.thecgo.org/wp-content/ql-cache/quicklatex.com-7a8b5e78e4b86ebcfdbf2955aec6ea7e_l3.svg "Rendered by QuickLaTeX.com")
where,  is nativity,
  is sector, and
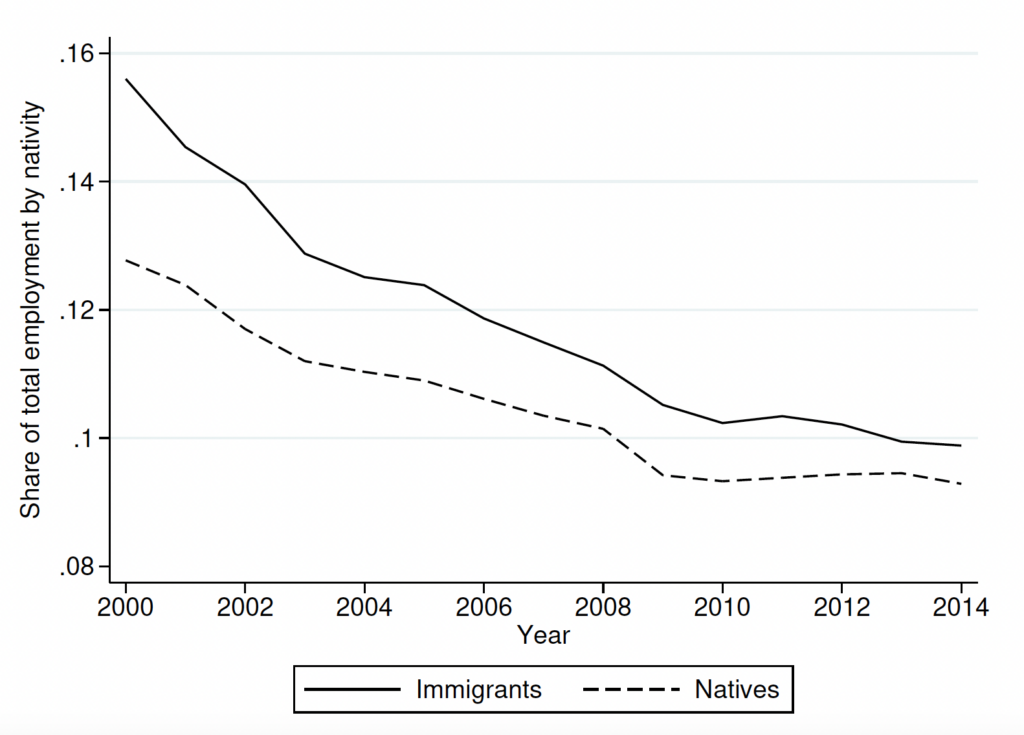
  is occupation. This share shows the within-group variation between natives and immigrants in their employment patterns during the period of import penetration. By construction, the shares in all the sub-graphs add up to 1 for natives and immigrants respectively. From figures 2a and 2b, the share of both native and immigrant workers in STEM and non-STEM occupations in the manufacturing sector declined throughout the years. The average downward trend in manufacturing employment share for both natives and immigrants confirms the negative employment effects of import penetration in manufacturing as documented in the literature. However, the decline in STEM share was less pronounced compared to the decline in non-STEM share. The share of low-skilled workers in non-STEM occupations in 2000 was around 97% where low-skilled workers are defined as workers with a high-school degree or less. Since the import penetration impacted low-skilled workers the most, a decline in non-STEM occupations is expected. Now, looking at the magnitude of the decline, the share of immigrants employed in non-STEM manufacturing declined by around 33% while for natives, the share declined by around 36%. When looking at the share for STEM, immigrants declined by 20% and natives declined by 25%. These numbers provide descriptive evidence that manufacturing employment decline was different across natives and immigrants, and natives had a larger decline than immigrants.
Figure 2: Trends in employment shares for STEM & Non-STEM jobs between manufacturing and non-manufacturing industries between 2000 and 2014
(a) STEM manufacturing
(b) Non-STEM manufacturing
(c) STEM non-manufacturing
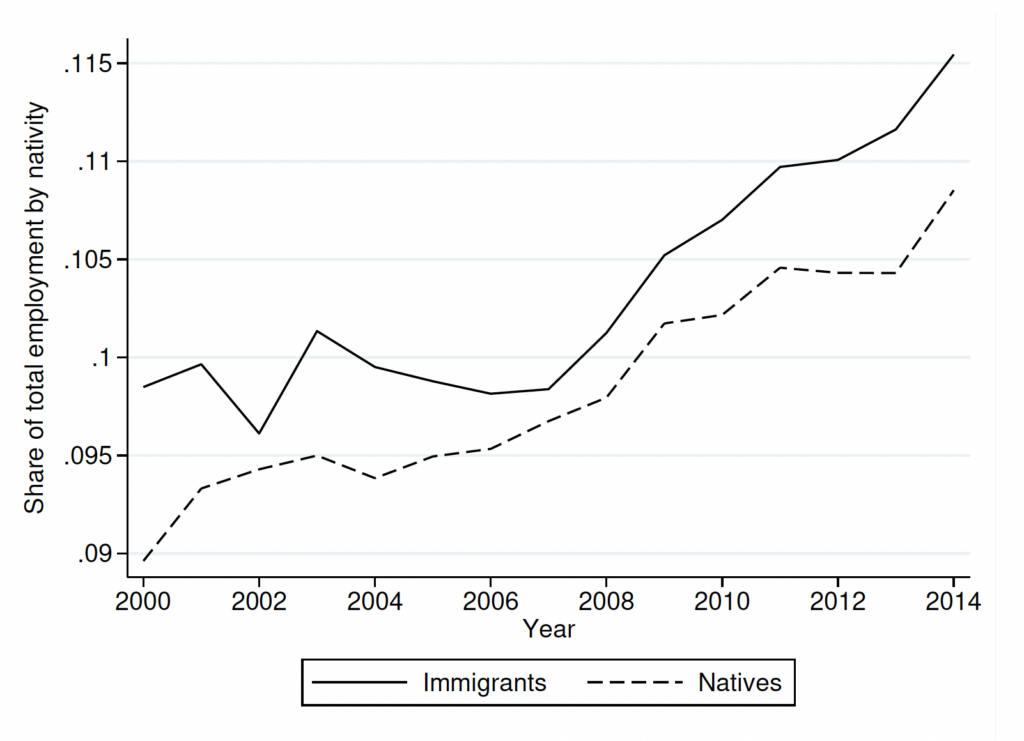
(d) Non-STEM non-manufacturing
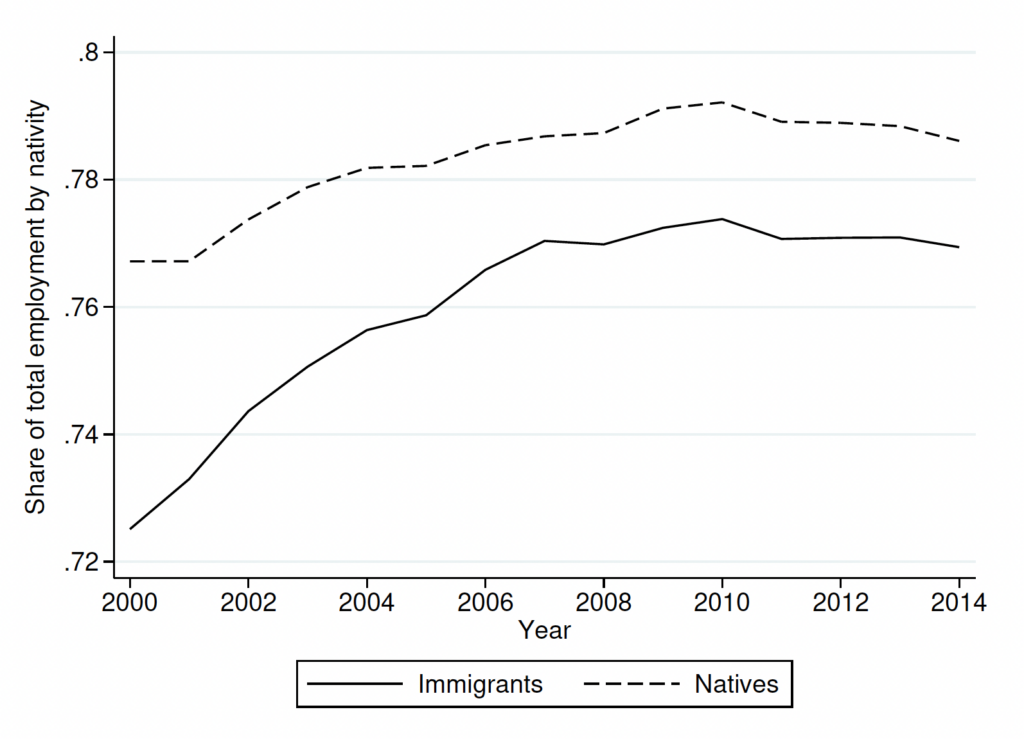
A decline in employment share in manufacturing would imply an increase in non-manufacturing share. Figures 2c and 2d show this increasing non-manufacturing share of native and immigrant STEM and non-STEM workers. A sharp increase in STEM employment shares compared to non-STEM employment highlights the importance of the growth of STEM jobs during the period and more so in the non-manufacturing sector. From the trends, immigrants had around 15% increase in the STEM share while natives had around 22%. For non-STEM employment shares, native employment increased by around 3% while immigrants had an increase in employment shares amounting to around 7%. Overall, these patterns suggest that natives and immigrants had different employment trends during the period of Chinese import penetration. The growth of non-manufacturing industries during this period led to significant increases in employment, but there is substantial heterogeneity in employment gains across nativity as well as occupations. Even though employment gains are positive in non-manufacturing and negative in manufacturing in aggregate, the differences in the magnitudes warrant a more detailed understanding of the heterogeneity. This is primarily because import penetration from China was not identical across the US labor market. Eriksson et al. (2021) finds that during the early years of import penetration between 1990 and 2000, regions that were most exposed to import penetration were the ones in which the manufacturing industries were in a matured stage with a large pool of less-educated workers. Hence, we further look at the distribution of the changes in STEM and non-STEM workers across US regions between 2000 and 2014, and how it coincides with the geography of change in import penetration during the same period.
2.1 Linking occupations to trade exposure
We obtain trade data at the industry level from Autor et al. (2019). They provide data on imports from China into the US at the industry level from 1991 through 2014.4The data can be accessed through David Dorn’s website at https://www.ddorn.net/data.htm. Chinese imports into the US economy started to increase in the early 1990s. Still, it has intensified since China joined the WTO in 2001. In 1991, the nominal value of imports from China into the US was around $20 million, which increased to $100 million over the next decade and has increased since then following China’s accession to the WTO. At the end of our sample in 2014, that number had risen to almost $500 million. In terms of the share of Chinese imports in all US manufacturing imports, in 1991, China accounted for 5% of total imports by US manufacturing industries, which doubled to 10% in 2001 and more than doubled in the following years to reach 24% of all imports in 2014 (see figures A1 and A2 in the appendix). The acceleration in imports after 2001 has been attributed to the changes in trade regulations between the US and China after WTO accession (Pierce and Schott, 2016). Hence, we primarily focus on this period to show the relation between the geography of the occupational labor market and the geography of import exposure.
We use commuting zones (henceforth CZs) as the concept for the local labor market (Tolbert and Sizer, 1996; Autor et al., 2013). A CZ is a cluster of counties that most people within one both live in and work in. One issue in measuring the impact of imports on a given CZ is that we need to have a measure of imports by the labor market. Instead, we use a proxy to determine the estimated impact of imports on a given worker in a CZ. We follow Autor et al. (2013) in measuring import penetration at the CZ level. The measure is constructed by summing the changes in imports from China at the industry level between years  and
and  , weighted by the CZ share in national industry employment. This measurement quantifies how much a CZ would be impacted by increased import competition from China and is defined as follows:
(1) 
 is the change in imports from China into the US in industry
  between the start of the period (year ) and the end of the period (year ).
  is the total employment in CZ
  at the start of the period.
  is the ratio of workers in CZ in industry relative to national employment in industry at the start of the period. The measure of import exposure
  varies across CZs and time. This variation stems from the differences in both the amount of manufacturing labor across CZ and the distribution of manufacturing employment across various sectors within those regions. In addition, using different time periods we are also able to see the variation over time for CZ.
To gain a better understanding of the measure in question, it is important to consider the factors that determine the level of exposure of a given CZ to Chinese imports. One key factor is the extent of employment in a sector that directly competes with Chinese imports. If employment in such a sector increases, or if there is a rise in the volume of imports, it would result in a higher level of exposure for that CZ. Conversely, if the total labor force in the CZ expands and becomes more diversified across different industries, it would lower the exposure to Chinese imports. In other words, when employment is spread out across a wider range of industries, the CZ becomes less dependent on any one particular sector that is susceptible to competition from Chinese imports. Furthermore, the ratio of CZ workers in a specific industry relative to the national employment in the same industry also influences the level of exposure. If the ratio of CZ workers in a particular industry falls compared to the national employment in that industry, it leads to a decrease in import exposure for the CZ.
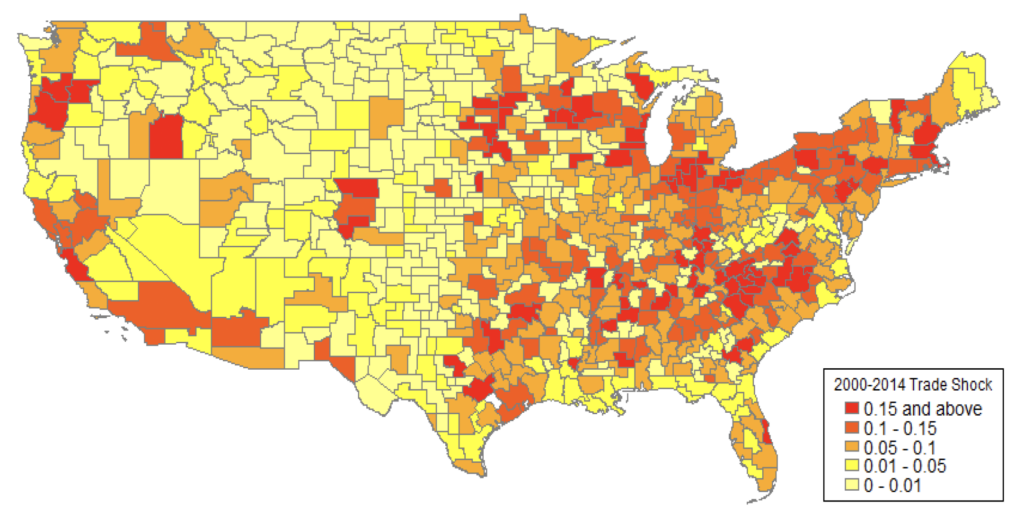
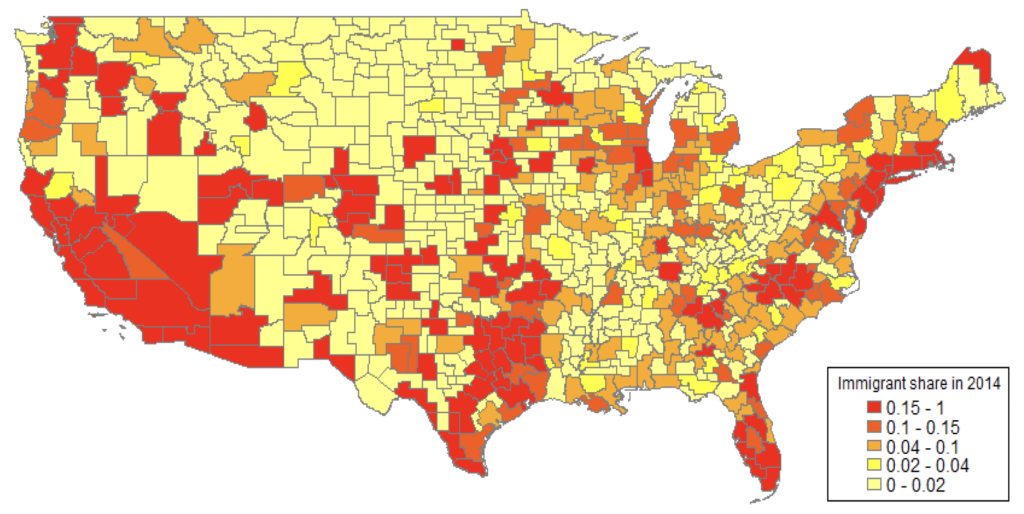
Using this measure, we construct the Chinese import penetration across US CZs between 2000 and 2014. Figure 3 shows the geographic distribution of import penetration across CZs. The CZs with the most impact of import exposure are in darker shades and correspond to the 90th and 95th percentiles of import penetration during the period. As can be observed, the highest exposure was in the eastern half of the US outside the major metropolitan hubs and some parts of the West. As explained by Autor et al. (2023), the geographic concentration outside of major metropolitan hubs can be attributed to the finding by Eriksson et al. (2021) that US manufacturing relocated to these regions as they matured in their life cycle and shifted from product innovation to standardized production during the middle of the 20th century.
Figure 3:  in import penetration from China across commuting zones between 2000 and 2014
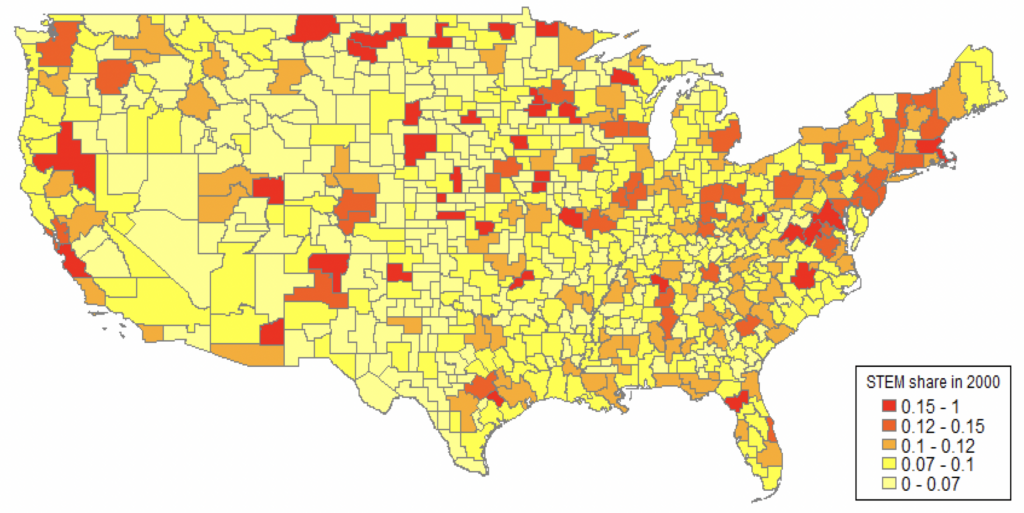
We then try to analyze whether there is a geographic relation between the import penetration and the changes in STEM and non-STEM employment in the US. We compare the CZ employment in 2000 with the CZ employment in 2014 to identify the difference between the periods before and after China’s WTO accession. Figures 4a and 4b display the share of STEM workers in total manufacturing employment in a CZ for 2000 and 2014, respectively. From figure 4a, the CZs with the highest shares of STEM workers in manufacturing were concentrated in some regions in the West and some regions in the East, mostly in metropolitan hubs. In terms of the regions that saw increased exposure after 2001, STEM workers were less than 10% of manufacturing employment in most of those regions before the increased exposure. Comparing figure 4a with figure 4b, we observe changes in CZ employment structure after heightened import exposure, especially among the CZs with the highest exposure between 2000 and 2014. In most of the CZs in the Midwest, which were most exposed to import penetration between 2000 and 2014, the STEM share in manufacturing employment increased to more than 10% in 2014.
This pattern in changes in STEM employment over our sample period provides insights into why it is important to look at the differential effect between immigrants and US natives. Based on aggregate trends in STEM manufacturing employment’s share of total employment by nativity (see figure 2a), we have observed a declining trend for both US natives and immigrants, albeit a lower decline for immigrants compared to US natives. We have seen a similar trend for non-STEM employment among US natives and immigrants in manufacturing, with the decline again stronger for US natives than immigrants (see figure 2b). Connecting this to the geography of STEM share in total manufacturing employment, it is evident a higher share in 2014 for some CZs is driven by the fact that non-STEM employment declined faster than STEM employment.
Figure 4: Share of STEM workers in manufacturing employment
(a) 2000
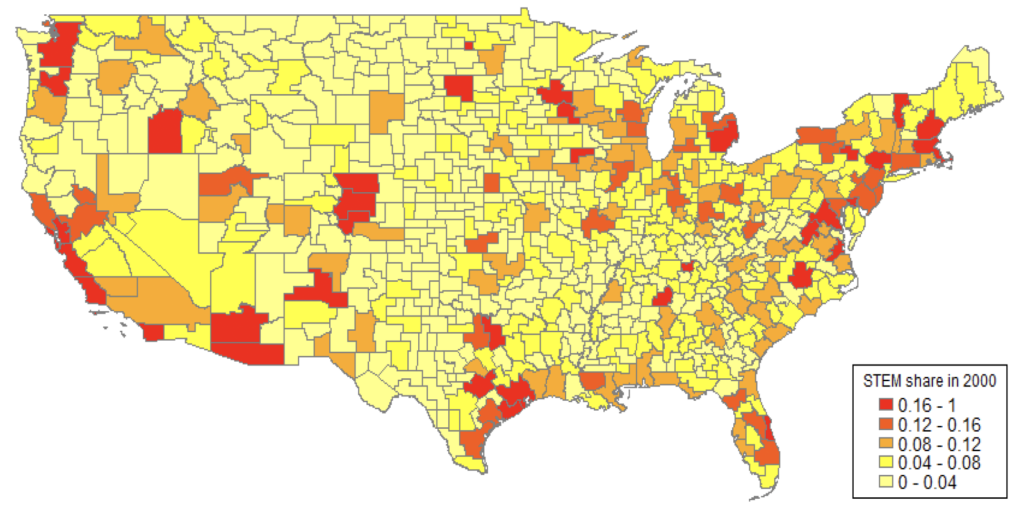
(b) 2014
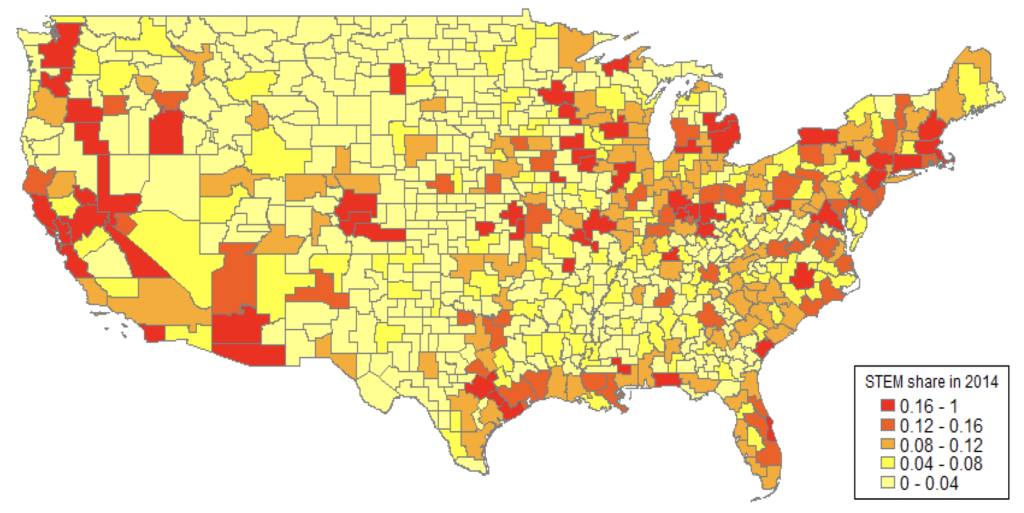
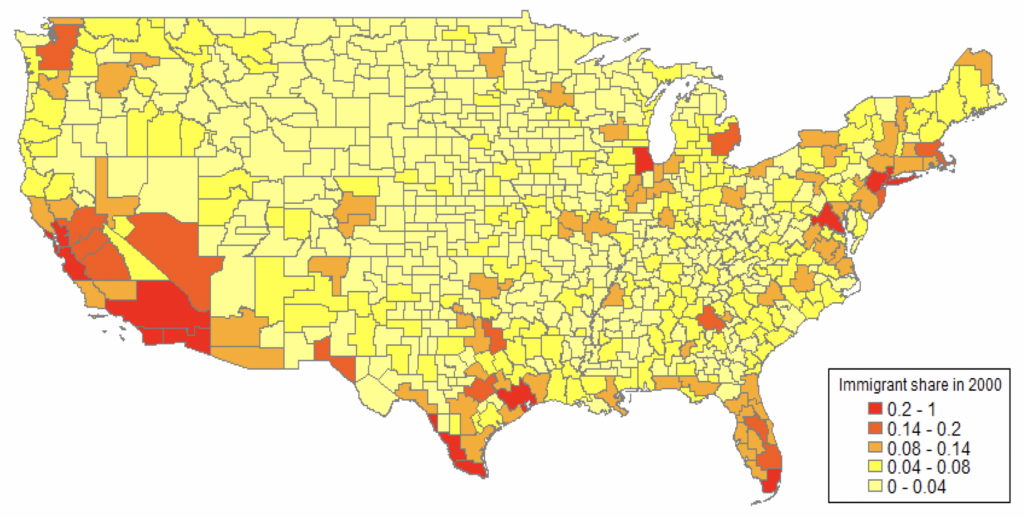
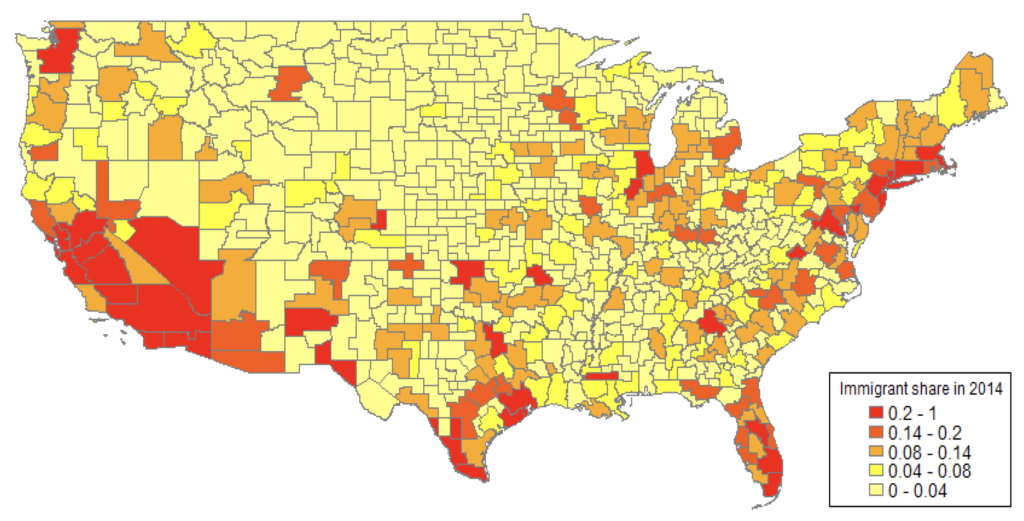
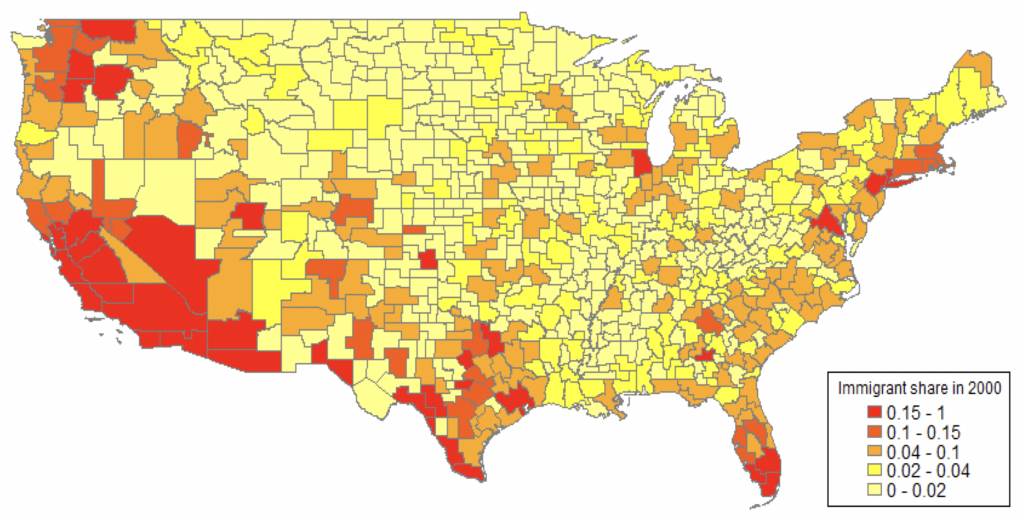
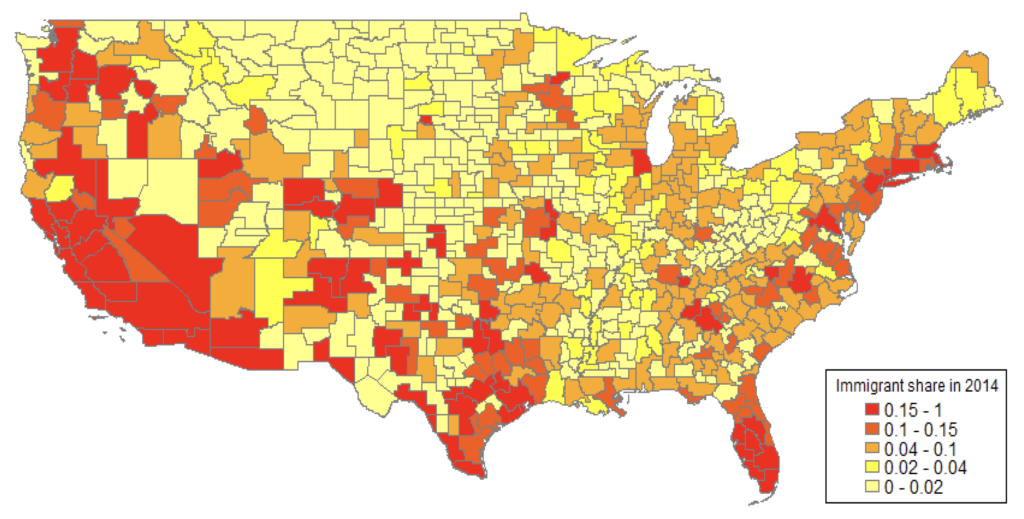
Figure 5: Immigrant share in STEM and non-STEM manufacturing employment
(a) STEM
(a1) 2000
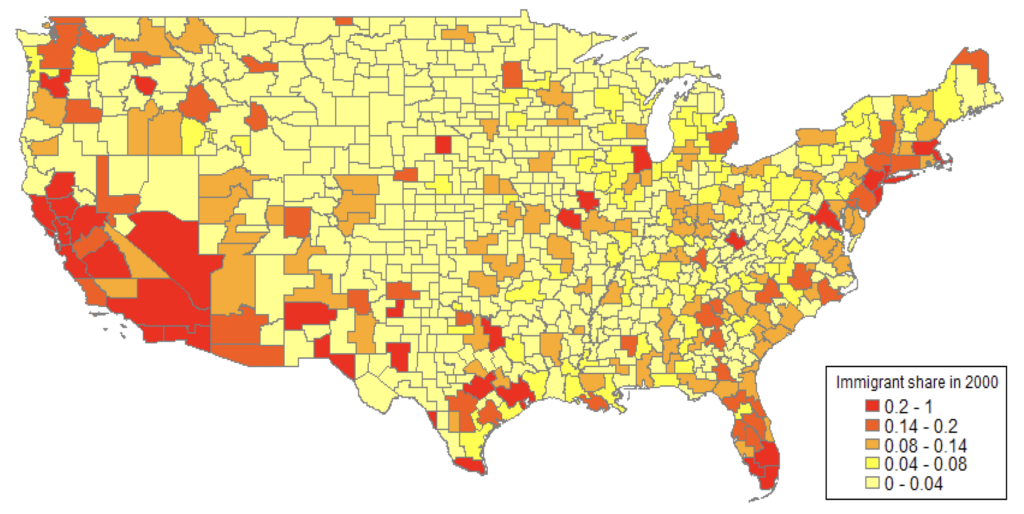
(a2) 2014
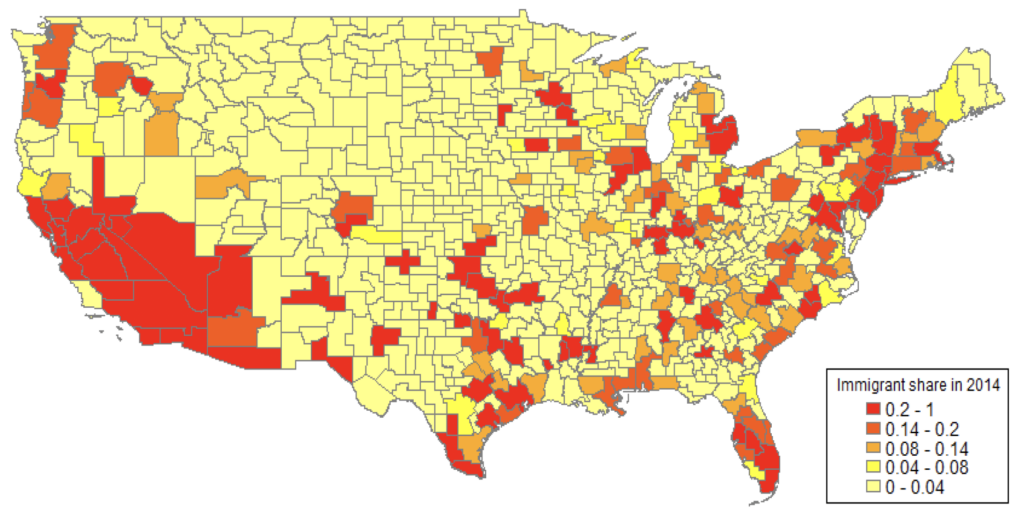
(b) Non-STEM
(b1) 2000
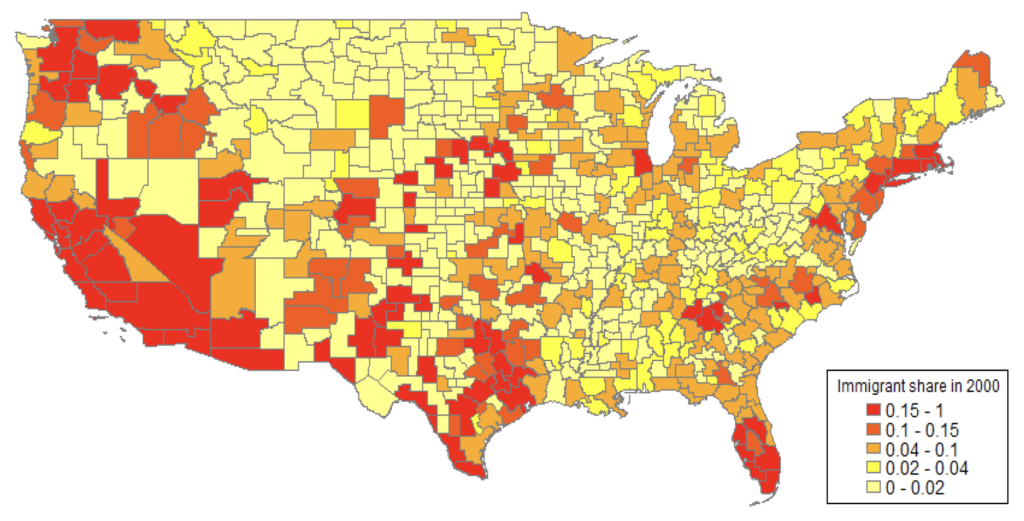
(b2) 2014
However, since US natives saw a larger decline in both STEM and non-STEM employment, the question arises of how this difference in employment trends is distributed across the CZs by their level of import penetration. More importantly, we are considering the idea that some CZs had a pronounced difference in their employment decline between US natives and immigrants compared to others. We analyze this by looking at the immigrant share in STEM manufacturing employment across the CZs computed as the number of STEM immigrants employed in the manufacturing sector as a share of total STEM manufacturing employment. We again compare this share in the pre-exposure year 2000 with the post-exposure year 2014. Additionally, we consider how immigrants in non-STEM occupations were impacted compared to the US natives in the same occupation group in manufacturing using the same share calculations. Figure 5 shows the geographic distribution of immigrant share in STEM and non-STEM manufacturing employment in 2000 and 2014.
First, from figure 5a, it is apparent that immigrant share in STEM manufacturing employment was higher in 2014 than in 2000 in most of the CZs. Before 2001, immigrants in STEM manufacturing were primarily concentrated in the metro regions of California, New York, Texas, and Florida. This could be attributed to the IT boom in the 1990s, which increased the inflow of immigrants into science and engineering occupations (Bound et al., 2015) concentrated in the large metro regions. If we compare 2000 with 2014, immigrant shares in STEM manufacturing employment increased in most of the hardest-hit CZs regarding import penetration. In the Midwest, most of the CZs with an immigrant share between 8% and 14% in 2000 had an immigrant share of more than 20% in 2014. This general increase in immigrant share is also observable among the CZs on the East Coast, which had relatively smaller shares in 2000.
Second, figure 5b shows that the immigrant share in non-STEM jobs also increased between 2000 and 2014 across the CZs that were most impacted by import penetration during that period. These patterns in increased immigrant share could be due to the general rise in immigration in the US after 2000. However, immigrants tend to settle in enclaves comprised of their origin-country people (Abramitzky and Boustan, 2017), and the Latin American immigrants since the 1970s have mostly settled near the southern border of the country (Hanson et al., 2023). A similar pattern could be observed in the geographic distribution of STEM and non-STEM employment outside manufacturing across CZs. Even though the STEM share outside manufacturing increased throughout the country between 2000 and 2014, the immigrant share in STEM employment outside manufacturing grew in the CZs that had higher levels of import penetration between 2000 and 2014.5Figures A3a and A3b in the Appendix provide a visual comparison of the share of STEM workers outside manufacturing between 2000 and 2014. Figure A4 shows how immigrant shares changed between 2000 and 2014 across STEM and non-STEM jobs in non-manufacturing employment. Comparing this with the aggregate trend in STEM non-manufacturing employment in figure 2c, immigrant STEM workers seem to benefit more than US native STEM workers from import penetration. Part of this could be attributed to the rise in demand for STEM jobs after the dot-com boom that started in the late 1990s and continued to the early 2000s. At the same time, there is evidence of an increase in computerized jobs outside manufacturing after 2000 (Autor et al., 2015). Overall, the data provide suggestive evidence of an increase in STEM share in both manufacturing and non-manufacturing sectors and an increase in immigrant share within the occupations in each industry when we consider differences across CZs. Given that the observed increase is concentrated among the CZs with the highest import penetration during the same period, the question arises whether import penetration from China played a role in this. In the next section, we detail our strategy to find the answer to the question.
3 Empirical approach
Our estimation strategy builds on Autor et al. (2013). We use a similar specification to identify the causal impact of import penetration from China on the differential labor market outcomes between US natives and immigrants across US CZs. We estimate a first-difference model, and our regression equation takes the following form:
(2) 
 is the change in labor market outcome in CZ for sector (manufacturing/non-manufacturing), nativity (native/immigrant), and occupation (STEM/non-STEM) between year and year . We consider two types of labor market outcomes, logged employment growth and logged wage growth for each group. We estimate separate regressions for each group. For example, in one of the specifications, the left-hand side of eq.(2) is the employment growth of STEM immigrants in the manufacturing sector between year and year . This is compared to another specification with the employment growth of natives in the same category as the left-hand side of eq.(2). is the change in import penetration at the CZ level between years and . This variable summarizes the aggregate effect of import penetration on manufacturing and non manufacturing employment by occupations. We define the time intervals as 1991-2000, 2000-2007, and 2007-2014.6Since the time periods are not uniform, we make necessary adjustments to import penetration to make it comparable across the time period following Autor et al. (2013). We multiply the trade growth for 1991-2000 by a factor of 10/9 and the trade growth for 2000-2007 and 2007-2014 by a factor of 10/7. We select these specific years for several reasons. Firstly, we match the analysis conducted by Autor et al. (2013), who utilize the periods 1991–2000 and 2000–2007 as their samples. By extending their analysis to 2014, we intend to assess any potential market shifts that may have occurred over the long term. The reason for choosing 2014 as the endpoint was twofold: to maintain a consistent time frame similar to 2000–2007 and because it corresponds to a significant slowdown in the growth of Chinese imports. We consider the pre-2001 period as the difference between 1990 and 2000. This difference is considered to draw an inference on how China’s accession to the WTO had a differential impact on the US labor market by comparing the pre-accession period with the post-accession period.
Our primary coefficient of interest is  which corresponds to . This captures the causal effect of import penetration in a CZ on the employment and wage trends for immigrants and natives across occupations and sectors. Post estimation, we compare the coefficients between immigrants and natives across STEM v/s non-STEM occupations in the manufacturing v/s non-manufacturing sector. The control variable
  includes a set of CZ level covariates for the start of the periods in each period in our estimation. It includes the share of manufacturing employment in a CZ, the share of foreign-born in the population in a CZ, the share of STEM employment in a CZ, and the share of high-skilled workers defined by college education in the population in a CZ.7Table A1 in the Appendix provides a summary statistic of the control variables at the start of each period; 1990, 2000, and 2007. It also provides a summary of the import penetration from China into the US for the three periods, as well as the Chinese exports to eight other high-income countries which we use as an instrumental variable and is discussed in detail in section 3.1. The first covariate captures the across-CZ difference in trade exposure arising from the initial composition of the manufacturing industry share, while the other covariates capture the across-CZ difference in labor market composition at the start of the period which might drive subsequent changes over the period. We further weight all regressions by the start of the period CZ population share in the national population, and include Census division dummies, and cluster standard errors by state.
3.1 Instrument
An issue with the estimation of equation (2) using OLS is the endogeneity between trade and local employment. This arises from the fact that imports from China into the US can be correlated with industry import demand shocks. Consider a counterfactual fall in employment in an industry that leads to lower output. The drop in output would need to be substituted and local consumers would supplement their consumption by increasing their imports from China. Thus imports from China could increase because of both shocks to domestic demand in the US as well as shocks to foreign supply from China. If import demand increases from domestic demand shocks, we have the import penetration variable correlated with the error term  in equation (2), and OLS estimates would be biased. Our primary goal is to identify the causality through the foreign supply channel of the increase in imports from China to the US. To account for this, we use an instrumental variable strategy following Autor et al. (2013) and Acemoglu et al. (2016), where we instrument the import penetration in the US using Chinese exports to eight other high-income countries similar to the US. The instrumental variable considers Chinese import penetration into other countries and takes the following form,
(3) 
The main component is  , which measures the change in the growth of Chinese exports to eight other high-income countries.8The eight countries are Australia, Denmark, Finland, Germany, Japan, New Zealand, Spain, and Switzerland. As China joined the WTO it did not only increase its trade with the US but all WTO members as well. This captures the increase in exports from China to the rest of the world. Further, we use lagged industry employment rather than the start of the period employment levels and shares. This is primarily done to avoid simultaneity in CZ employment which might arise from anticipated changes in import penetration. This IV measures the correlation of Chinese trade with the rest of the world with trade with the US. This rise in trade from other factors such as joining the WTO, increases in comparative advantage, and/or fall in trade costs.
4.1 STEM occupations
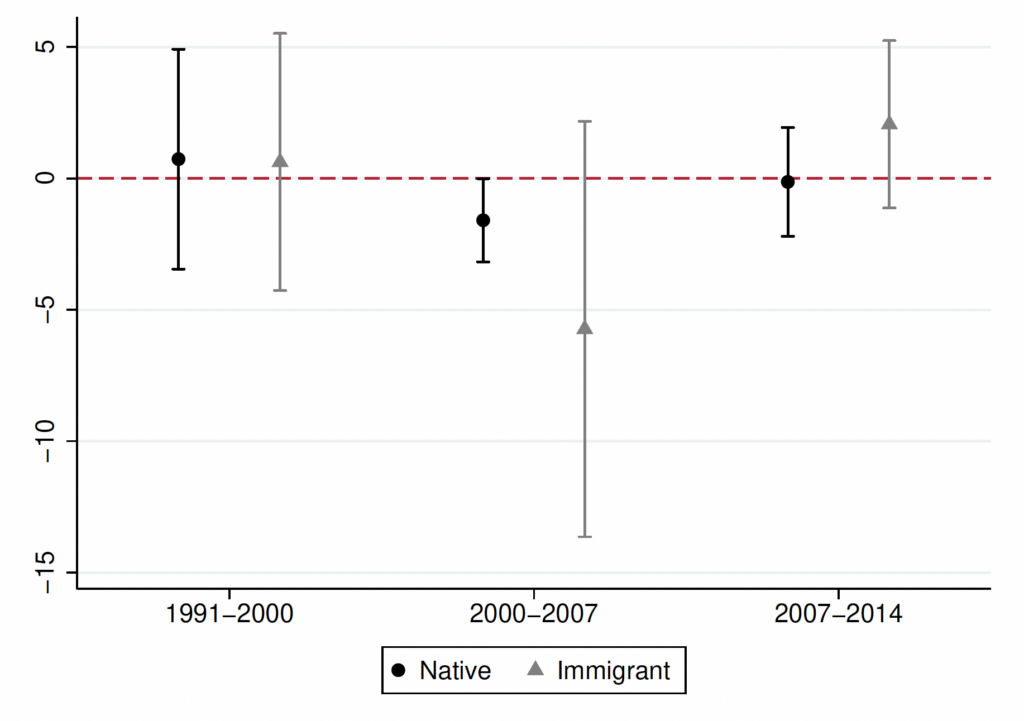
Figure 6 shows the 2SLS estimates of growth in the employment of STEM occupations across manufacturing and non-manufacturing industries at the CZ level, along with the 95% confidence
intervals. The top panel shows how employment changed in manufacturing industries, and the bottom panel shows how it changed in non-manufacturing industries. We compare the estimated effect within each panel across the three time periods.
First, from figure 6a, the causal impact of import exposure on employment growth for natives in STEM occupations is imprecisely estimated for all the time periods. Even though the estimates are positive during the period of heightened import penetration from China, the estimates are almost close to zero. On the other hand, for STEM immigrants, the estimated coefficients are negative and imprecisely estimated during the post-2001 period native, but, positive and statistically significant during the pre-2001 period. The positive coefficient during the 1991-2000 period can be attributed to the growth in the tech boom especially with the Internet boom in the US around that time, which led to employment growth for immigrants in tech-intensive industries. Overall, we do not see significantly different estimates for STEM employment growth between natives and immigrants if we consider the time period with the highest import penetration across CZs (2000-2007).
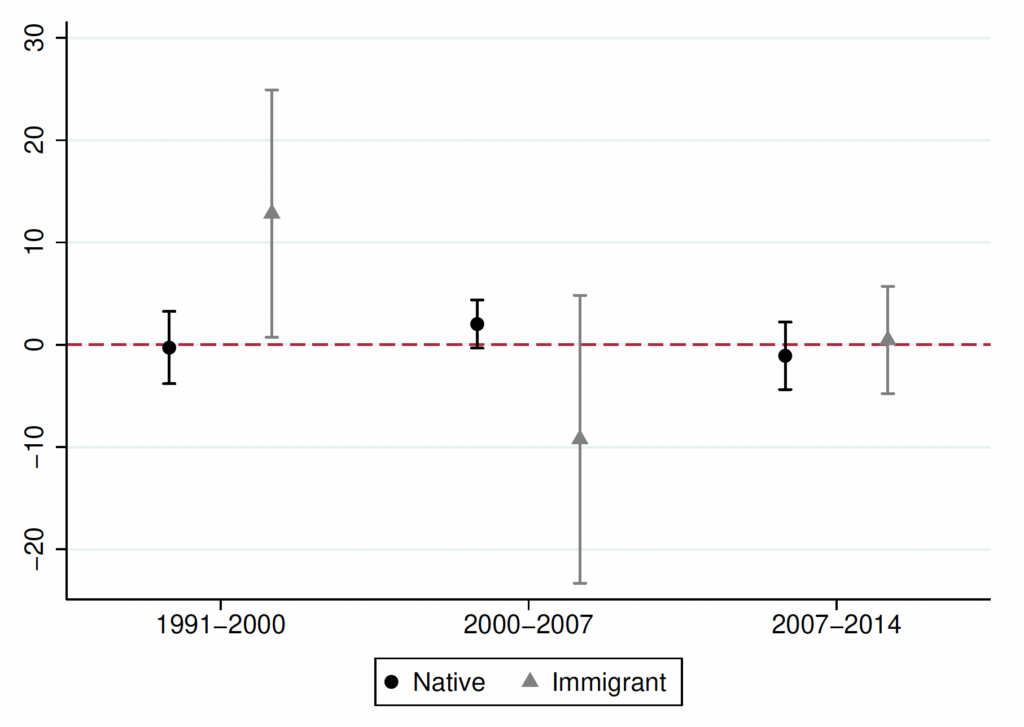
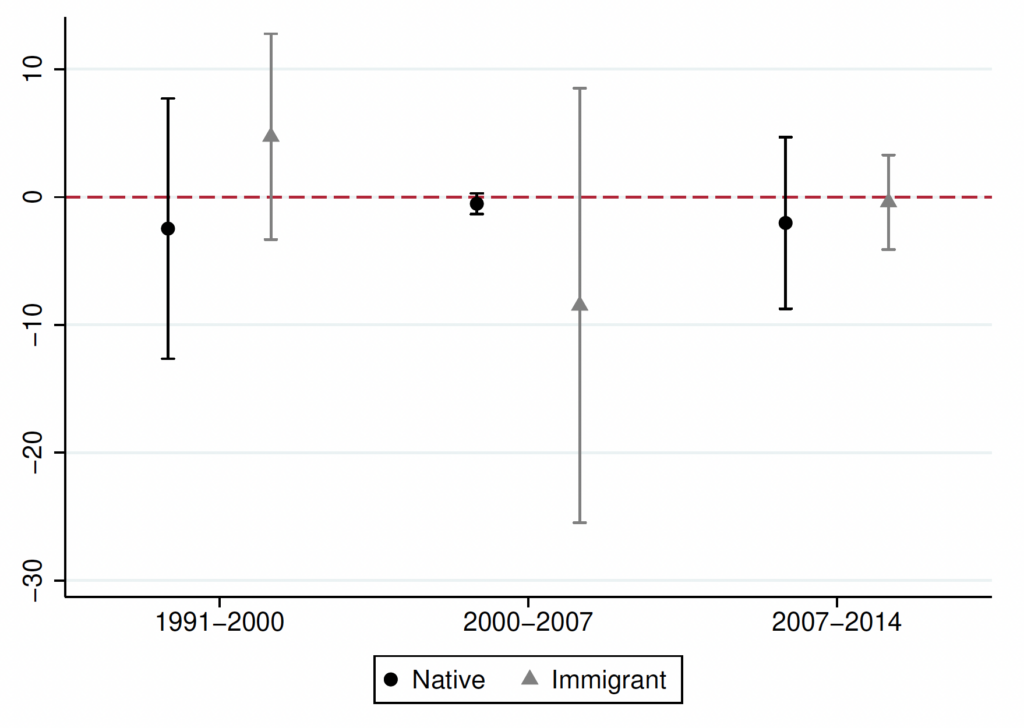
Nest, we turn to the non-manufacturing sector in figure 6b. In the non-manufacturing sector, immigrant employment growth in STEM occupations arising from import penetration from China is positive for all three time periods. However, we get only marginally significant estimates for the 2000-2007 period suggesting there was indeed a positive employment growth for STEM immigrants in the non-manufacturing sector. During the same period, we also observe a positive employment growth for natives in STEM non-manufacturing jobs, but the coefficient is not precisely estimated. Comparing the manufacturing to the non-manufacturing sector, we see that during the period of heightened import penetration from China, aggregate manufacturing employment of STEM decreased moderately, but the non-manufacturing employment of STEM workers increased for both natives and immigrants on average, and more so for immigrants.
One could interpret the positive employment growth for immigrants and natives in the non-manufacturing sector as workers moving from manufacturing to non-manufacturing between 2000 and 2007. However, if these sectoral switches are driven by negative shock in manufacturing rather than growth in non-manufacturing, we would expect the wage growth to be negative in the non-manufacturing sector. The negative wage effect would arise from an increase in the supply of workers in the non-manufacturing sector without sufficient demand. To identify this, we estimate the effect of import penetration in a CZ on the wage growth of natives and immigrants in STEM and non-STEM occupations across the sectors.
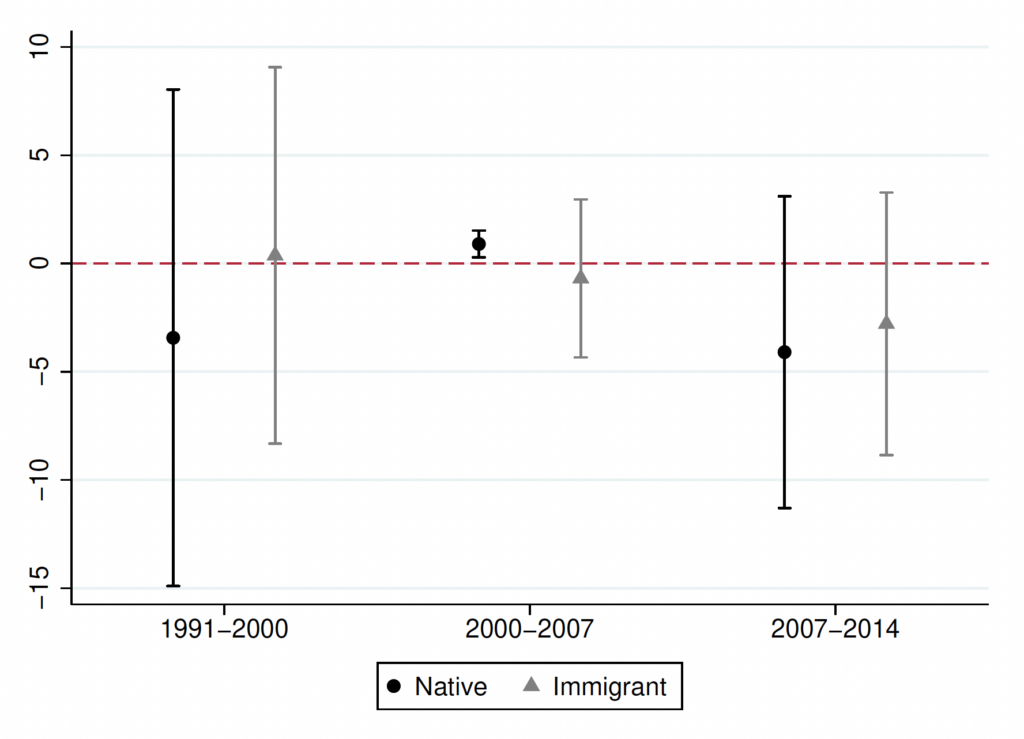
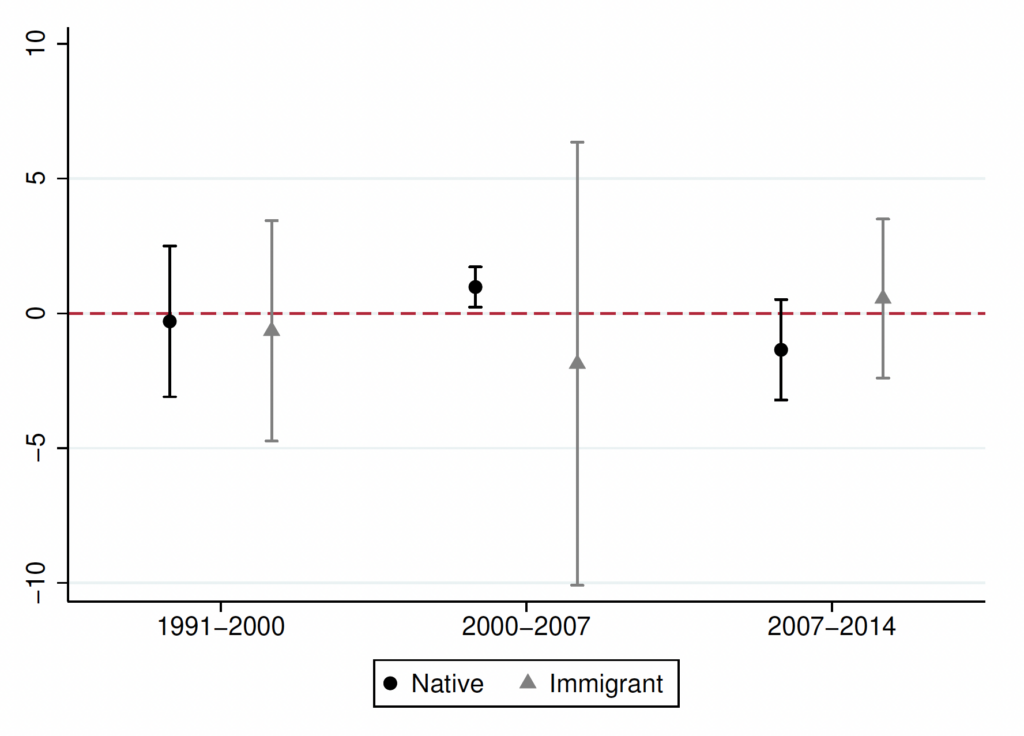
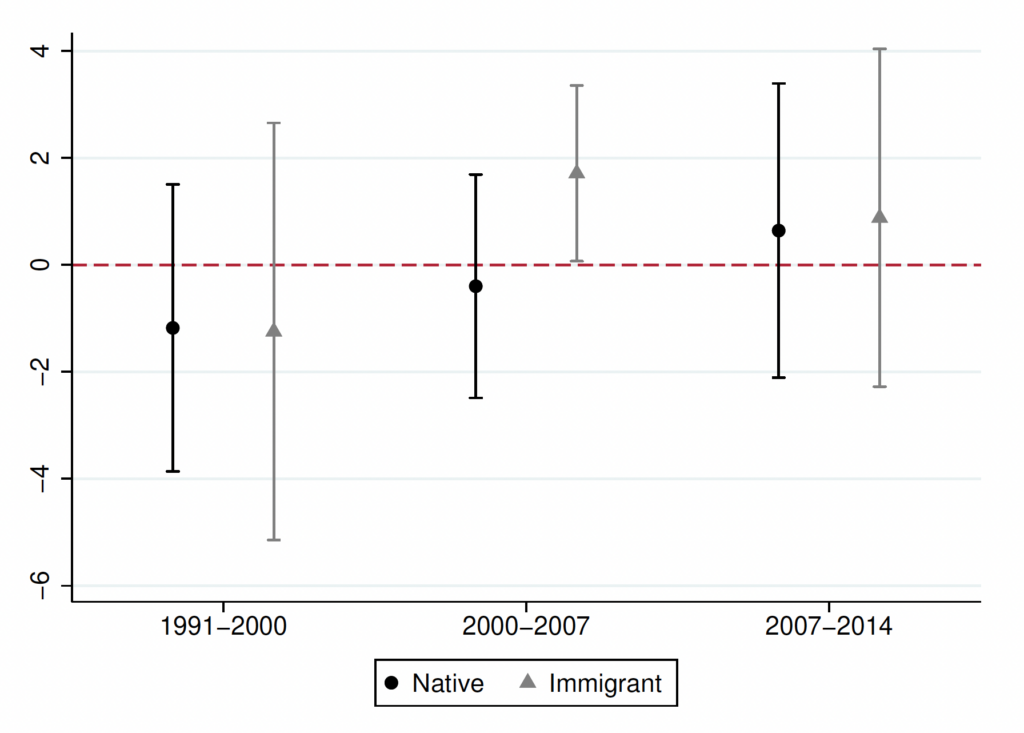
Figure 7 shows the coefficients of interest from these estimations. From the top panel (figure 7a), we observe a marginally significant positive wage growth for natives in STEM manufacturing jobs, and from the bottom panel (figure 7b), we observe that natives in STEM non-manufacturing jobs had a statistically significant negative wage growth during 2000-2007. If we look at the wage growth for immigrants, the coefficients are negative in both sectors but are not estimated precisely during this period. Immigrants only get a statistically significant positive wage growth in the manufacturing sector during the pre-2001 import penetration period. Overall, we find that the benefits to STEM workers were distinct across manufacturing and non-manufacturing sectors. In the manufacturing sector, native STEM workers had positive wage gains despite near-zero employment growth, while, in the non-manufacturing sector, immigrants had positive employment gains depressing the wages of native STEM workers.
Let’s first focus on the decline in wages for native non-STEM workers in the non-manufacturing sector. With a statistically significant positive employment growth for immigrants in STEM non-manufacturing jobs, this implies that immigrants are contributing to a surplus in STEM labor in this sector, surpassing any increase in demand, thereby reducing wages for native STEM workers. In fact, wages for STEM immigrants decrease as well, although the estimate is not statistically significant. It suggests that, for STEM labor, immigrants and natives act as substitutes. Moreover, native STEM workers in the manufacturing sector experience higher wages, possibly due to immigrant workers exiting these industries. As immigrants leave the manufacturing sector, and the structural shift of manufacturing from relatively low-skilled to high-skilled occurs, the relative demand for STEM workers will increase. This in turn leads to an increase in wages of STEM natives in manufacturing through the demand channel.
4.2 Non-STEM occupations
Now, we look at the employment and wage effects of imports from China on non-STEM jobs for natives and immigrants. Figure 8 illustrates this change in non-STEM employment across manufacturing and non-manufacturing industries. Considering the period of heightened import penetration between 2000 and 2007, native non-STEM workers are encountering job losses in the manufacturing sector(figure 8a) but are finding increased employment in the non-manufacturing sector(figure 8b), indicating a shift across sectors. Given that non-STEM jobs employ a higher share of low-skilled workers, this sectoral switching is consistent with the idea that import penetration impacted the low-skilled workers the most. However, for non-STEM immigrants, employment decreases in both the manufacturing and non-manufacturing sectors albeit the estimates are not statistically significant. If we look back at figure 5, we have seen an increase in the immigrant share in non-STEM manufacturing jobs between 2000 and 2014 across the impacted CZs. This increase in immigrant share arises in the data because in the CZs with the highest import penetration, natives switch to non-manufacturing affiliations increasing the relative number of immigrants employed in manufacturing. In terms of the difference between native and immigrant employment in non-STEM jobs in other time periods, we see a similar pattern, however, the coefficients are not precisely estimated in both sectors.
Figure 6: in employment for STEM occupations across industries
(a) Manufacturing
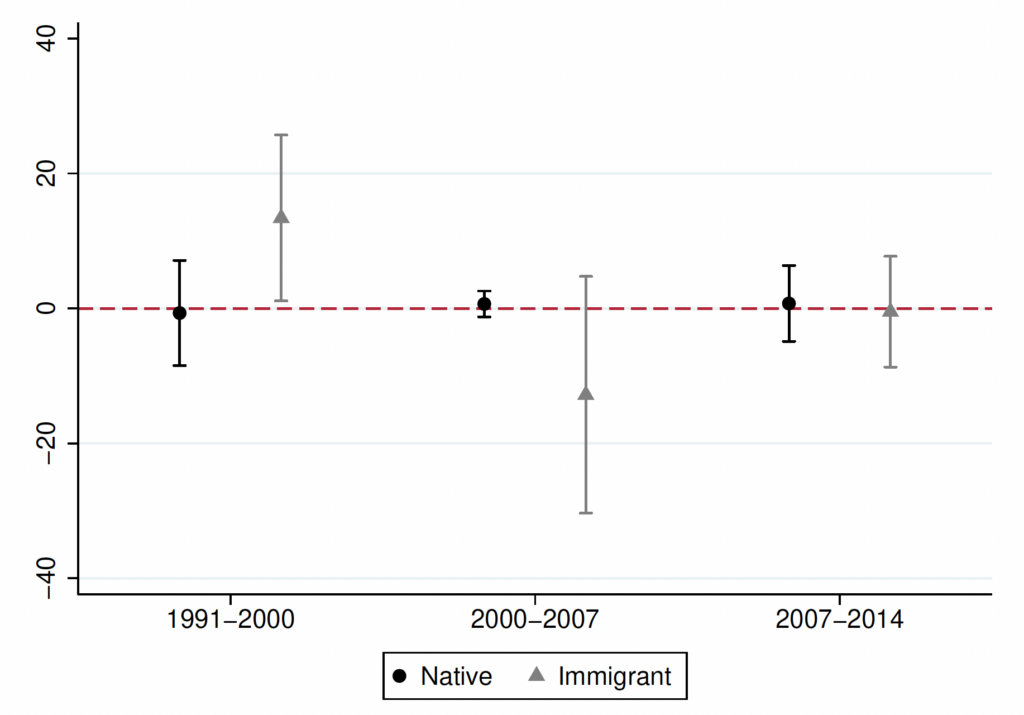
(b) Non-manufacturing
Note: The coefficient reported corresponds to the 2SLS estimation result for in equation 2. The dependent variable is the employment growth in a CZ for each specification. All regressions include the full set of controls and division fixed effects. Regressions are weighted using the start of the period CZ population share in the national population. Vertical bars show the 95% confidence intervals constructed using standard errors clustered at the state level.
Figure 7: in wage for STEM occupations across industries
(a) Manufacturing
(b) Non-manufacturing
Note: The coefficient reported corresponds to the 2SLS estimation result for in equation 2. The dependent variable is the wage growth in a CZ for each specification. All regressions include the full set of controls and division fixed effects. Regressions are weighted using the start of the period CZ population share in the national population. Vertical bars show the 95% confidence intervals constructed using standard errors clustered at the state level.
Figure 8: in employment for non-STEM occupations across industries
(a) Manufacturing
(b) Non-manufacturing
Note: The coefficient reported corresponds to the 2SLS estimation result for in equation 2. The dependent variable is the employment growth in a CZ for each specification. All regressions include the full set of controls and division fixed effects. Regressions are weighted using the start of the period CZ population share in the national population. Vertical bars show the 95% confidence intervals constructed using standard errors clustered at the state level.
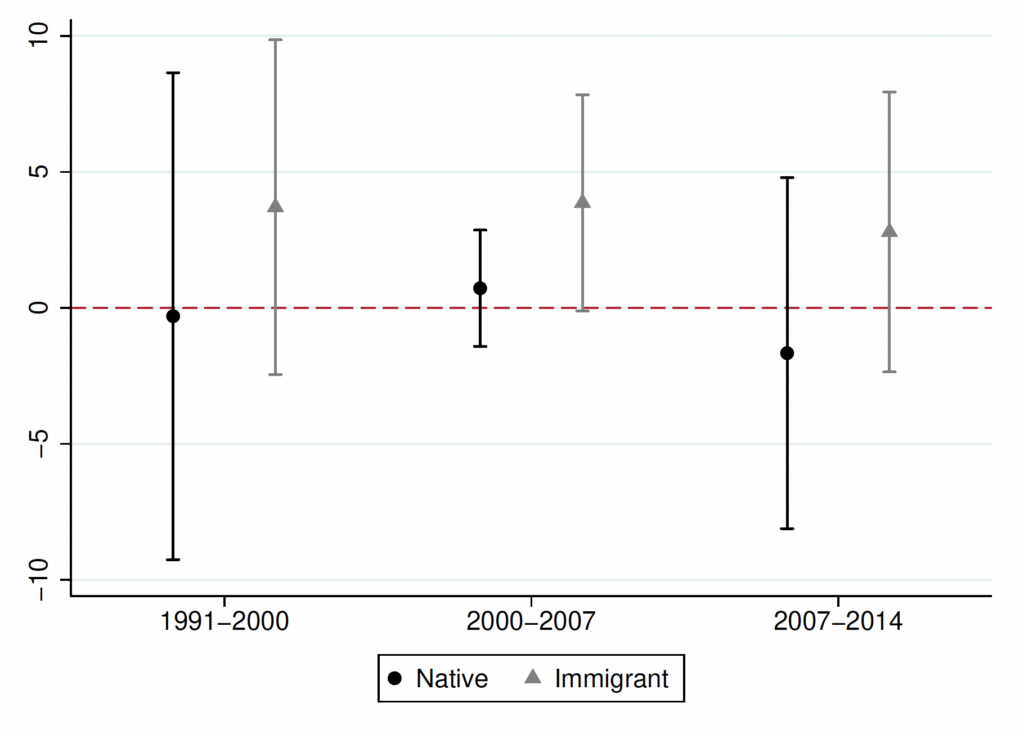
We again estimate the same set of regressions with wage growth on the left-hand side of equation 2. Figure 9 shows the estimated coefficients for native and immigrant wage growth in both manufacturing and non-manufacturing sectors. First, looking at the non-manufacturing sector in figure 9b, we find a positive and statistically significant wage growth for immigrants between 2000 and 2007, while natives have a negative wage growth although not estimated precisely. From figure 9a, we find that during the same period, non-STEM natives in the manufacturing sector had a statistically significant positive wage growth, while comparable immigrants had an imprecisely estimated negative wage growth. We do not find any significant results in other periods for either sector.
The decline in employment for native workers in the manufacturing sector, depicted in figure 8a, contrasts with their increased wages. In particular, an increase in the wage of non-STEM natives during the time of import penetration is in contrast with the expected results since non-STEM occupations employ a high share of low-skilled workers. In the next section, we analyze this further. At the same time, recall, that non-STEM immigrants had near-zero employment growth in the non-manufacturing sector, while natives had positive employment growth. Thus, the growth in the wages of non-STEM immigrants in non0-manufacturing implies that immigrants and natives act as complements within the non-STEM occupations. Positive employment growth for natives in the non-manufacturing sector increases the wages of the immigrants in the same occupations within the sector. The consensus on the substitutability between natives and immigrants is that natives and immigrants with similar skills are typically substitutes, but complementarity exists between skill levels. To test if this growth in wages for non-STEM immigrants in non-manufacturing arises due to complementarities across skill levels between natives and immigrants, we test the wage and employment effects across skill levels within occupations in the next section.
5 Heterogeneity within occupations by skill
The adverse effect of import penetration from China on employment has been shown to be higher for less educated workers, particularly in the manufacturing sector. This has been mostly attributed to the factor content of trade with China and the fact that manufacturing employment is intensive in less educated workers (Autor et al., 2013). However, at the occupational level, STEM or non-STEM jobs can be performed by workers with different levels of education. To identify the difference in effect across education levels within occupations, we classify individuals as high skilled or low skilled. A person is considered highly skilled if she has a college education. Any individual with a high school education or less is considered low skilled. Using this classification, in this section, we identify the labor market outcomes for immigrants and US natives within occupations with different skill levels. Our primary motivation is to identify which skill group drives the results documented in the previous section.9Since, the previous section finds statistically significant results mostly for the period of heightened import penetration from China between 2000 and 2007, in this section, we focus on this period in explanation of the findings. However, we do report results for all the periods.
Figure 9: in wage for non-STEM occupations across industries
(a) Manufacturing
(b) Non-manufacturing
Note: The coefficient reported corresponds to the 2SLS estimation result for in equation 2. The dependent variable is the wage growth in a CZ for each specification. All regressions include the full set of controls and division fixed effects. Regressions are weighted using the start of the period CZ population share in the national population. Vertical bars show the 95% confidence intervals constructed using standard errors clustered at the state level.
First, from looking at the distribution of skill across occupations and across industry classifications (reported in table A2), in both manufacturing and non-manufacturing, STEM occupations are mostly performed by high-skilled workers, and non-STEM occupations are mostly performed by low-skilled workers, although the high-skill share is close to 50% in some instances. The high-skill share of all workers in STEM ranges from 78% to 82% in manufacturing and 84% to 86% outside manufacturing. For non-STEM, the high-skill share ranges from 34% to 42% in manufacturing and 43% to 50% in non-manufacturing. Based on these shares, we suspect the high-skilled groups drive the results for STEM, while for non-STEM, they could be driven by either high-skilled or low-skilled groups.
If we consider the difference between immigrants and natives in these occupations, in both manufacturing and non-manufacturing, the share of high-skilled workers in STEM is higher for immigrants compared to natives, and the share of high-skilled workers in non-STEM is lower for immigrants compared to natives. Also, over our sample period, the share of high-skilled in all occupations and industry classification for both natives and immigrants have increased, suggesting benefits to higher education in the labor market. Hence, any negative employment effects for less educated workers relative to more educated workers could be attributed to technological advances shifting the production technology to high-skilled workers (Acemoglu and Autor, 2011).
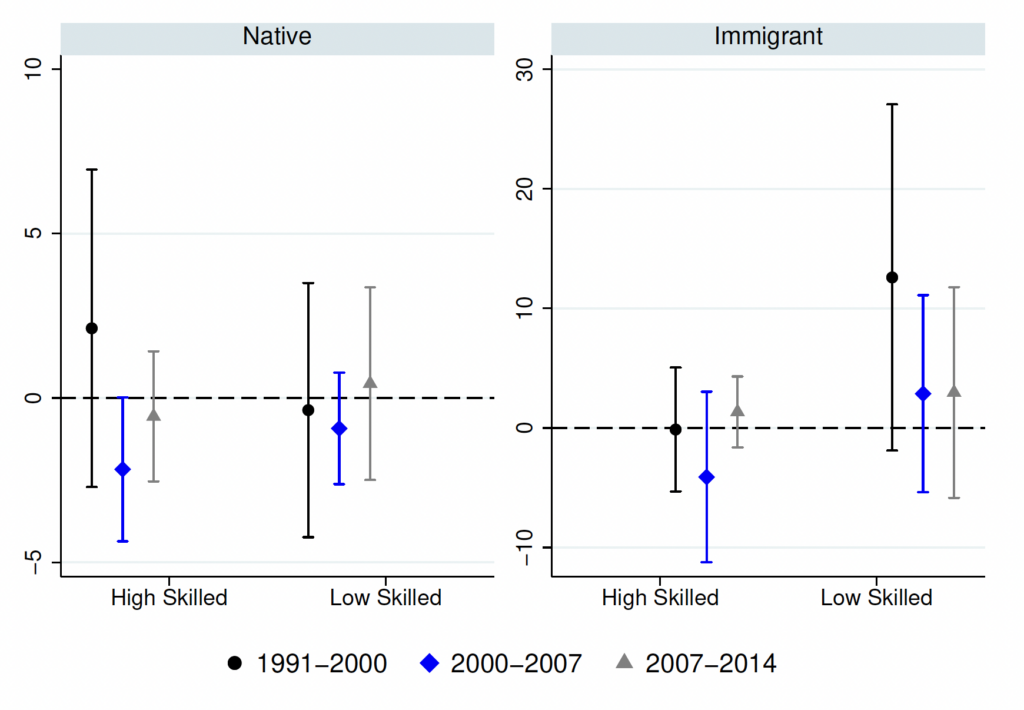
We begin by considering skill distribution within STEM occupations for natives and immigrants. Figures 10 and 11 show the effects of import penetration from China on employment growth and wage growth respectively for STEM natives and immigrants. In the manufacturing sector, we do not find any precise estimates for employment growth except for high-skilled immigrants for the 1991-2000 period. However, based on estimates, the employment growth for both natives and immigrants was negative during the 2000-2007 period if they were low-skilled workers, but high-skilled native STEM workers had positive employment growth. In the non-manufacturing sector, for the same period, we find marginally precise positive estimates for high-skilled natives and immigrants in terms of import penetration-induced job growth. The estimates for low-skilled workers are not statistically significant irrespective of nativity. However, the direction of the estimates is positive for low-skilled immigrants and negative for low-skilled natives. Thus, the growth in aggregate non-manufacturing STEM employment for both natives and immigrants observed in figure 6 is largely driven by high-skilled workers.
Figure 10: in employment for STEM occupations across industries by skill level
(a) Manufacturing
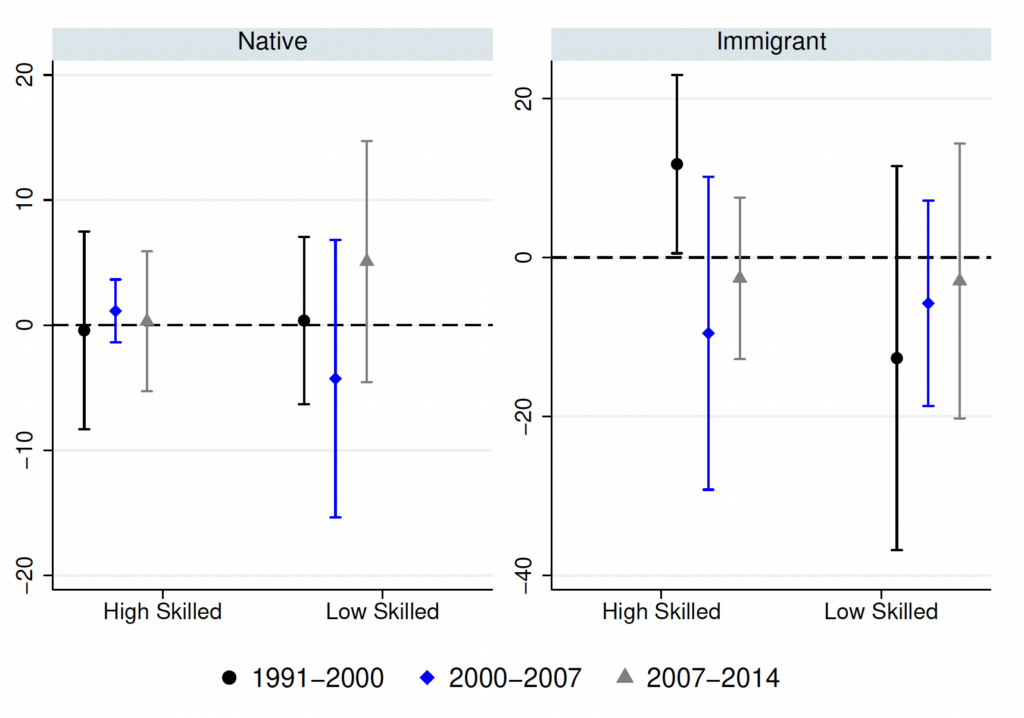
(b) Non-manufacturing
Note: The coefficient reported corresponds to the 2SLS estimation result for in equation 2. The dependent variable is the employment growth in a CZ for each specification. All regressions include the full set of controls and division fixed effects. Regressions are weighted using the start of the period CZ population share in the national population. Vertical bars show the 95% confidence intervals constructed using standard errors clustered at the state level.
Figure 11: in wages for STEM occupations across industries by skill level
(a) Manufacturing
(b) Non-manufacturing
Note: The coefficient reported corresponds to the 2SLS estimation result for in equation 2. The dependent variable is the wage growth in a CZ for each specification. All regressions include the full set of controls and division fixed effects. Regressions are weighted using the start of the period CZ population share in the national population. Vertical bars show the 95% confidence intervals constructed using standard errors clustered at the state level.
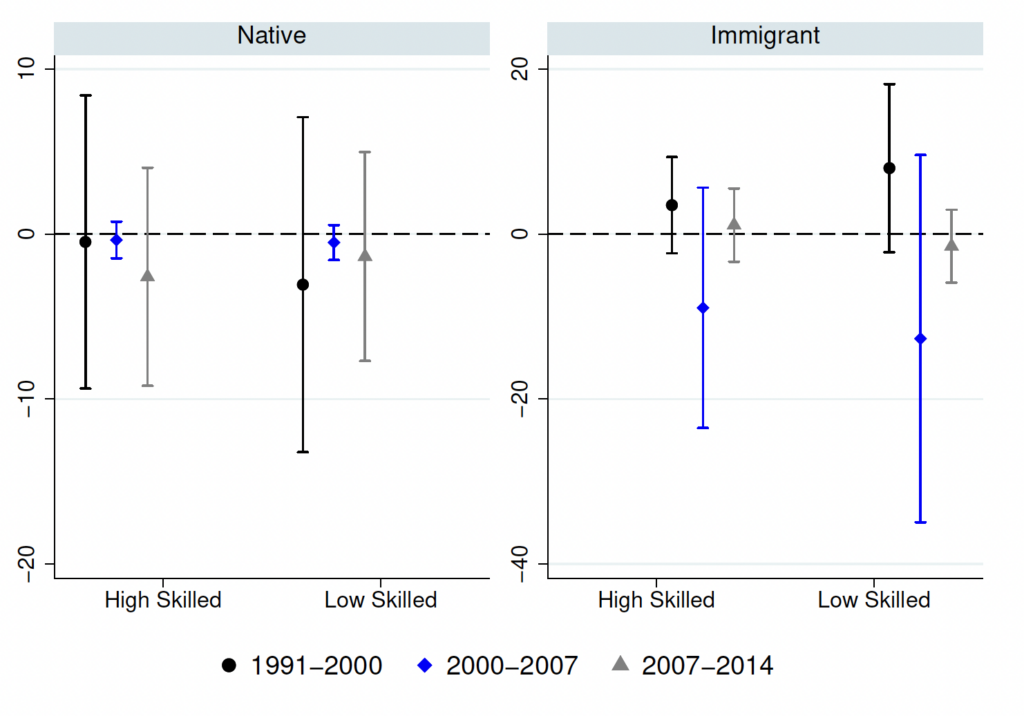
In terms of wage growth by skill level in STEM occupations between 2000 and 2007, recall, we had a positive estimate for natives in manufacturing, and negative estimates for natives in non-manufacturing. The estimates for immigrants were negative in both sectors but also statistically not significant. From figure 11, the coefficient on high-skilled native STEM workers in manufacturing is positive but not statistically significant, while for low-skilled workers it is negative but almost zero with a very high confidence interval. Similarly, in the non-manufacturing sector, the coefficient on low-skilled native STEM workers is negative but not statistically significant. However, high-skilled native STEM workers have a marginally significant negative wage growth in non-manufacturing. This suggests that the positive wage effect in manufacturing, and the negative wage effect in non-manufacturing is mostly driven by high-skilled workers. Also, this makes sense, since the high-skilled share among STEM workers is high in the sample and is the dominant force behind aggregate STEM statistics. Immigrants, on the other hand, have imprecise estimates of negative wage growth in both the manufacturing sector and the non-manufacturing sector if they are high-skilled workers. For low-skilled immigrants, the estimates are negative in manufacturing, but positive in non-manufacturing.
Positive employment growth for high-skilled immigrants in non-manufacturing along with a negative wage growth again suggests that employment growth was supply-driven. However, in figure 10b, we have observed positive employment growth for both high-skilled and low-skilled immigrants, but positive employment growth for only high-skilled natives. The positive employment growth for low-skilled immigrants along with positive wage growth would suggest that this was primarily demand-driven. This difference in the impacts can be explained using the idea of substitutability between natives and immigrants. Between 1990 and 2007, immigrants with less than 12 years of schooling more than doubled from 8.5 million to 17.8 million (Hanson et al., 2017). Since non-manufacturing employment increased during the same period (Fort et al., 2018), immigrant take-up in non-manufacturing could be expected to be higher especially for low-skilled due to cost advantage since low-skilled immigrants tend to have lower wages than comparable natives. Furthermore, Mandelman and Zlate (2022) shows that low-skilled immigrants are responsible for employment growth in low-skilled intensive occupations since low-skilled immigration depresses comparable native wages which incentivizes the natives to gain skills through training and move to occupations demanding higher skills.
Additionally, the negative wage effect on high-skilled immigrants can also be explained using the same idea of substitutability and cost advantage. From the point estimates, high-skilled immigrants had higher employment growth in non-manufacturing than their native counterparts. This is primarily because, in the year 2000, native STEM employment in non-manufacturing was around 8% of total US employment while immigrant STEM employment in non-manufacturing was around 2% of total employment. Thus, increases in employment for both natives and immigrants in non-manufacturing especially high-skilled led to excess workers without sufficient demand, depressing their wages. A higher increase in employment for immigrants results from the natives and immigrants with similar skills acting as substitutes, allowing the firms to reallocate their inputs toward immigrants. Thus, even though the wages for both natives and immigrants in this category drop, the drop in wages for natives is marginally significant, while for the immigrants it is not. In other words, this suggests that increases in high-skilled immigrant employment allowed the non-manufacturing industries to substitute the native workforce with immigrants allowing cost-savings.
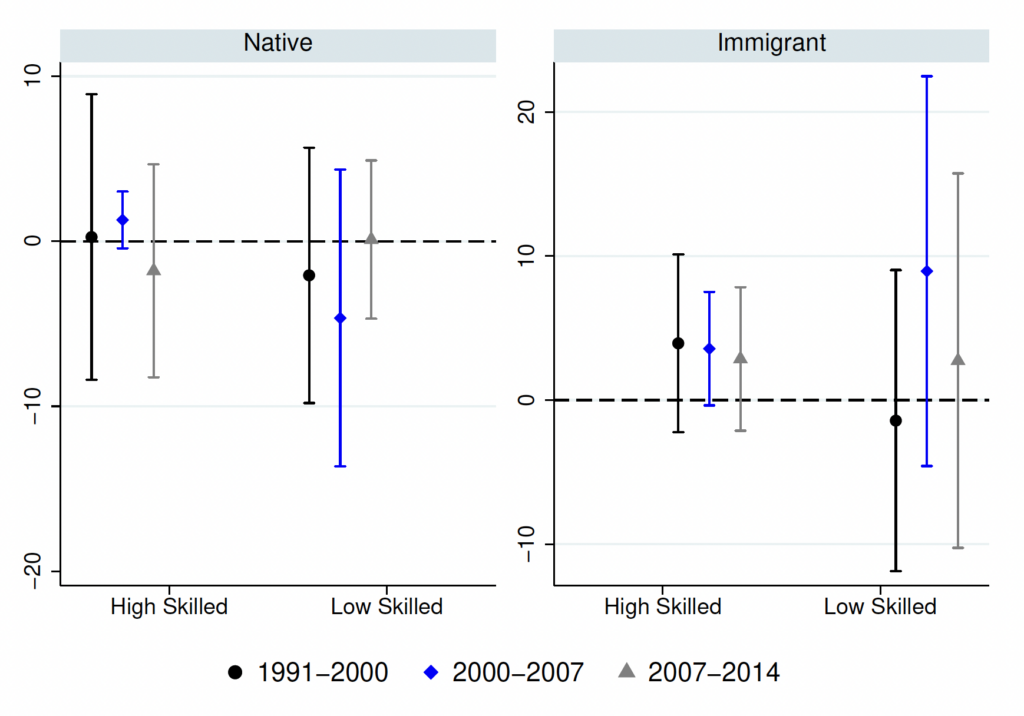
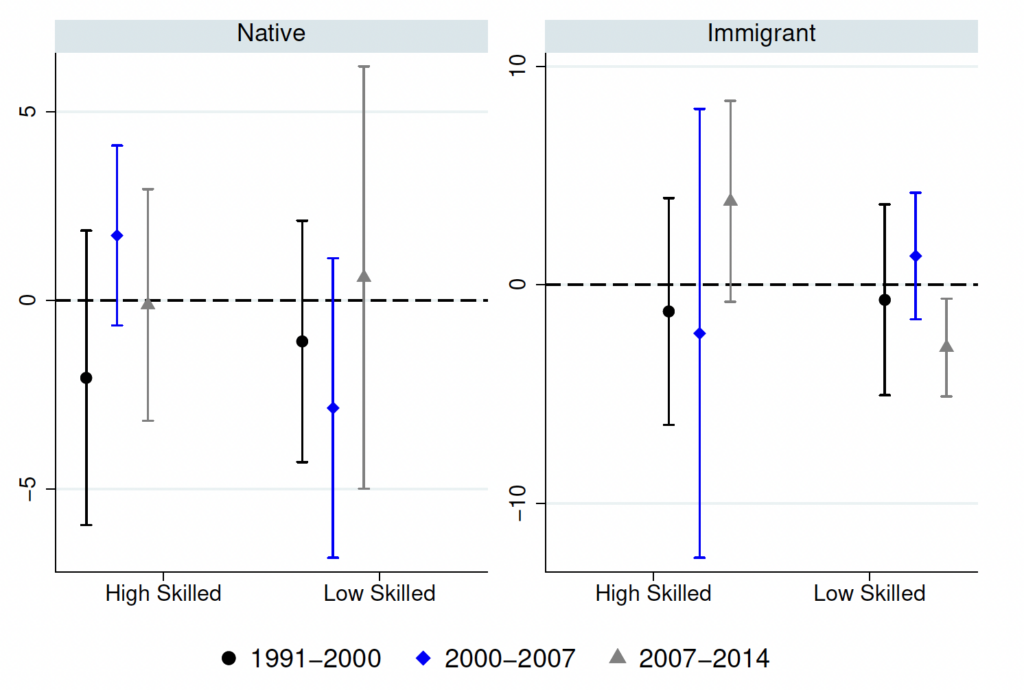
Now, we consider non-STEM workers and their skill distribution. Figures (12) and (13) show the employment and wage effects respectively. Consistent with the employment effects of import penetration, we find negative estimates for both natives and immigrants in the manufacturing sector irrespective of skill level, although the estimates are not precisely estimated. In the non-manufacturing sector, we find statistically significant estimates for both high-skilled and low-skilled natives in employment growth in non-STEM occupations. The corresponding coefficients for immigrants are negative in high-skilled non-STEM occupations and almost zero in low-skilled non-STEM occupations, but not statistically significant in either case. The estimated coefficients provide further evidence that in non-STEM non-manufacturing jobs, only natives had employment gains, and this gain accrued to both high-skilled and low-skilled workers.
Figure 12: in employment for non-STEM occupations across industries by skill level
(a) Manufacturing
(b) Non-manufacturing
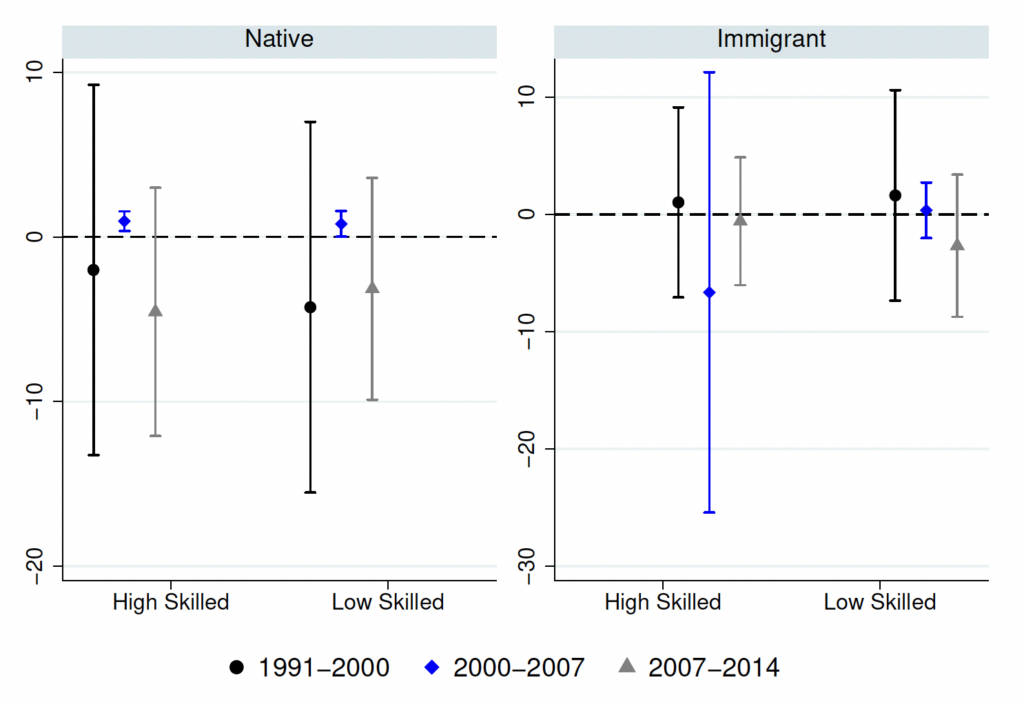
Note: The coefficient reported corresponds to the 2SLS estimation result for in equation 2. The dependent variable is the employment growth in a CZ for each specification. All regressions include the full set of controls and division fixed effects. Regressions are weighted using the start of the period CZ population share in the national population. Vertical bars show the 95% confidence intervals constructed using standard errors clustered at the state level.
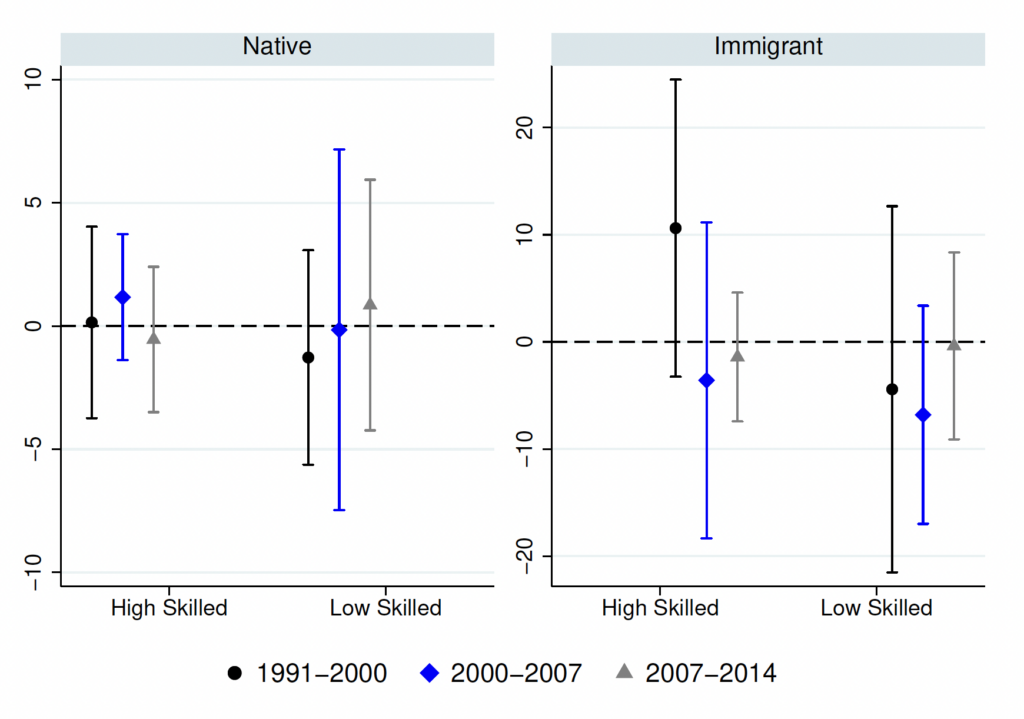
Figure 13: in wages for non-STEM occupations across industries by skill level
(a) Manufacturing
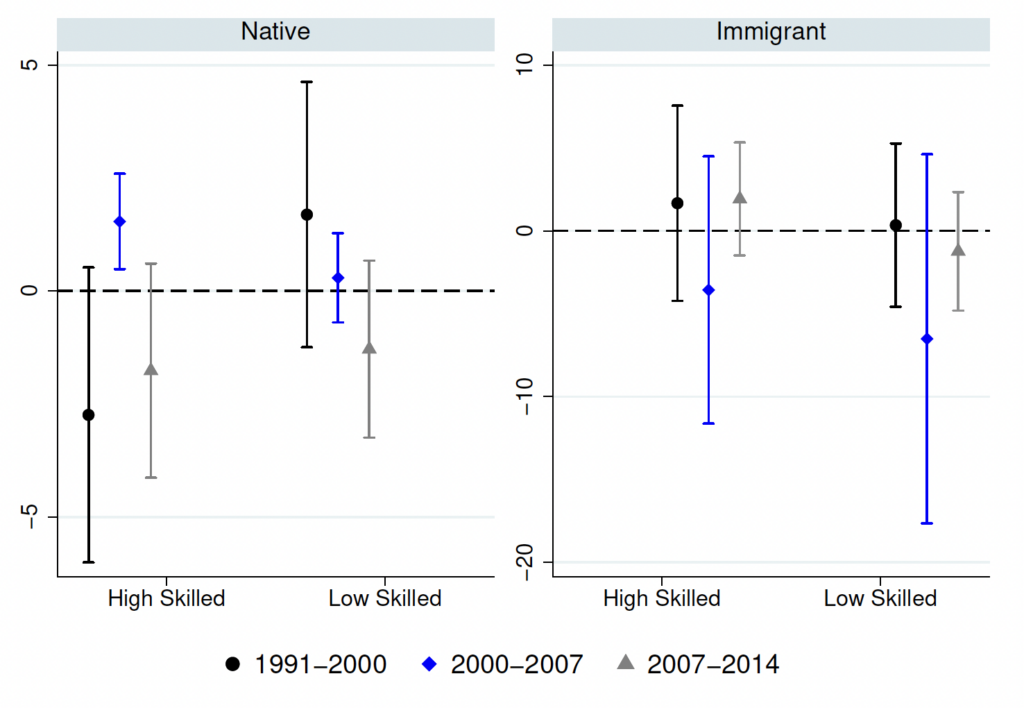
(b) Non-manufacturing
Note: The coefficient reported corresponds to the 2SLS estimation result for in equation 2. The dependent variable is the wage growth in a CZ for each specification. All regressions include the full set of controls and division fixed effects. Regressions are weighted using the start of the period CZ population share in the national population. Vertical bars show the 95% confidence intervals constructed using standard errors clustered at the state level.
From the estimates of non-STEM wage growth in manufacturing from figure 13, the high-skilled natives in non-STEM manufacturing jobs had statistically significant wage gains. This could be explained by the possibility that the initial job losses in manufacturing, primarily affected the least productive workers, presumably earning lower wages. As they left the manufacturing sector to join the non-manufacturing sector, higher-productivity native workers began making up a larger portion of the native labor force in manufacturing, leading to increased wages for them. This explains the positive wage impact on non-STEM natives in manufacturing on aggregate as observed in figure 9. In the non-manufacturing sector, we see an interesting variation in the impact of import penetration on wages between natives and immigrants. From the coefficients, we find that the wage impacts for natives in non-manufacturing non-STEM jobs are positive if the native is highly skilled, but negative if the native is low-skilled. Both these coefficients are not statistically significant. At the same time, looking at the immigrants, we find evidence of imprecisely estimated positive wage growth if the immigrants are low-skilled. This, opposing sign between natives and immigrants suggests complementarity between the two groups. Since high-skilled non-STEM natives increased in non-manufacturing, they act as compliments to low-skilled immigrants, which could explain the positive non-significant wage growth for immigrants in low-skilled non-STEM non-manufacturing.
6 Conclusion
This paper contributes to existing literature by highlighting differences in the impact of trade with China on immigrant workers compared to native workers.
When examining STEM workers, we observe that native workers earn higher wages in manufacturing industries but lower wages in non-manufacturing sectors. One possible explanation for this shift is the movement of immigrant workers. Our findings indicate that immigrant workers are transitioning from the manufacturing sector to the non-manufacturing sector. This shift may contribute to a shortage of STEM workers in manufacturing and an oversupply in non-manufacturing sectors. Policy interventions could encourage immigrant workers to work in the manufacturing sector through changes in immigration policies or incentives for firms in this sector to hire more immigrants.
Regarding non-STEM workers, we observe that native workers are transitioning to non-manufacturing industries. Overall, we note minimal changes in immigrant employment in non-STEM occupations due to trade. However, examining wages reveals two intriguing outcomes: increased wages for native workers in manufacturing and higher wages for immigrants in non-manufacturing. The former may be explained by more productive native workers remaining in manufacturing while less productive ones leave. As for immigrants earning higher wages in non-manufacturing without changes in employment, it suggests a complementary relationship between native and immigrant workers. With more native workers entering non-manufacturing, there’s an increased demand for immigrants. A beneficial policy approach could involve increasing the intake of non-STEM immigrants to complement the rising number of native workers in non-manufacturing sectors.
This overall indicates a shortage of immigrant workers to complement higher-skilled native workers. A straightforward policy implication is to allow more lower-skilled immigrants to collaborate with native workers.
A Appendix
A.1 Additional figures and tables
Figure A1: Nominal value of imports from China between 1991 and 2014
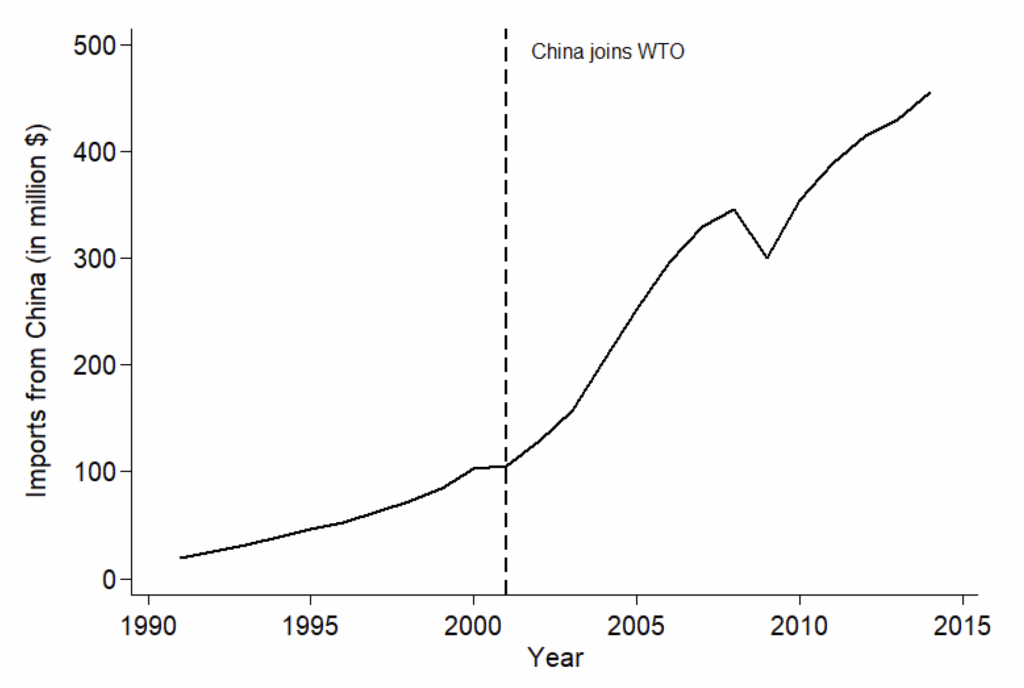
Figure A2: Share of imports from China between 1991 and 2014
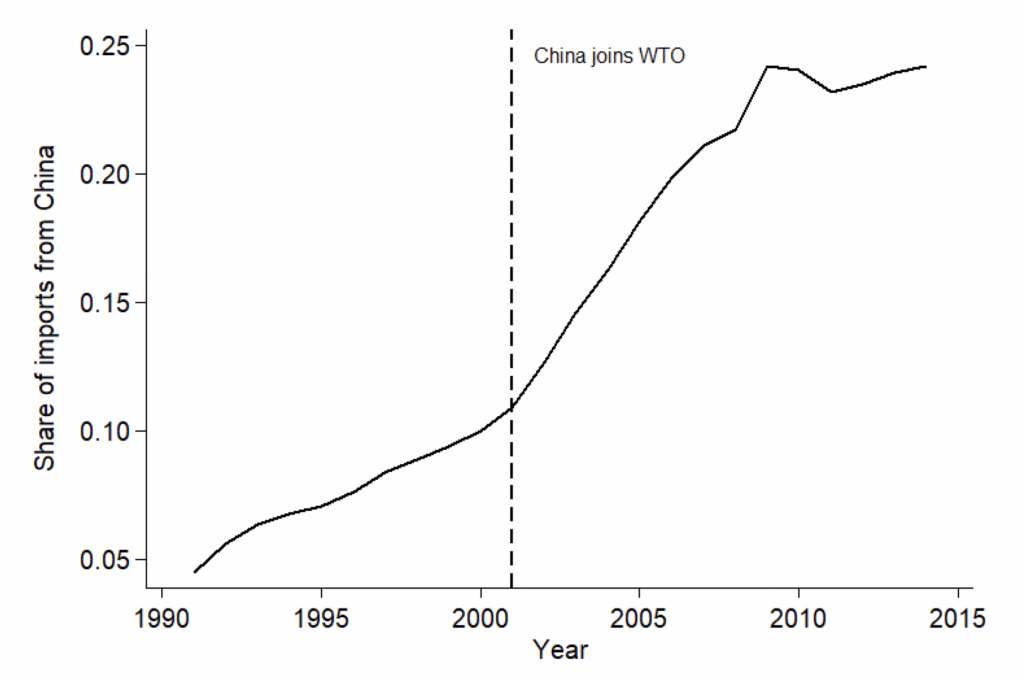
Figure A3: Share of STEM workers in non-manufacturing employment
(a) 2000
(b) 2014
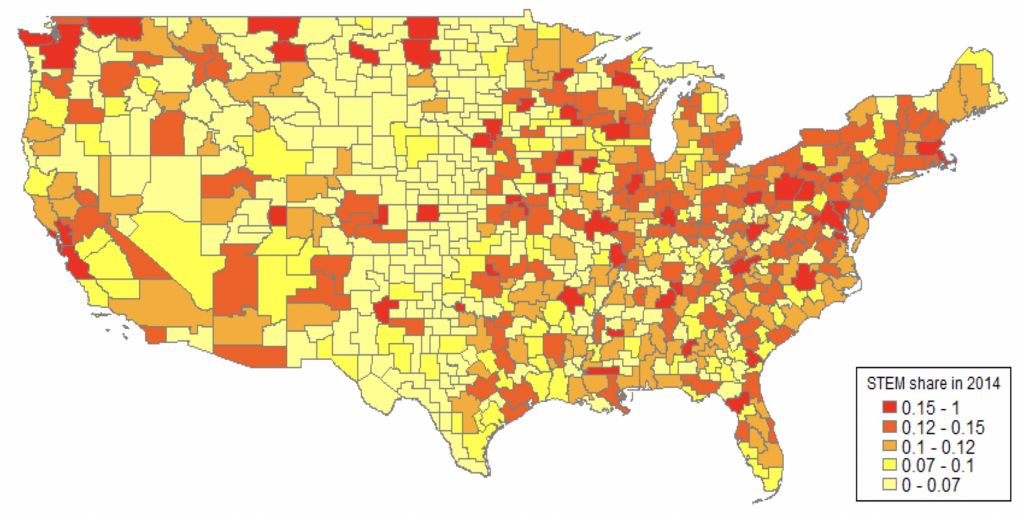
Figure A4: Share of immigrant workers in STEM and non-STEM non-manufacturing employment
(a) STEM workers
(a1) 2000
(a2) 2014
(b) Non-STEM workers
(b1) 2000
(b2) 2014
A.2 Full regression results
References
Abramitzky, R. and Boustan, L. (2017). Immigration in American economic history. Journal of Economic Literature, 55(4):1311–1345.
Acemoglu,D.and Autor,D. (2011). Skills, tasks and technologies: Implications for employment and earnings. In Handbook of Labor Economics, volume 4, pages 1043–1171. Elsevier.
Acemoglu, D., Autor, D., Dorn, D., Hanson, G. H., and Price, B. (2016). Import competition and the great us employment sag of the 2000s. Journal of Labor Economics, 34(S1):S141–S198.
Acemoglu, D. and Restrepo, P. (2020). Robots and jobs: Evidence from us labor markets. Journal of Political Economy, 128(6):2188–2244.
Autor, D., Dorn, D., and Hanson, G. (2019). When work disappears: Manufacturing decline and the falling marriage market value of young men. American Economic Review: Insights, 1(2):161–178.
Autor, D., Dorn, D., and Hanson, G. H. (2021). On the persistence of the China shock. Technical report, National Bureau of Economic Research.
Autor, D., Dorn, D., and Hanson, G. H.(2023). Trading places: Mobility responses of native and foreign-born adults to the China trade shock. Technical report, National Bureau of Economic Research.
Autor, D. H., Dorn, D., and Hanson, G. H.(2013). The China syndrome: Local labor market effects of import competition in the United States. American Economic Review, 103(6):2121–68.
Autor, D. H., Dorn, D., and Hanson, G. H. (2015). Untangling trade and technology: Evidence from local labour markets. The Economic Journal, 125(584):621–646.
Autor, D. H., Dorn, D., Hanson, G. H., and Song, J. (2014). Trade adjustment: Worker-level evidence. The Quarterly Journal of Economics, 129(4):1799–1860.
Basso, G., Peri, G., and Rahman, A. S. (2020). Computerization and immigration: Theory and evidence from the United States. Canadian Journal of Economics/Revue Canadienne d’économique, 53(4):1457–1494.
Batistich, M. K. (2019). Skill-biased technical change and employment in us manufacturing.
Bloom, N., Draca, M., and Van Reenen, J. (2016). Trade induced technical change? the impact of Chinese imports on innovation, it and productivity. The Review of Economic Studies, 83(1):87–117.
Bloom, N., Handley, K., Kurmann, A., and Luck, P. (2019). The impact of Chinese trade on US employment: The good, the bad, and the apocryphal. In American Economic Association Annual Meetings, volume 2019.
Bound, J., Braga, B., Golden, J. M., and Khanna, G. (2015). Recruitment of foreigners in the market for computer scientists in the United States. Journal of Labor Economics, 33(S1):S187–S223.
Brandt, L., Litwack, J., Mileva, E.,Wang, L., Zhang, Y., and Zhao, L. (2020). China’s productivity slowdown and future growth potential.
Cadena, B. C. and Kovak, B. K. (2016). Immigrants equilibrate local labor markets: Evidence from the great recession. American Economic Journal: Applied Economics, 8(1):257–290.
Charles, K. K., Hurst, E., and Schwartz, M. (2019). The transformation of manufacturing and the decline in US employment. NBER Macroeconomics Annual, 33(1):307–372.
Ebenstein, A., Harrison, A., McMillan, M., and Phillips, S. (2014). Estimating the impact of trade and offshoring on American workers using the current population surveys. Review of Economics and Statistics, 96(4):581–595.
Eriksson, K., Russ, K. N., Shambaugh, J. C., and Xu, M. (2021). Reprint: Trade shocks and the shifting landscape of us manufacturing. Journal of International Money and Finance, 114:102407.
Feenstra, R. C., Ma, H., and Xu, Y. (2019). Us exports and employment. Journal of International Economics, 120:46–58.
Fort, T. C., Pierce, J. R., and Schott, P. K. (2018). New perspectives on the decline of us manufacturing employment. Journal of Economic Perspectives, 32(2):47–72.
Gunadi, C. (2019). An inquiry on the impact of highly-skilled stem immigration on the US economy. Labour Economics, 61:101751.
Hanson, G., Liu, C., and McIntosh, C. (2017). The rise and fall of US low-skilled immigration. Technical report, National Bureau of Economic Research.
Hanson, G., Orrenius, P., and Zavodny, M. (2023). US immigration from Latin America in historical perspective. Journal of Economic Perspectives, 37(1):199–222.
Kerr, S. P. and Kerr, W. R. (2013). Immigration and employer transitions for stem workers. American Economic Review, 103(3):193–197.
Kerr, S. P., Kerr, W. R., and Lincoln, W. F. (2015). Skilled immigration and the employment structures of US firms. Journal of Labor Economics, 33(S1):S147–S186.
Mandelman, F. S. and Zlate, A. (2022). Offshoring, automation, low-skilled immigration, and labor market polarization. American Economic Journal: Macroeconomics, 14(1):355–89.
Peri, G., Shih, K., and Sparber, C. (2015). Stem workers, H-1B visas, and productivity in US cities. Journal of Labor Economics, 33(S1):S225–S255.
Pierce, J. R. and Schott, P. K. (2016). The surprisingly swift decline of us manufacturing employment. American Economic Review, 106(7):1632–62.
Ruggles, S., Flood, S., Goeken, R., Grover, J., Meyer, E., and Sobek, M. (2022). Ipums USA: Version 12. Minnesota Population Center, Minneapolis, MN.
Stewart, F., Yeom, M., and Stewart, A. (2020). Stem and soft occupational competencies: analyzing the value of strategic regional human capital. Economic Development Quarterly, 34(4):356–371.
Tolbert, C. M. and Sizer, M. (1996). US commuting zones and labor market areas: A 1990 update. Technical report.
Winters, J. V. (2014). Stem graduates, human capital externalities, and wages in the US. Regional Science and Urban Economics, 48:190–198.
Yu, C. (2023). The role of immigrants in the United States labor market and Chinese import competition. Journal of International Economics, 144:103792.