
 MDPI
MDPIIntroduction
The past two decades have marked the most tumultuous period for the US housing market in decades. Depending on the measure, inflation-adjusted (real) national house prices rose by over 50 percent between 2000 and 2006. They then fell by 25 to 35 percent from 2006 to 2011 but have since rebounded, nearly to their 2006 peak. During this same period, the United States experienced its most severe recession since the Great Depression—some of the scars from which have not fully healed. Naturally, policymakers and 2 the public are eager to understand the origins of the previous crisis and, more importantly, how to prevent any reoccurrences.
The US system of housing finance has received particular attention and at times criticism for its possible role in encouraging excess debt and sowing the seeds for greater economic fragility. Indeed, the United States is quite unique in how it approaches housing policy compared to the vast majority of other countries—both because of its strong preference for homeownership over renting and because of its reliance on 30-year fixed-rate mortgages securitized by large government sponsored enterprises (GSEs) that enjoy government backing in the form of a bailout guarantee in the event of financial distress. While the origins of the GSEs can be found in the midst of addressing the Great Depression turmoil, they have since morphed into a bipartisan vehicle either to promote social policy on the left or to champion an “ownership society” extolled by some on the right.
Since the financial crisis, however, this consensus has disappeared when it comes to evaluating potential reforms. Moreover, states have taken divergent approaches to how actively they intervene in the housing market, particularly with regard to their legal environment for foreclosures. On the one hand, some people have expressed a preference for incremental changes that more or less leave the basic foundations of America’s housing finance in place, albeit with some legislative and regulatory tweaks. On the other hand, some voices have called for a fundamental redesign of the US housing finance architecture. This paper discusses housing finance reforms over the entire life cycle of a loan, from the origination (e.g., what to do about the GSEs) to termination (e.g., what to do about foreclosure laws). Other housing policy issues that do not pertain directly to the design and functioning of the mortgage market (e.g., what to do about housing tax subsidies or zoning laws) are not discussed here in the interest of space.
US Housing Market Behavior from 2000 to Present
The nature and scope of any discussions surrounding reforms to the housing finance system inevitably reflect peoples’ conceptions of what caused the last crisis. Thus, before delving into policy reforms, it is imperative to have a clear understanding of what forces have been driving housing market behavior in America over the past two decades. While much attention has been paid to the overall national numbers, stark geographic patterns emerge that highlight the uneven nature of the boom, bust, and recovery. Importantly, these patterns shed light on the role that credit plays in driving housing dynamics and its consequences for the rest of the economy.
House Prices
The rise in house prices between 2000 and 2006 largely reflects a disproportionate boom in the coastal and Sand States, as shown in the top left corner of figure 1. Whereas many counties in California, Arizona, Nevada, Florida, and the I-95 corridor from Washington, DC, to Boston experienced price gains of over 80 percent in real terms, much of middle America saw relatively modest house price increases, with the Mountain West experiencing moderate price appreciation. The top right corner of figure 1 shows that the coastal and Sand States also suffered the brunt of the house price declines between 2006 and 2011, whereas parts of Texas, North Dakota, and Wyoming actually experienced increases in house prices during the financial crisis and its aftermath.
Figure 1. Real House Prices
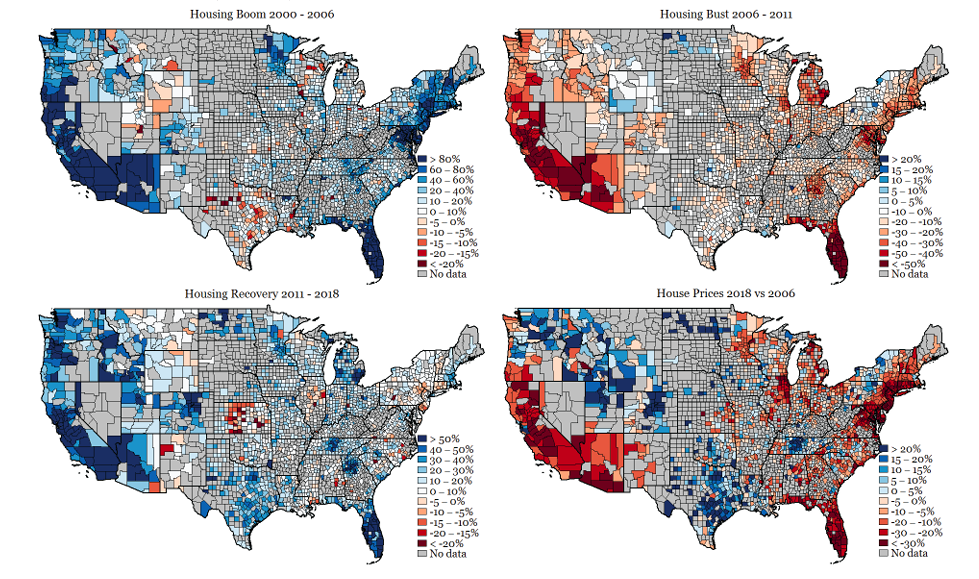
Source: Zillow Home Value Index, adjusted for inflation by the Personal Consumption Expenditures Index (PCE).
Similar patterns emerge in data from the Federal Housing Finance Agency (FHFA), which includes greater geographical coverage (i.e., less missing data) but is constrained to those properties which are financed by a mortgage that has been purchased or securitized by Fannie Mae or Freddie Mac. As is evident from the bottom right corner of figure 2, this segment of the housing market has not yet recovered in real terms for much of the country outside of the Plains, the Mountain West, and portions of the Pacific Northwest. The most notable exceptions include Texas and North Dakota, which maintained robust economies during the financial crisis.
Figure 2. Real House Prices (FHFA)
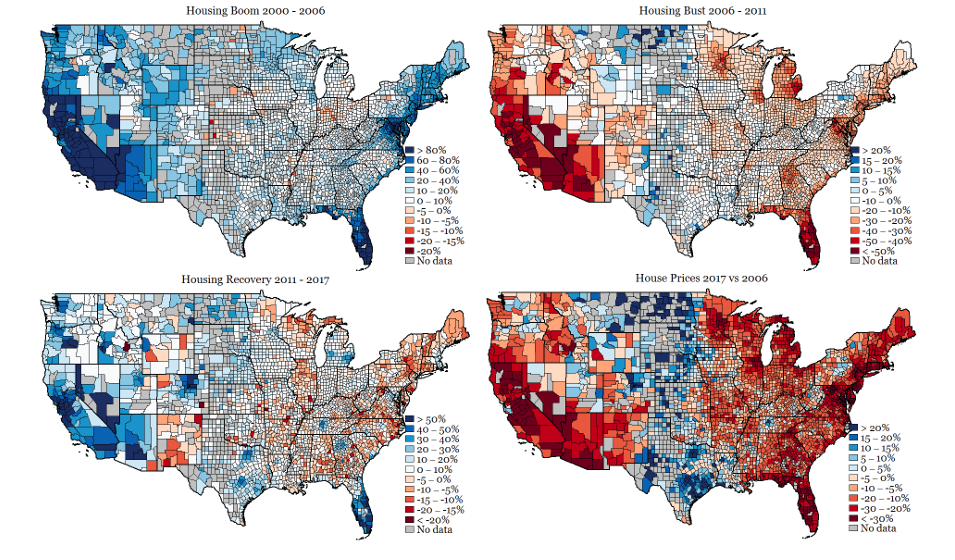
Source: FHFA House Price Index, adjusted for inflation by the PCE.
However, in dollar (nominal) terms, house prices have largely recovered throughout most of the county outside the coastal and Sand States, as shown in figure 3. While inflation-adjusted prices are usually the more relevant variable of interest, nominal house prices are significant because they determine home equity and, by extension, the likelihood of mortgage default. In particular, as long as homeowners have a sufficient home equity pad, they can typically sell their house in the event of financial distress prior to being foreclosed on.
Figure 3. Nominal House Prices
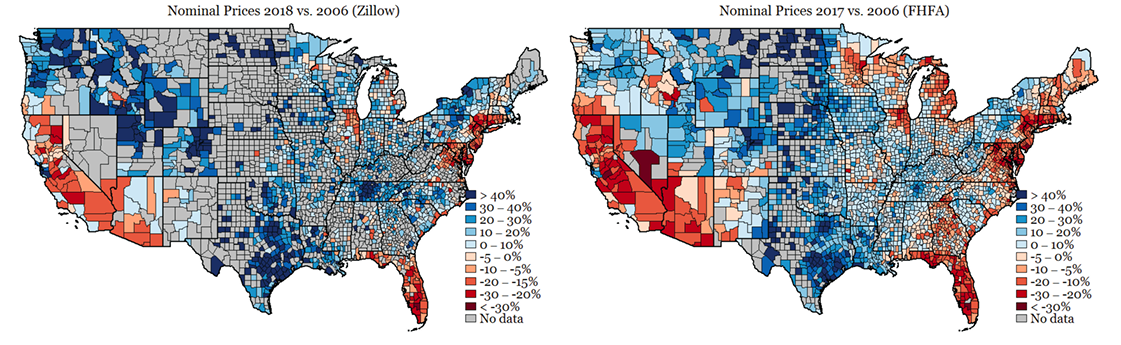
Sources: Zillow Home Value Index (Left) and FHFA House Price Index (Right).
House Prices by Property Tier
To understand the role of credit, it is useful to look not just at variation within geographic markets but also within such markets across price tiers. At the national level, the data in figure 4 reveal greater price volatility at the bottom end of the market during the boom, the bust, and the recovery. One possible explanation for greater price swings in this segment is that buyers of starter homes are most sensitive to economic conditions in the credit and labor markets, thereby making them more likely to transit back and forth between owning and renting.
Figure 4. National Real House Prices
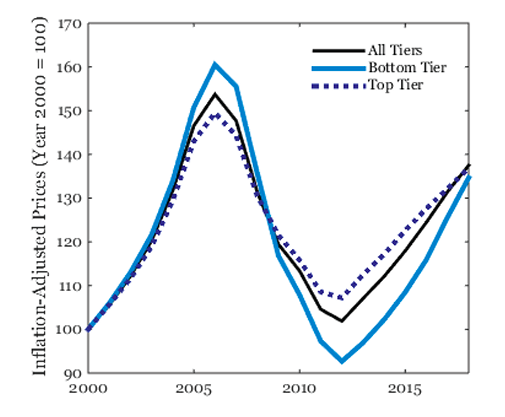
Source: Zillow Home Value Index.
Looking both within and across geographies, figure 5 reveals some striking patterns for the housing market now relative to 2006. In general, the bottom tier has fared especially poorly in counties where house prices remain below their peak, such as in much of California (except the San Francisco Bay area), Las Vegas, Arizona, the Chicago metro area, and the Northeast I-95 corridor. However, house prices at the bottom have skyrocketed in parts of the Mountain West and Pacific Northwest. Texas also emerges as an interesting case, with house prices there rising far more rapidly from 2011 to 2018 than during the 2000–2006 boom. The bottom left panel shows that the lower property tier has outperformed the top since 2011 along much of the West Coast, Arizona, and Florida, but the top tier suffered less during the crisis, leading to better overall performance in much of the country from 2006 to 2018, as shown in the bottom right panel.
Figure 5. House Prices by Tier
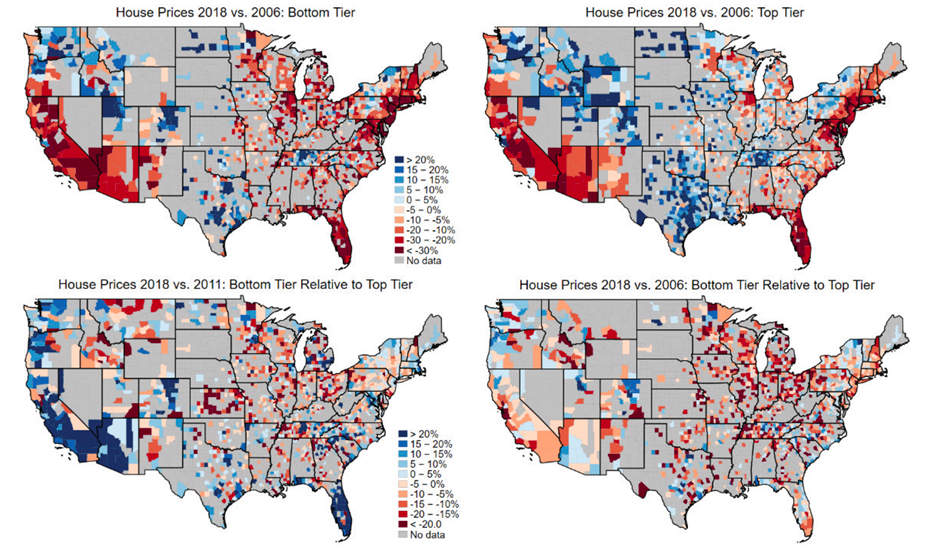
Source: Zillow Home Value Index, adjusted for inflation by the PCE.
For greater precision, figure 6 compares the change in house prices for the bottom and top tiers of the market during the boom, bust, and recovery with a best fit line plotted through the data to aid interpretation. The flatter is the line, the greater is the change in house prices at the bottom end of the market compared to the top. Evidently, house prices at the bottom rose faster than those at the top during the boom and then fell by more during the bust. The recovery continues this general pattern but stands out by just how stark price increases have been for lower-tier properties compared to top-end homes, thus putting homeownership further out of reach for those looking to get their start on the property ladder.
Figure 6. Comparison of Price Tiers
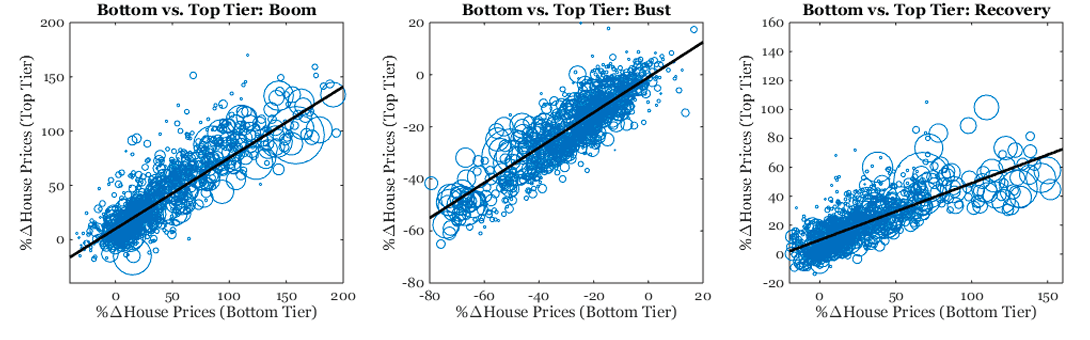
Note: Each circle represents a county (size indicates population). Source: Zillow Home Value Index.
Construction
Whereas house price appreciation was strongest on the coasts and in the Sand States during the boom, the increase in total construction between 2000 and 2005 exhibited a less clear-cut geographical pattern, as shown in the top left of figure 7. In some cases, such as inland California, Florida, and Arizona, rapid house price appreciation was accompanied by a surge in construction. However, some markets, such as coastal California and much of New England, exhibited high house price appreciation with little change in construction—perhaps indicative of housing supply constraints. Other markets, such as much of Texas, exhibited a surge in construction with relatively modest price gains. By contrast, construction collapsed dramatically throughout the entire country during the financial crisis and its aftermath, as shown in the top right portion of figure 7. Moreover, even though construction has recovered significantly since the depths of 2011, the bottom right shows that building permits are still far below their 2005 peak.
Figure 7. New Single-Family Building Permits
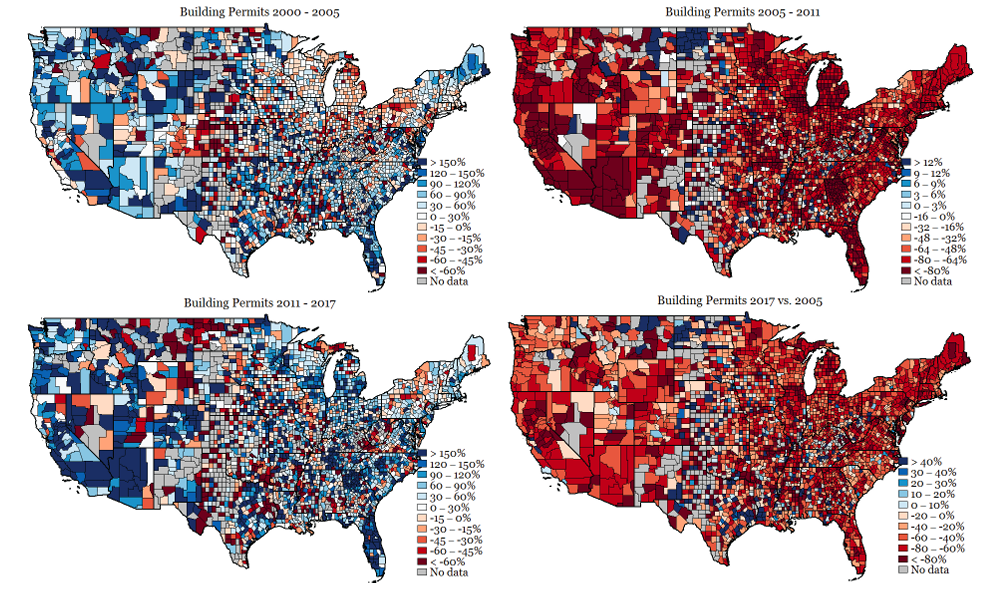
Source: Census Building Permits Survey.
Homeownership
The twin forces of rising house prices and falling construction have reduced the availability of affordable homes for purchase, with homeownership suffering as a result. Nationwide, the homeownership rate has fallen from 69 percent in 2006 to only 64 percent today. Figure 8 shows the geographical pattern of the decline. California, Nevada, Arizona, and Florida have all experienced a dramatic collapse in homeownership, but they are joined by significant portions of the country.
Figure 8. Change in Homeownership Rate 2005 – 2017
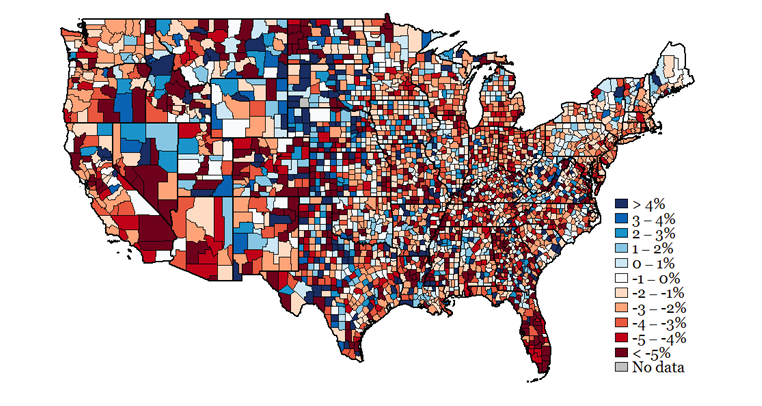
Source: American Community Survey.
The relationship between the homeownership rate and house price appreciation during the recent recovery also marks a dramatic contrast from the boom. Between 2000 and 2006, there was a weak but positive relationship across counties between changes in the homeownership rate and changes in house prices. As shown in the top row of figure 9, this relationship was entirely driven by the bottom tier of the market, with no discernible relationship between house prices and homeownership among the most expensive homes. In contrast with the boom, counties that experienced the strongest recovery in house prices since the bust have experienced the largest homeownership rate declines, especially among the bottom tier of homes.
Figure 9. House Prices and Homeownership
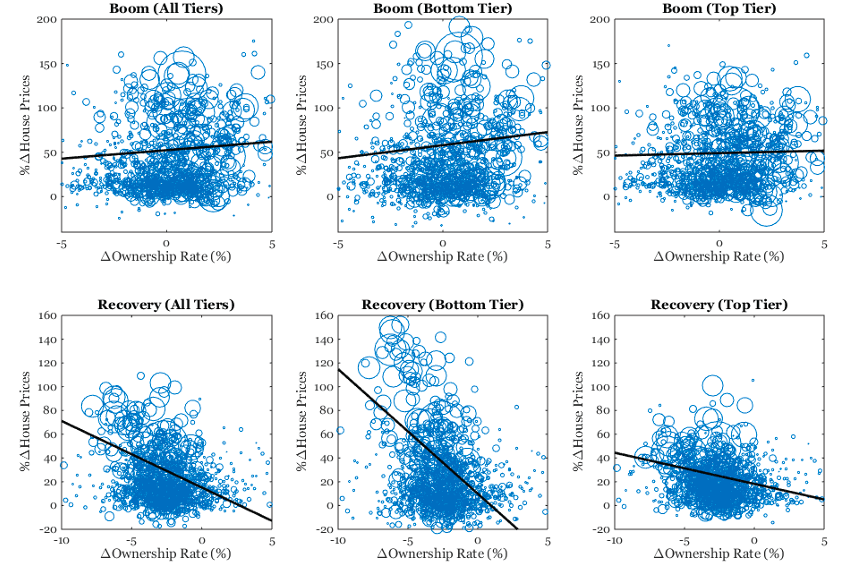
Each circle represents a county (size indicates population). Sources: Zillow Home Value Index and American Community Survey. The boom refers to 2000 – 2006; the recovery refers to 2011 – 2018.
Credit as a Driver of the Housing Roller Coaster
An extensive body of academic research points to evolving credit conditions as a key driver of house prices.1See, for example, Jack Favilukis, Sydney C. Ludvigson, and Stijn Van Nieuwerburgh, “The Macroeconomic Effects of Housing Wealth, Housing Finance, and Limited Risk-Sharing in General Equilibrium,” Journal of Political Economy 125, no. 1 (2017): 140–223; Dan Greenwald and Adam Guren, “Do Credit Conditions Move House Prices?” (Society for Economic Dynamics, Meeting Papers No. 1334, 2019); Josue Cox and Sydney C. Ludvigson, “Drivers of the Great Housing Boom-Bust: Credit Conditions, Beliefs, or Both?” (NBER Working Paper No. 25285, National Bureau of Economic Research, Cambridge, MA, November 2018); Morris Davis and Stijn Van Nieuwerbugh, “Housing, Finance and the Macroeconomy,” in Handbook of Regional and Urban Economics, vol. 5, ed. Gilles Duranton, J. Vernon Henderson, and William Strange (Amsterdam: Elsevier, 2015), 753–811; and Monika Piazzesi and Martin Schneider, “Housing and Macroeconomics,” Handbook of Macroeconomics, vol. 2, ed. John Taylor and Harald Uhlig (Amsterdam: Elsevier, 2016), 1547–1640. In particular, the demand for housing increases both when new borrowers gain access to credit and when the cost of credit falls as mortgage rates decline. From the mid to late 1990s through the early 2000s, the US mortgage market went through a sea change along both of these dimensions. Prior to then, most lending institutions largely followed a credit rationing model during the mortgage origination process. Loan officers would personally review mortgage applications and decide whether the loan merited inclusion in the broader risk pool, in which case borrowers were charged a common interest rate. Homeowners looking to borrow at high loan-to-value or debt-to-income ratios were simply denied. However, as the use of credit scores became widespread, banks began replacing human risk assessment with computer-based models, and financial innovation led to the rapid development of a large, private label securities market that traded in non-conforming loans.2Christopher L. Foote, Lara Loewenstein, and Paul S. Willen, “Technological Innovation in Mortgage Underwriting and the Growth in Credit: 1985–2015” (FRB of Cleveland Working Paper 18-16, Federal Reserve Bank of Cleveland, Cleveland, OH, December 2018). At the same time, fixed mortgage rates fell from approximately 8 percent in the mid-1990s to under 5.5 percent in the early 2000s.3See http://www.freddiemac.com/pmms/pmms30.html
Borrower Risk during the Housing Boom
Outstanding mortgage debt grew by an astounding 250 percent between 1997 and 2005.4 Richard Green and Susan M. Wachter, “The Housing Finance Revolution” (Proceedings, Economic Policy Symposium, Jackson Hole, Federal Reserve Bank of Kansas City, 2007), 21–67. However, underneath this top-line number were far more significant changes to the market—some based in fact and others more in perception. Two forces in particular have taken much of the blame for the foreclosure crisis—namely, a purported decline in lending standards coupled with the introduction of new mortgage products that many considered to be extra risky. Regarding the first issue of lending standards, the movie “The Big Short” helped popularize the notion that lending institutions during the boom were in the mood to make risky loans to unqualified borrowers without any regard for likelihood of repayment. Indeed, some of the early academic research also pointed to an expansion in subprime lending as sowing the seeds for the crisis.5See, for example, Atif Mian, Amir Sufi, and Francesco Trebbi, “The Consequences of Mortgage Credit Expansion: Evidence from the U.S. Mortgage Default Crisis,” Quarterly Journal of Economics 124, no. 4 (November 2009): 1449–96.
Figure 10. Mortgage Characteristics during the Boom
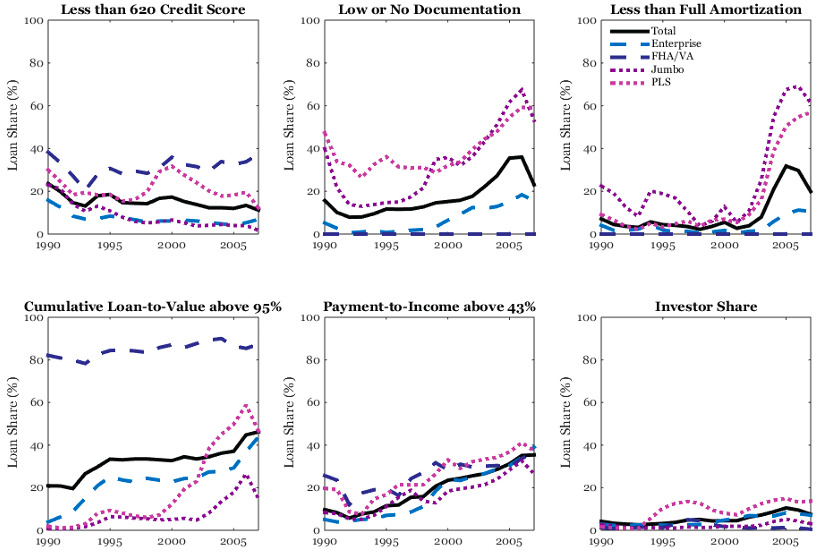
Source: Data from Morris Davis, William Larson, and Stephen D. Oliner, “Mortgage Risk Since 1990”.6Morris Davis, William Larson, and Stephen D. Oliner, “Mortgage Risk Since 1990” (AEI Economics Working Paper 1001502, American Enterprise Institute, Washington, DC, 2019).
Although the share of loans requiring little or no documentation increased at the tail end of the boom, the evidence indicates that mortgage credit expanded uniformly across the income distribution, as shown in figure 11.76 Morris Davis, William Larson, and Stephen D. Oliner, “Mortgage Risk Since 1990” (AEI Economics Working Paper 1001502, American Enterprise Institute, Washington, DC, 2019). 7 See, for example, Manuel Adelino, Antionette Schoar, and Felipe Severino, “Dynamics of Housing Debt in the Recent Boom and Great Recession,” in NBER Macroeconomics Annual 2017, ed. Martin Eichenbaum and Jonathan Parker (Chicago: University of Chicago Press, 2018), 32, 265–311; Christopher L. Foote, Lara Loewenstein, and Paul S. Willen, “Cross-Sectional Patterns of Mortgage Debt During the Housing Boom: Evidence and Implications” (NBER Working Paper No. 22985, National Bureau of Economic Research, Cambridge, MA, December 2016); Stefania Albanesi, Giacomo De Giorgi, and Jaromir Nosal, “Credit Growth and the Financial Crisis: A New Narrative” (NBER Working Paper No. 23740, National Bureau of Economic Research, August 2017); and Fernando Ferreira and Joseph Gyourko, “A New Look at the U.S. Foreclosure Crisis: Panel Data Evidence of Prime and Subprime Borrowers from 1997 to 2012” (NBER Working Paper No. 21261, National Bureau of Economic Research, Cambridge, MA, June 2015). However, deteriorations in other measures of mortgage risk hint at possible sources of the crisis. First, the data reveal a marked increase in payment-to-income and loan-to-value ratios during the 1990s and 2000s.8See figure 5 of Adam J. Levitin and Susan M. Wachter, “Second Liens and the Leverage Option,” Vanderbilt Law Review 68, no. 5 (2015): 1243–94 for LTV data and Davis, Larson, and Oliner (2019) for PTI data. In addition, the tail end of the boom witnessed a significant rise in the share of loans with less than full amortization as well as an increase in the number of loans going to investors rather than owner-occupiers.
Figure 11. Mortgage Debt by Income
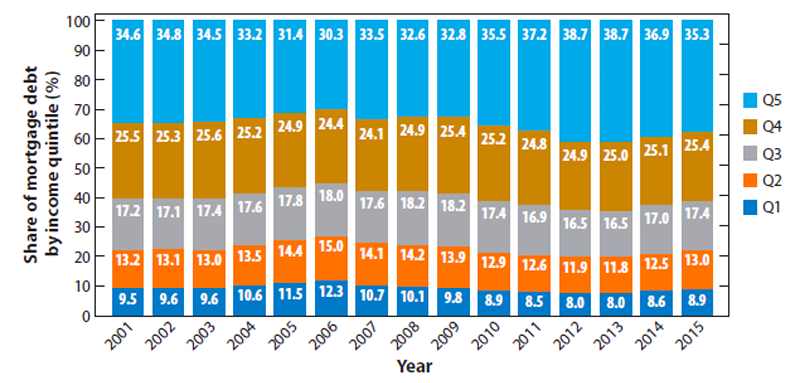
Source: Figure 1 in Manuel Adelino, Antionette Schoar, and Felipe Severino, “The Role of Housing and Mortgage Markets in the Financial Crisis.”9Manuel Adelino, Antionette Schoar, and Felipe Severino, “The Role of Housing and Mortgage Markets in the Financial Crisis,” Annual Review of Financial Economics 10 (November 2018): 25–41.
Mortgage Default and Its Causes
Research indicates that the increased prevalence of non-traditional “exotic” mortgage products—often featuring initial teaser rates followed by an adjustable rate structure—and greater investor involvement in the mortgage market were both contributing factors to the subsequent foreclosure crisis.10 For a discussion of the role of investors, see Stefania Albanesi, Giacomo De Giorgi, and Jaromir Nosal, “Credit Growth and the Financial Crisis: A New Narrative” (NBER Working Paper No. 23740, National Bureau of Economic Research, Cambridge, MA, August 2017). For an analysis of the role of “exotic” mortgages, see Dean Corbae and Erwan Quintin, “Leverage and the Foreclosure Crisis,” Journal of Political Economy 123, no. 1 (2015): 1–65. From 2003 to 2005, when mortgage rates fell to their lowest level on record, the share of adjustable rate mortgages spiked from approximately 15 percent to nearly 40 percent, allowing homeowners to finance large loans at a low monthly cost.11See the FHFA Mortgage Interest Rate Survey for data on the share of adjustable rate mortgages between 1990 and 2011. Federal Housing Finance Agency, “Mortgage Interest Rate Survey,” fhfa.gov, accessed May 2019, https://www.fhfa.gov/DataTools/Downloads/Pages/MonthlyInterest-Rate-Data.aspx. However, as rates rose in 2006 and 2007, many of these adjustable rate borrowers were surprised by a large jump in monthly payments, as shown in an illustrative example in figure 12. In this example, a nearly 2 percentage point rise in interest rates gives rise to almost a $350 increase in monthly payments—consisting of more than a $450 jump in interest and over a $100 reduction in principal, thus reducing the pace of deleveraging.
Figure 12. The Impact of Rate Resets on a 97 percent LTV Adjustable Rate Mortgage (ARM) for a $300,000 House
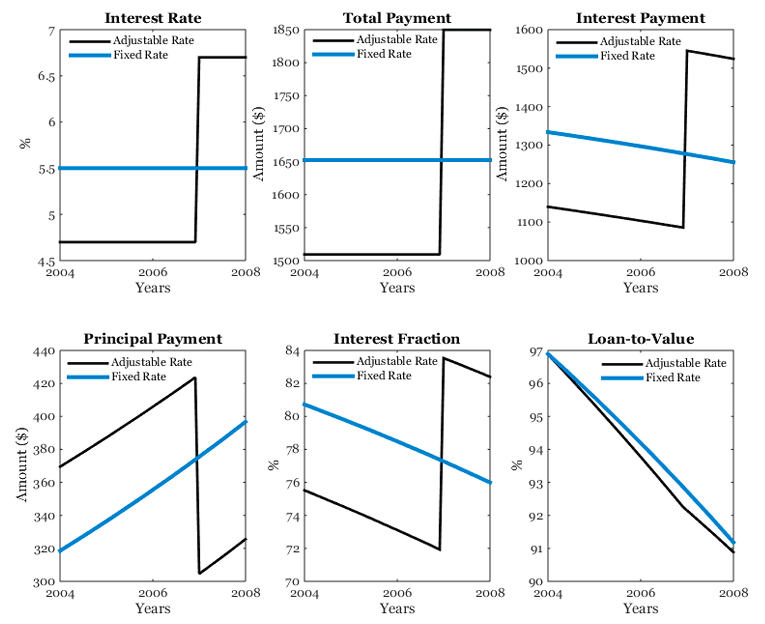
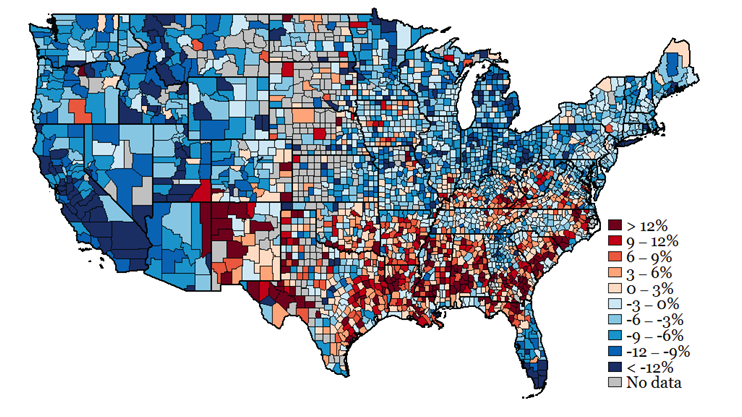
If the increase in monthly payments were the only consequence of rising rates, the foreclosure crisis would not have materialized. However, the combination of high payment-to-income ratios and high loan-to value ratios meant that homeowners who could not afford to service their debt after the rate hike also had essentially no equity cushion to facilitate selling their homes. This toxic combination of budgetary strain and debt overhang triggered the foreclosure crisis, which was in turn amplified by the heightened saturation of investors with little personal stake in keeping their investment homes who were more willing to engage in “strategic” default if they had a negative equity position. By contrast, owner-occupiers tend to continue making mortgage payments when feasible even if they could increase their net worth position by defaulting and walking away. Figure 13 reveals the geographical pattern of the foreclosure wave that peaked in 2010. Notably, the counties with the largest spike in mortgage default tended to be those which suffered the worst house price declines, with research indicating that causality goes both ways: foreclosures were both a symptom and a cause of spiraling house price declines.12For a thorough discussion of negative foreclosure externalities, see Adam Guren and Tim McQuade, “How Do Foreclosures Exacerbate Downturns?” (Working Paper No. WP2018-007, Department of Economics, Boston University, Boston, MA, July 2018).
Figure 13. Mortgage Default Rate in 2010
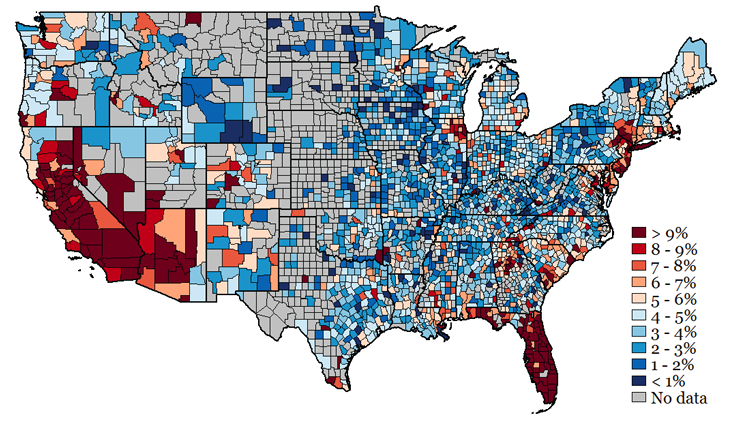
Source: NY Fed Consumer Credit Panel.
Returning again to the notion of the subprime crisis, figure 14 reveals little relationship across counties between the increase in the homeownership rate during the boom and the peak of the mortgage delinquency rate. If expanded credit for marginal buyers were the underlying cause of the crisis, one would expect to see a much stronger relationship between these measures. By contrast, the data reveal a strong connection between the size of the house price boom—which is driven by factors that affect housing demand for all buyers—and subsequent mortgage default.
Figure 14. 2000–2006 Housing Boom vs. Mortgage Default in 2010
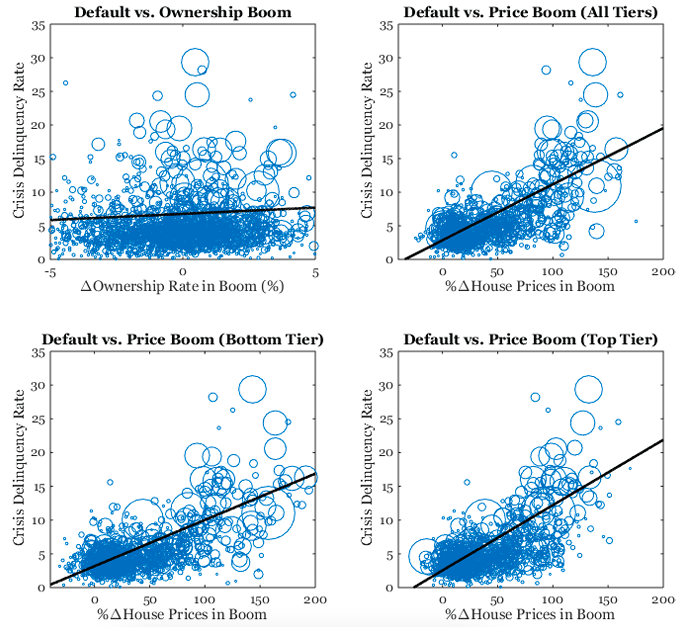
Each circle represents a county (size indicates population). Sources: Ownership: Census; Prices: Zillow Home Value Index; Default: NY Fed Consumer Credit Panel.
The Evolution of the US Mortgage Market since the Financial Crisis
Although nominal house prices nationwide have surpassed their 2006 peak, the mortgage market today looks in some ways quite different than it did over a decade ago. With regard to borrower composition, figure 15 shows that the share of loans going to borrowers with low credit scores has plummeted, and the average credit score has risen from approximately 700 to 740 over the past decade. Moreover, while the private-label securities (PLS) market has mostly evaporated, those PLS loans which remain feature much lower loan-to-value and payment-to-income ratios and much higher borrower credit scores. Furthermore, the share of loans with less than full amortization or which required little or no documentation at origination has plummeted. Thus, from the perspective of borrower characteristics and non-traditional loan features, the mortgage market at surface value appears much safer in recent years than during the boom. However, figure 15 also reveals that average loan-to-value and payment-to-income ratios are almost unchanged, indicating that highly leveraged borrowing is still the norm. That said, the share of loans with a payment-to-income ratio above 50 percent has declined from a peak of 15 percent in 2007 to only 6.3 percent in 2007, driven largely by tightened requirements for enterprise loans. While the share of FHA loans with such high payment-to-income ratios has doubled from 11.2 percent in 2007 to 22.2 percent in 2017, this increase does not fully compensate for the collapse in the share of corresponding high payment-to-income enterprise loans from 19.5 percent to 0.4 percent.
Figure 15. Mortgage Risk Characteristics during the Recovery
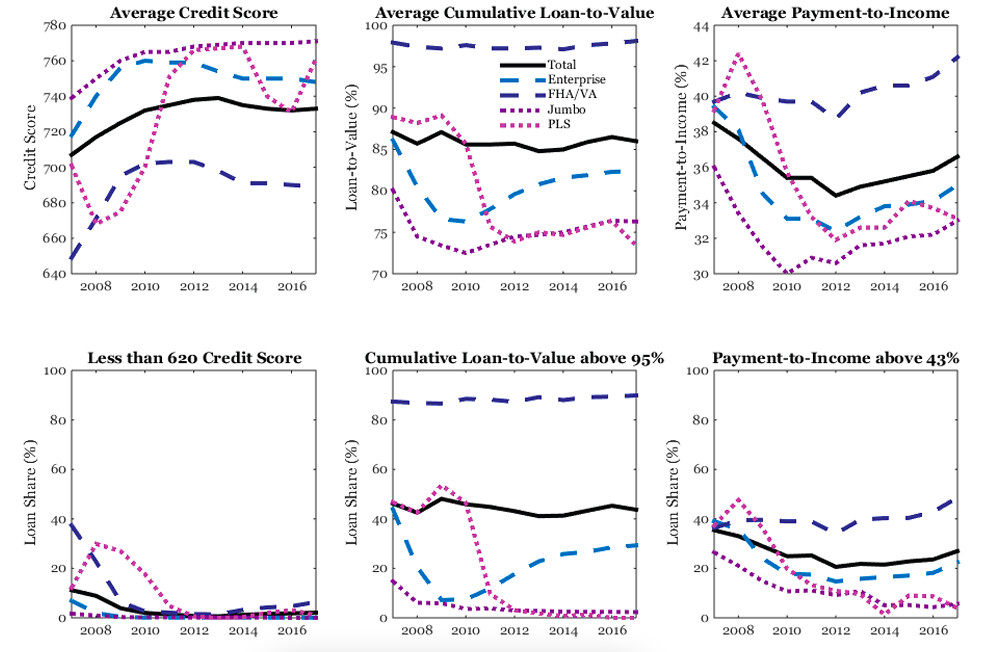
Source: Morris Davis, William Larson, and Stephen D. Oliner, “Mortgage Risk Since 1990”
To reconcile these facts, figure 16 shows that the market share of FHA and VA loans—which tend to feature low down payments, high payments to income, and less creditworthy borrowers—has risen dramatically over the past decade. Thus, from a big picture perspective, there has been a significant shifting of risk from the private sector to the government as the FHA and VA absorb much of the former PLS market share. Furthermore, the expansion of the FHA/VA market share has occurred disproportionately in the same coastal and Sand States that experienced the largest swings in house prices during the previous boom and bust. Compounding matters, these states now feature ratios of average loan size to average income that exceed their 2007 values, as shown in the bottom row of figure 16. In addition to rising loan amounts, figure 17 shows that loan denial rates have fallen across much of the country, particularly in those areas where FHA and VA loans have most augmented their market share.
Figure 16. Combined Share of FHA and VA Loans
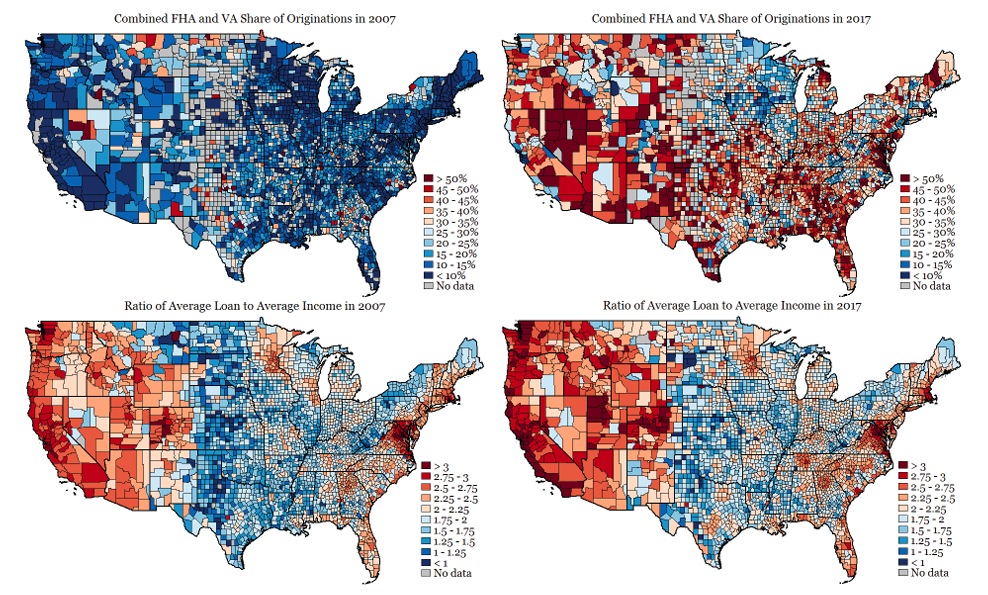
Source: HMDA.
Figure 17. Loan Denial Rates 2007 – 2017
Source: Home Mortgage Disclosure Act.
To give further perspective on how mortgage risk has evolved since the 2006–2011 housing bust, the top row of figure 18 plots the relationship across counties between conditions before the crisis and the 2010 peak in the mortgage default rate. Evidently, counties with higher debt-to-income ratios, higher loan denial rates, and lower FHA and VA shares in 2007 tended to experience the worst mortgage default. However, many of these relationships have been changing over the past decade. Specifically, those counties with the highest default rate in 2010 have experienced the largest drop in loan denial rates and rise in the FHA/VA share from 2007 to 2017.
Figure 18. Default and Credit Relationships 2007–2017
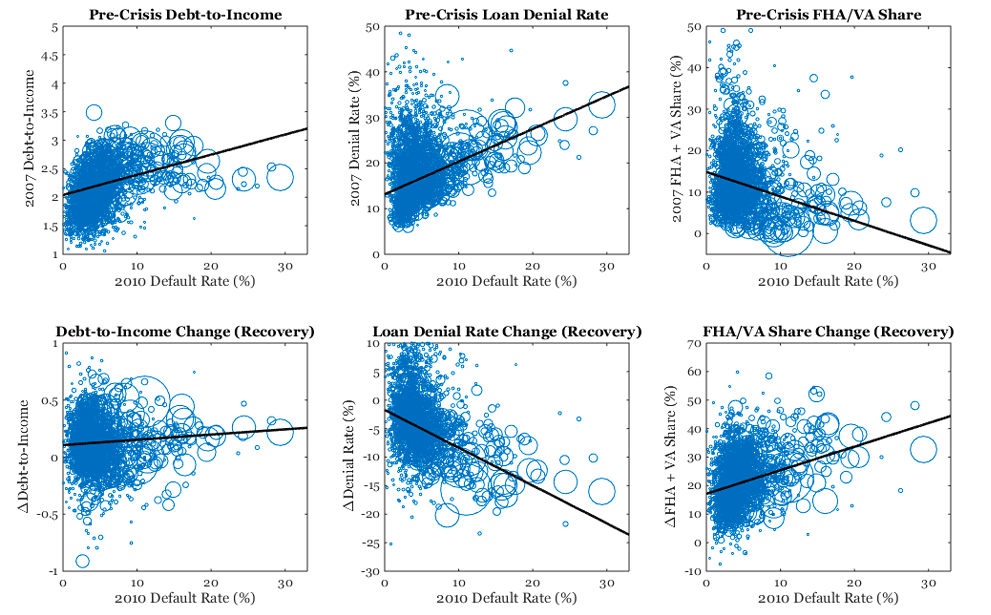
Each circle represents a county (size indicates population). Source: Home Mortgage Disclosure Act.
During this time same period, counties where FHA and VA loans have gained the most in market share have also witnessed the largest house price increases, but only for the bottom tier of properties, as indicated by figure 19. In other words, the expansion in FHA and VA loans has coincided with starter homes becoming significantly more expensive and less affordable.
Figure 19. House Prices and FHA/VA Share
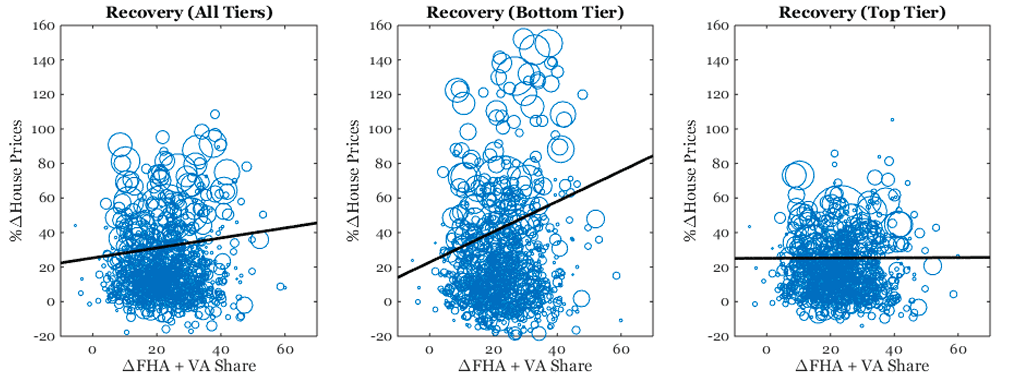
Each circle represents a county (size indicates population). Sources: Prices (Zillow Home Value Index); FHA/VA Share (Home Mortgage Disclosure Act).
Along other dimensions of credit, data in figure 20 reveal that counties in which the loan denial rate has fallen the most have experienced the most robust house price appreciation during the recovery, with gains again coming disproportionately at the bottom end of the housing market. Notably, causation might go either way to explain this relationship. One possibility is that looser credit in certain locations is driving house prices disproportionately higher, and another plausible hypothesis is that other factors are driving up house prices, with the associated increase in home equity resulting in lower foreclosure risk and, thus, lower denial rates. Similarly, causality could run either way to explain the positive association between rising debt-to-income ratios and house prices.
Figure 20. Credit Conditions and House Prices during the Recovery
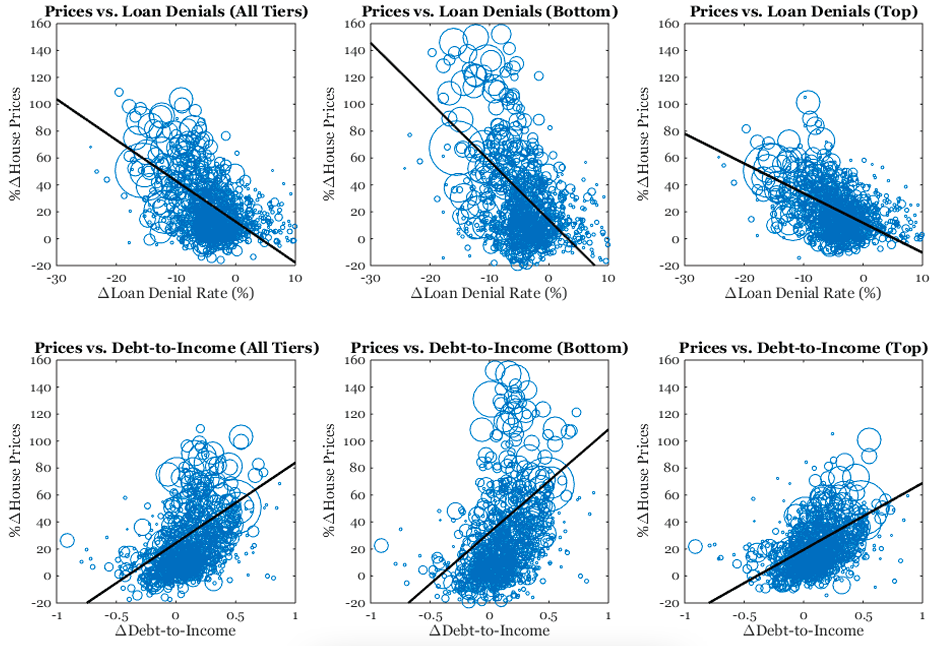
Each circle represents a county (size indicates population). Sources: Prices (Zillow Home Value Index); Loan Denials and DTI (Home Mortgage Disclosure Act).
Ending the Bailout Train: Market-Based GSE Reforms
For decades, the implicit belief guiding US housing finance policy was that government-sponsored enterprises such as Fannie Mae and Freddie Mac were integral to achieving the twin goals of a high homeownership rate and a stable mortgage market. Moreover, these agencies enjoyed funding advantages due to the implicit promise of a government bailout in the event of financial distress—an implicit promise that became reality during the financial crisis. When it comes to actual outcomes, however, the United States only ranks 17th in terms of its overall homeownership rate, despite the fact that it stands alone with regard to how prominent of a role GSEs play in the mortgage market.13 For the US homeownership ranking, see Matthew P. Richardson, Stijn Van Nieuwerburgh, and Lawrence J. White, “What to Do About the GSEs?,” Annual Review of Financial Economics 9 (November 2017): 21–41.
The Problem with Underpriced Guarantees
While government backing may have been necessary during the Great Depression to facilitate the flow of credit to underserved areas of the country, financial markets are far more developed and integrated now than in the past. However, this financial development does not make them immune to crises, nor is lack of necessity for GSEs a sufficient case for major reform. Instead, the case for reform emerges precisely because of the risk of financial fragility in the mortgage market that is actually exacerbated by government guarantees. As things currently stand, Fannie Mae and Freddie Mac buy mortgages from lenders who originate the loans, bundle them into mortgage-backed securities (MBSs), and then sell them on capital markets. Investors also pay a guarantee fee (g-fee) to the GSEs in exchange for protection from credit losses on the underlying mortgages. Currently, these g-fees—which are tantamount to an insurance premium—are set by policy rather than the market’s assessment of true actuarial risk. Unfortunately, recent research has identified the underpricing of government mortgage guarantees as a significant factor behind riskier lending, higher financial sector leverage and, thus, economic fragility.14Vadim Elenev, Tim Landvoigt, and Stijn Van Nieuwerburgh, “Phasing Out the GSEs,” Journal of Monetary Economics 81, no. C (2016): 111– 32; and Karsen Jeske, Dirk Krueger, and Kurt Mitman, “Housing, Mortgage Bailout Guarantees and the Macro Economy,” Journal of Monetary Economics 60, no. 8 (2013): 917–35. Although g-fees have increased since the financial crisis, there remains no mechanism to automatically align such fees with underlying risk or to ensure that market discipline rather than political motives guides the pricing of mortgage guarantees. In fact, quite to the contrary, there is already evidence that GSEs in their current state of conservatorship are being used to advance other policy goals, with 10 basis points of the g-fees now going to the Social Security Trust Fund and another 4.2 basis points to an affordable housing fund.15Richardson et al., “What to Do.”
Allow Market Forces to Price Credit Risk
Before addressing even bolder reforms, there is a strong case to be made based on insights from the research that, as long as GSEs continue to exist in their current form with government bailout guarantees, g-fees should be set to properly reflect true market risk, both over time and across geographic areas of the United States. In one study, increasing the g-fee actually crowds in private sector mortgage lending, leading to fewer but safer mortgages, less financial fragility, fewer foreclosures, and less house price volatility. If g-fees were raised to a moderately high level (e.g., 100 basis points, up from an average of 56 basis points in 2017), they would become attractive only during mortgage crises, whereas the private market would dominate the rest of the time. An even more stark increase to 275 basis points would be equivalent to essentially privatizing the mortgage market, as such loans would never be attractive.16For information on g-fees in 2017, see Federal Housing Financy Agency, “Fannie Mae and Freddie Mac Single-Family Guarantees in 2017,” fhfa.gov, December 10, 2018, https://www.fhfa.gov/AboutUs/Reports/Pages/Fannie-Mae-and-Freddie-Mac-Single-Family-Guarantee-Feesin-2017.aspx. An intermediate option is to set the g-fee equal to its actuarially fair value, although determining this level invariably requires a more complicated analysis that takes into account time-varying economic conditions and the evolving composition of mortgage lending to the g-fee itself. Shifting to an entirely different paradigm, another option is to pursue an arrangement whereby the private sector prices mortgage guarantees and absorbs a fraction of losses while the government covers the remainder.17For more details on this proposal, see Richardson et al., “What to Do.” In 2013, policymakers took a step in this direction with the rollout of credit risk transfer notes (specifically Structured Agency Credit Risk, or STACR, issued by Freddie Mac and Connecticut Avenue Securities, or CAS, issued by Fannie Mae) that shift some of the credit risk taken on by the GSEs from taxpayers to investors who purchase these securities.18For an overview, see Kenneth Kapner and Rob McDonough, “The Long and Short of It: An Overview of STACR and CAS,” Global Finance Markets Institute, April 19, 2016, https://www.gfmi.com/articles/the-long-and-short-of-it-an-overview-of-stacr-and-cas/; and for even more details, see Federal Housing Finance Agency, Overview of Fannie Mae and Freddie Mac Credit Risk Transfer Transactions, August 2015.
Replace Bailouts with Catastrophic Insurance to Protect against Systemic Risk
While one option is to simply raise the g-fee once and for all to either some intermediate or high value, an alternative approach is to modify the underlying nature of the bailout guarantee itself. Although time-varying g-fees are also an option, research indicates that not much would be gained by moving to such a regime.19Vadim Elenev, Tim Landvoigt, and Stijn Van Nieuwerburgh, “Phasing Out the GSEs,” Journal of Monetary Economics 81, no. C (2016): 111–32. Thus, rather than promising unconditional bailouts, one option is to instead replace bailout guarantees with a de facto form of catastrophic insurance, in line with that envisioned in the 2014 Johnson-Crapo bill. Such a proposal would mandate that mortgage lenders hold a significant buffer of private capital to cover moderate losses, which would then facilitate true market-based pricing of mortgage risk and mitigate the risk of moral hazard. However, in the event of an extraordinary crisis, government would absorb all losses above some threshold (e.g., 10 percent). The same research indicates that such a proposal would resemble in many ways the high g-fee economy that is significantly more reliant on the private sector but with the added benefit of additional downside insurance. Moreover, the actuarially fair cost of such catastrophic insurance would only be in the ballpark of 2 basis points.20 Elenev et al (2016).
Another Alternative to Higher g-Fees: Reduce Conforming Loan Limits
Adjusting bailout guarantees—whether it’s the circumstances in which they can occur or the fees necessary to pay for them—are not the only way to reduce the footprint of the GSEs. An alternative is to reverse recent practice and gradually reduce conforming loan limits, either explicitly or by keeping them constant as house prices rise over time. In either case, research indicates that such a lower government footprint in the mortgage market is not likely to have any adverse impact on the homeownership rate.21Serafin Grundl and You Suk Kim, “The Marginal Effect of Government Mortgage Guarantees on Homeownership” (FEDS Working Paper No. 2019-027, Board of Governors of the Federal Reserve System, Washington, DC, April 2019). In fact, rather than increase the number of people who enter homeownership, there is ample evidence that GSE-induced relaxations in credit lead to a spike in house prices, which may actually decrease home affordability.22 For example, see Ömer Açikgöz and James Kahn, “A Quantitative Model of `Too Big to Fail,’ House Prices, and the Financial Crisis” (MPRA Paper 76385, University Library of Munich, Germany, January 2017).
Level the Regulatory and Geographic Playing Field
As Fannie Mae and Freddie Mac have wound down their portfolios during their time in conservatorship, the market share for FHA and VA loans has skyrocketed, as shown previously in figure 16. In contrast with enterprise loans, FHA and VA mortgages are backed by explicit government guarantees in exchange for a fee. However, in light of events during the financial crisis, it is unclear how much daylight exists between implicit and explicit bailout guarantees anymore. Thus, any efforts to level the playing field between the GSEs and the private sector are unlikely to succeed as long as borrowers can simply shift into other government-backed loans instead. Traditionally, the trade-off between FHA and conventional GSE loans were that the former required smaller down payments but entailed an up-front mortgage insurance premium. However, just as with the GSE g-fees, these premiums do not reflect actual mortgage default risk. Research has found that, by allowing for a lower tax burden, reducing government subsidies for this explicit mortgage guarantee is likely to improve welfare both for low-income and high-income households. 23 Jiseob Kim and Yicheng Wang, “Macroeconomic and Distributional Effects of Mortgage Guarantee Programs for the Poor,” Journal of Economic Dynamics and Control 87, no. C (2018): 124–51.
To further level the playing field, policymakers could reverse the impact of the “ability-to-repay” (ATR) rule created by the Dodd-Frank Act of 2010. In the aftermath of the crisis, this rule was created to expose lenders to legal liability for any loans that did not satisfy certain criteria, among which was a 43 percent cap on the payment-to-income ratio.24 Anthony A. DeFusco, Stephanie Johnson, and John Mondragon, “Regulating Household Leverage” (working paper, 2018). However, the Dodd-Frank Act permanently exempted the FHA and VA from the 43 percent limit and extended a temporary exemption to the GSEs until 2021. Furthermore, by increasing mortgage origination costs, Dodd-Frank has caused a significant increase in rental costs to the tune of 2.1 percentage points per year from 2010 to 2014.25Pedro Gete and Michael Reher, “Mortgage Supply and Housing Rents,” Review of Financial Studies 31, no. 12 (2018): 4884–911. In light of this regulatory change, it is therefore unsurprising that that PLS market has nearly collapsed, with risky, high payment-to-income loans migrating to government guarantee programs.26 DeFusco et al., “Regulating Household Leverage;” and Davis et al., “Insert Short-form Title” (2019) provide additional discussion. Subjecting the GSEs, the FHA, and the VA to the same legal restrictions as the private sector would reverse this trend toward a partial government mortgage monopoly.
Another dimension of mismatch created by government intervention occurs through the uniform pricing of mortgages across different geographical areas of the United States despite predictable variation in default risk. In particular, borrowers in regions with declining economic conditions where default is therefore more likely are charged the same interest rates as borrowers elsewhere. Furthermore, mortgage rates and qualifying conditions for loans securitized by GSEs do not reflect differences in local foreclosure laws that affect the size of losses banks suffer in the event of default. This uniform pricing is not free; rather, it entails significant regional redistribution. There have been several attempts to more closely align the price of credit with its underlying risk, such as the proposed “declining market” policy that would require more equity at origination in markets with declining house prices or the 25 basis point fee that the FHFA proposed to institute in states with high foreclosure costs arising from judicial delays; however, political backlash has consistently acted as a roadblock to reform. Recent research quantifies the magnitude of this regional redistribution and finds that it is comparable to fiscal stimulus programs such as tax rebates and unemployment insurance, except directed disproportionately to the Sand States, Gulf Coast, and parts of the Northeast and Michigan.27 Erik Hurst, Benjamin J. Keys, Amit Seru, and Joseph Vavra, “Regional Redistribution through the US Mortgage Market,” 2016, American Economic Review 106, no. 10 (2016): 2982–3028. Moreover, unlike direct fiscal stimuli, these implicit subsidies are off-book and therefore lack transparency.
Perspectives on GSE Privatization
Each of the technocratic solutions above has many arguments in its favor and would, according to the research, create significant improvements in the safety of the financial system and the functioning of the housing market. However, any tweaks can be undone with the changing of the political winds and are likely to be vulnerable to intense lobbying efforts. This warning is not merely speculative. Rather, research has found that during the height of the housing boom, mortgage industry campaign contributions flowed disproportionately toward US representatives from districts with the most subprime borrowing activity and that such political giving was predictive of subsequent congressional voting behavior on housing legislation, including thwarted attempts to constrain GSE balance sheets.28Atif Mian, Amir Sufi, and Francesco Trebbi, “The Political Economy of the Subprime Mortgage Credit Expansion,” Quarterly Journal of Political Science 8, no. 4 (2013): 373–408. Furthermore, in the aftermath of the crisis, when Congress was debating banking reforms, lenders delayed foreclosure activity in the districts of members sitting on the House Financial Services Committee despite those districts exhibiting no differences in underlying delinquencies relative to non-committee districts.29Sumit Agarwal, Gene Amromin, Itzhak Ben-David, and Serdar Dinc, “The Politics of Foreclosures,” Journal of Finance 73, no. 6 (2019): 2677–717. The GSEs themselves have also not been immune to political pressure. Recent research has even found that the GSEs reacted to defend their market share from the growing PLS segment during the boom by expanding their own portfolios into riskier lending.30Neil Bhutta and Benjamin J. Keys, “Eyes Wide Shut? The Moral Hazard of Mortgage Insurers During the Housing Boom” (NBER Working Paper No. 24844, National Bureau of Economic Research, Cambridge, MA, July 2018).
On the flip side, for as fast as political leadership can change, it is also nearly impossible for political discretion to be as nimble as market forces in ensuring the efficient and equitable allocation of credit. For example, actuarially fair pricing of credit risk requires timely and accurate knowledge of economic conditions—already a formidable task if undertaken by scores of lenders located throughout the country, and nearly impossible for the federal government to do effectively for the nation as a whole. Thus, political control of mortgage lending almost inevitably means financial stability must vie with housing and non-housing policy goals for priority status—which explains the genesis of many of America’s mortgage institutions during the Great Depression.
Moving toward a housing finance system that relies more on private lending and less on government-backed institutions is no simple matter, however, or else it would likely have already occurred. Even putting aside political forces, recent research demonstrates that there would be both winners and losers in ending America’s reliance on government guarantees in the mortgage market. For example, one study shows that high-income households would gain from a removal of credit-risk guarantees, whereas highly leveraged low and middle-income households would require compensating transfers or else disfavor the policy. 31Pedro Gete and Franco Zecchetto, “Distributional Implications of Government Guarantees in Mortgage Markets,” Review of Financial Studies 31, no. 3 (2018): 1064–97. In particular, the study finds that, although foreclosures would fall, rents would increase and house prices would decline. However, the authors find that linking GSE reform with a removal of the mortgage interest deduction would improve economic outcomes for a majority of households. Importantly, this research may underestimate the value of reforming government guarantees because it ignores the feedback between guarantees, the risk profile of mortgage lending, and financial fragility.
Basic Reform Principles
More broadly, research points to some general reform principles that policymakers ought to keep in mind for how to address government-backed lending in the mortgage market. First, government guarantees are not essential to achieving a high homeownership rate, and their systematic underpricing undermines rather than enhances financial stability. Second, increasing reliance on private lending and less on government-backed institutions is a promising avenue to reduce the moral hazard created by bailout guarantees. However, some form of catastrophic insurance may be needed to shield against an excessive build-up of systemic risk, and additional reforms (e.g., further reducing the mortgage interest deduction) may be necessary to compensate those who lose out from the reduction in subsidized lending. Third, policymakers should consider relying less on off-the-books, implicit subsidies and more on explicit expenditures and tax reductions to achieve their policy goals. The opacity of the status quo facilitates damaging mission creep within the GSEs and engenders a lack of accountability that makes it difficult to properly assess whether current policies are achieving their objectives in a cost-efficient manner.
The Promise and Pitfalls of Prudential Regulation
Public officials have followed a dual strategy in their attempts to minimize the chance of a repeat financial crisis. Motivated by the belief that “bad actors” recklessly originated risky loans to uncreditworthy borrowers, microprudential regulations have focused on improving lender supervision and establishing tighter guidelines for the mortgage origination process to ensure adequate underwriting standards. The “ability-to-repay” rule emerging from the Dodd-Frank Act is one such example of a law aimed at keeping lenders in line; it is responsible for the dramatic decline in loans requiring low or no documentation or which feature non-traditional repayment structures, such as initial teaser rates. At the same time, macroprudential regulations have been instituted to prevent a systemic build-up of mortgage risk by directly limiting high-LTV or high-PTI ratio loans, although it bears repeating that, because of the “qualified mortgage” exemption, FHA and VA loans continue to feature extremely low down payments.
Heightened Scrutiny during the Origination Process
A growing body of research is rebutting the narrative of the housing bust as being the product of subprime lending, instead pointing out that it was more of a widespread middle class crisis that afflicted borrowers from a wide range of credit scores. In some respects, this finding is unsurprising given the nature of mortgage default and the lack of information embedded in credit scores. Because they do not track changes in income or home equity—the two most important factors determining mortgage default— credit scores are a highly imperfect way of forecasting credit risk. Moreover, the fact that mortgages are long-term contracts that are only subjected to a risk assessment at origination would render such information moot even if it were available. Challenging “The Big Short” storyline that lenders were knowingly originating junk mortgages, recent research finds that reduced underwriting standards cannot explain the rise in foreclosures. Moreover, analysts correctly understood the ramifications of declining house prices for default but simply underestimated the likelihood of such an unprecedented drop in house prices.32 Christopher L. Foote, Kristopher Gerardi, and Paul S. Willen, “Negative Equity and Foreclosure: Theory and Evidence,” Journal of Urban Economics 64 (2008): 234–45; and Ing-Haw Cheng, Sahil Raina, and Wei Xiong, “Wall Street and the Housing Bubble,” American Economic Review 104, no. 9 (2014): 2797–829. The research also casts doubt on non-traditional mortgage features as primary culprits to blame for the foreclosure crisis.33 Christopher Mayer, Karen Pence, and Shane M. Sherlund, “The Rise in Mortgage Default,” Journal of Economic Perspectives 23, no. 1 (2009): 27–50. Instead, the greatest source of increased mortgage risk during the boom came from loans that simply featured high leverage ratios, high payment-to-income ratios, or both.34Corbae and Quintin, “Leverage.” This research attributes 60 percent of the rise in foreclosures to high-leverage loans initiated during the latter stages of the boom. Particularly in the later stages of the boom, homeowners increasingly turned to second lien “piggy back” loans that drove up their cumulative loan-to-value ratio at origination—sometimes in excess of 100 percent leverage. To give a sense of scale, one study finds that total second lien mortgage balances grew from $200 billion to over $1.1 trillion between 2001 and 2006.35 Donghoon Lee, Christopher Mayer, and Joseph Tracy, “A New Look at Second Liens,” in Housing and the Financial Crisis, ed. Edward L. Glaeser and Todd Sinai (Chicago: University of Chicago Press, 2013).
In light of the mounting evidence that the housing bust was not a product of unique dysfunction in the subprime market, microprudential efforts to restrict the types of borrowers who could receive mortgages or the nature of the contracts being offered are not the best avenues to improve financial stability. In fact, such restrictions may even prove counterproductive. For example, one adverse consequence of the “ability-to-pay” rule introduced by the Dodd-Frank Act concerns its impact on entrepreneurship. Unlike workers who rely primarily on W-2 income, entrepreneurs are more dependent on business income that lacks as deep of a paper trail for loan verification purposes. With the regulation-induced disappearance of low-documentation loans, many entrepreneurs have had to resort to listing only more verifiable sources of income on their loan applications. However, by listing less income, they are more likely to run into binding payment-to-income limits that constrain their ability to borrow. In light of the importance that mortgage finance has for early stage business formation and expansion, these regulatory changes have been shown to negatively impact entrepreneurship. Specifically, one recent study finds that growth in self-employment and new small business employment has been lower (by 2 percent and 3 percent, respectively) in areas where more banks were affected by these regulations.36Stephanie Johnson, “Are Mortgage Regulations Affecting Entrepreneurship?” (working paper, 2018).
Nevertheless, pointing out these drawbacks should not be construed as a broadside against microprudential regulation in its entirety. To the contrary, there is ample reason to believe that lenders do not fully internalize the impact of their screening efforts or contractual arrangements on external parties or the overall smooth functioning of the financial system. For example, research has pointed to informational asymmetries and agency conflicts arising from the securitization process as possible factors inhibiting foreclosure alleviation efforts during the crisis, given that less than 2 percent of seriously delinquent borrowers received a loan modification.37See, for example, Lee et al., “A New Look;” and Manuel Adelino, Kristopher Gerardi, and Paul S. Willen, “Why Don’t Lenders Renegotiate More Home Mortgages? Redefaults, Self-Cures, and Securitization,” Journal of Monetary Economics 60, no. 7 (2013): 835–53. While a more in-depth discussion of mortgage reforms is deferred to later in this paper, the economics contract design literature suggests that lenders’ incentives to properly screen are improved if they are required to maintain “skin in the game” by retaining a “first loss piece” on their balance sheets.38Benjamin J. Keys, Tomasz Piskorski, and Amit Seru, “Mortgage Financing in the Housing Boom and Bust,” in Housing and the Financial Crisis, ed. Edward L. Glaeser and Todd Sinai (Chicago: University of Chicago Press, 2013). In short, as a guidepost to policymakers, this body of evidence suggests that there is a salient trade-off between ensuring greater uniformity in the origination process (e.g., by limiting the availability of alternative mortgage products or demanding a certain standard for loan documentation) and accommodating the economic backgrounds and needs of a wider variety of non-traditional borrowers— some of whom may actually be perfectly good credit risks.
Direct Debt Limits
Whereas microprudential regulations focus on the details of who can get loans and what kinds of loans they can get, macroprudential regulation seeks to reduce systemic risk and improve macroeconomic stability by directly limiting the amount of mortgage debt borrowers can take on. Most commonly, these regulations come in the form of caps imposed at origination to either the loan-to-value (LTV) ratio—defined as the size of the loan divided by the appraised value of the house acting as collateral—or the payment-to-income (PTI) ratio or both. As discussed previously in reference to figures 10 and 15, both ratios have increased substantially since 1990 and remain elevated even after the financial crisis. If the goal is simply to reduce the likelihood of foreclosure, both LTV and PTI restrictions are remarkably effective at reducing the likelihood of default. In the former case, lower LTV limits automatically create a larger home equity cushion such that, even in the event of house price declines, fewer sellers are likely to end up underwater and unable to sell their house at an adequately high price to pay off their outstanding debt. In the latter case, lower PTI limits prevent households from getting stuck with burdensome mortgage payments—particularly during bad economic times—thereby lowering the likelihood of financial insolvency. In addition, such restrictions on risky borrowing may reduce the volatility of house prices.39For more discussion of this issue, see Carlos Garriga and Aaron Hedlund, “Housing Finance, Boom-Bust Episodes, and Macroeconomic Fragility” (2018 Meeting Papers 354, Society for Economic Dynamics, 2018). However, such macroprudential regulations are not without their drawbacks.
As a starting point, loan-to-value caps impede access to credit and increase the already illiquid nature of housing by making it more difficult for homeowners to tap into their equity, including for venture capital or college tuition payments. While some may be willing to accept such limits on economic opportunity as the price of greater stability (in the face of graveyard protestations by Patrick Henry), the research indicates that one-size-fits-all LTV caps may not even necessarily improve economic stability, particularly during a downturn. 40Ibid. After all, even prior to the Dodd-Frank changes, the prevalence of underwater mortgages caused by falling house prices during the crisis prevented homeowners from refinancing into lower rates or extracting equity to get through tough times, with depressed consumer spending as the result. While even tighter leverage restrictions would have meant an initially safer distribution of debt, they also would have further reduced the consumption insurance value of homeownership.
For this reason, several scholars have suggested alternatives to uniform LTV limits. For example, some scholars have suggested implementing countercyclical loan-to-value limits that tighten during good times and loosen during bad times, with some research showing positive stabilization effects.41See, for example, Gabriel Bruneau, Ian Christensen, and Césaire Meh, “Housing Market Dynamics and Macroprudential Policies,” Canadian Journal of Economics 51, no. 3 (2013): 864–900. However, implementation then becomes a challenge, with questions arising as to what measure should be used to determine whether times are good or bad (particularly with regard to whether those measures should be based on national or local data), how large the change in limits should be, and so on. Other work has pointed to payment-to-income ratios as a more effective macroprudential tool, though PTI restrictions also suffer from some of the same practical issues as uniform LTV limits. 42Dan Greenwald, “The Mortgage Credit Channel of Macroeconomic Transmission” (MIT Sloan Research Paper No. 5184-16, MIT Sloan School of Management, Cambridge, MA, January 2018). In particular, as income falls during a recession, it automatically becomes more difficult for borrowers to take out loans of a given size unless the PTI limit itself is allowed to vary with broader economic conditions. Interestingly, when implemented jointly, LTV limits and PTI limits can actually increase house price volatility.
Perhaps in recognition of this dilemma, a new rule is emerging from the Dodd-Frank Act. Scheduled to take effect in 2021, the rule keeps in place the current 43 percent DTI cap while allowing borrowers to exercise a costly option to relax the limit, for example during a period of individual economic distress. One recent study simulates the likely effects of this future rule and finds that it should further reduce the mortgage default rate and improve economic welfare, especially for households in the middle of the wealth distribution who have temporarily low incomes. 43Anthony A. DeFusco, Stephanie Johnson, and John Mondragon, “Regulating Household Leverage” (working paper, 2018). By contrast, the “ability-to-repay” rule, which caps DTI ratios at 43 percent except for loans securitized by the GSEs, would have had only a minimal impact on the national foreclosure rate during the crisis, according to recent research.
Good Cop, Bad Cop: What to Do about Mortgage Default?
The wave of mortgage defaults during the last housing crisis brought with it a slew of foreclosure mitigation efforts at both the state and federal levels. At the federal level, the two most prominent interventions were the Home Affordable Modification Program (HAMP) and the Home Affordable Refinance Program (HARP). Although HAMP and HARP both aimed to reduce foreclosures, they took different approaches. HAMP focused on inducing lenders to modify loan terms with distressed borrowers by, for example, extending the loan term or by forgiving a fraction of the outstanding principal. While it is true that a haircut to mortgage principal implied a reduction in monthly payments, the most direct impact of debt forgiveness was higher (i.e., less negative) home equity. By contrast, HARP sought to loosen underwriting requirements—specifically with regard to the maximum loan-to-value ratio—to allow borrowers with negative equity to refinance and take advantage of lower mortgage rates. Thus, HARP was directed almost entirely at lowering monthly payments. At the state level, California also instituted its own principal reduction program as part of its series of “Keep Your Home California” initiatives.
Loan Modifications
The evidence indicates that both programs had a salutary impact during the crisis but on a much smaller scale than intended. With regard to HAMP, researchers have found that the typical loan modification reduced monthly payments by 25 percent, amounting to $300–$400 per month on average.44Sumit Agarwal, Gene Amromin, Itzhak Ben-David, Souphala Chomsisengphet, Tomasz Piskorski, and Amit Seru, “Policy Intervention in Debt Renegotiation: Evidence from the Home Affordable Modification Program,” Journal of Political Economy 125, no. 3 (2017): 654–712. In terms of economic impact, HAMP prevented a sizable number of foreclosures, and the evidence indicates that it mitigated the house price decline in areas with the greatest saturation of modifications and led to higher consumer spending. However, because HAMP relied on convincing lenders (through financial incentives) to undertake cumbersome loan renegotiations, it only reached one-third of its indebted target—1 million households instead of 3–4 million. Before moving on to a discussion of HARP, two main policy lessons emerge from the experience with loan modifications under HAMP. First, because much of the shortfall can be attributed to low renegotiation intensity among a handful of large intermediaries, the program would have had much greater coverage had there been mechanisms in place to transfer distressed mortgages from inefficient servicers to those with a greater capacity to renegotiate large volumes of loans, much as special servicers do for the commercial real estate market. For example, a transfer of non-performing loans could automatically be initiated if some pre-specified adverse event occurs. To deal with frictions associated with borrowers who have multiple liens on their house, some scholars have proposed introducing a “second lien incentive fee” to pay holders of second liens (e.g., second mortgages, home equity lines of credit, etc.) to voluntarily surrender their claim instead of holding up the modification process.45For more discussion of such an incentive scheme, see Christopher Mayer, Edward Morrison, and Tomasz Piskorski, “A New Proposal for Loan Modifications,” Yale Journal on Regulation 26, no. 9 (2009): 417–29.
Second, policy should guard against strategic behavior, but not all forms of precaution are equal. At an initial glance, such a warning appears unwarranted based on the extensive body of research establishing that homeowners are willing to tolerate negative equity as long as they can continue to make mortgage payments. By contrast, strategic foreclosure—whereby borrowers can improve their net worth by walking away—was disproportionately associated with investors who did not reside in the properties on which they defaulted. That said, the increase in investor activity has upsides as well, with recent research finding that the increased presence of institutional investors facilitated by the First Look program instituted by Fannie Mae and Freddie Mac has improved local labor market outcomes.46Lauren Lambie-Hanson, Wenli Li, and Michael Slonkosky, “Leaving Households Behind: Institutional Investors and the U.S. Housing Recovery” (Working Papers 19-1, Federal Reserve Bank of Philadelphia, Philadelphia, PA, January 2019). Returning to the issue of owner-occupiers, several studies have found that foreclosure prevention efforts increased strategic behavior during the housing crisis. For example, one study finds that 38 percent of households in default between 2009 and 2013 could make their mortgage payments without being required to reduce their consumer spending.47Kristopher Gerardi, Kyle F. Herkenhoff, Lee E. Ohanian, and Paul S. Willen, “Can’t Pay or Won’t Pay? Unemployment, Negative Equity, and Strategic Default,” Review of Financial Studies 31, no. 3 (2018): 1098–131. Another study found a nearly 10 percent increase in mortgage delinquency following the settlement with Countrywide Financial Corporation in which it was determined that loan modifications would be offered to seriously delinquent borrowers.48See Christopher Mayer, Edward Morrison, Tomasz Piskorski, and Aript Gupta, “Mortgage Modification and Strategic Behavior: Evidence from a Legal Settlement with Countrywide,” American Economic Review 104, no. 9 (2014): 2830–857. In other words, it appears that some borrowers purposely started to default in order to qualify for a modification. On a wider scale, there is also evidence that HAMP contributed to increases in “ruthless” strategic default.49Xudong An, Yongheng Deng, and Stuart A. Gabriel, “Default Option Exercise over the Financial Crisis and Beyond” (working paper, 2016). Banks, perhaps anticipating such moral hazard, may have refrained from adopting an overt policy of loan modifications because of their inability to distinguish between strategic defaulters and those in genuine financial distress.50Such moral hazard may be an important reason for the low rate of modifications observed during the crisis, as discussed in Hanming Fang, You Suk Kim, and Wenli Li, “The Dynamics of Subprime Adjustable-Rate Mortgage Default: A Structural Estimation” (Working Papers 16-2, Federal Reserve Bank of Philadelphia, Philadelphia, PA, February 2016). Thus, the policy challenge becomes one of encouraging necessary loan modifications while guarding against strategic behavior.
One option is to implement a stringent set of screening requirements to weed out “undeserving” borrowers, as was done with HAMP. However, such an onerous process also limits the pace and scope of modifications.51Agarwal et al., “Policy Intervention.” As another option, research suggests that offering loan forbearance is an effective alternative to loan modifications in areas where the likelihood of a robust house price recovery is higher, whereas loan modifications work best in declining areas with lower expected house price appreciation.52Christopher L. Foote, Kristopher Gerardi, and Paul S. Willen, “Negative Equity and Foreclosure: Theory and Evidence,” Journal of Urban Economics 64, no. 2 (2008): 234–45. Despite these concerns about borrower strategic default, taking full stock of the evidence still suggests that “bailing out” borrowers (e.g., through loan modifications) is a more cost-effective approach than bailing out financial institutions. In particular, the amount of debt forgiveness required to avert default is less with a policy like HAMP than with financial bailouts like the Troubled Asset Relief Program (TARP).53 For a thorough analysis, see Thomas Schelkle, “Mortgage Default during the U.S. Mortgage Crisis,” Journal of Money, Credit, and Banking 50, no. 6 (2018): 1101–37. However, it should also be noted that it is in lenders’ interest to avert borrower strategic default. Thus, policies that directly encourage modifications may be unnecessary. Instead, the previous options that deal with alleviating frictions between originators and servicers (e.g., a “second lien incentive fee”) and encouraging the transfer of non-performing loans to better-equipped servicers may be sufficient.
Refinancing Underwater Mortgages
In the midst of the foreclosure crisis, people in policy circles debated whether borrowers were more sensitive to their cash flow (i.e., how easily they could service their monthly debt obligations without onerous cuts to consumer spending) or their balance sheets (in particular, their home equity position). Although borrowers were clearly attuned to both facets, the research has since determined that alleviating stress on monthly budgets is a more cost effective and targeted way to reduce default than attempts to reduce negative equity.54 Peter Ganong and Pascal Noel, “Liquidity vs. Wealth in Household Debt Obligations: Evidence from Housing Policy in the Great Recession,” (NBER Working Paper No. 24969, National Bureau of Economic Research, Cambridge, MA, August 2018); and Guren and McQuade, “Foreclosures Exacerbate Downturns.” Whereas HAMP contained ingredients from both buckets, HARP—which loosened loan-to-value caps during underwriting to facilitate the refinancing of underwater mortgages—was directed entirely at enhancing household liquidity through improved cash flow. Also, whereas HAMP affected 1 million households, HARP allowed more than 3 million underwater borrowers to refinance, delivering an average 1.4 percentage point mortgage rate reduction and $3,500 in annual savings. In addition to delivering individual relief, HARP contributed to a decrease in foreclosures and a more rapid recovery in consumer spending as well as a recovery in house prices in areas most exposed to the policy.
Even though participation exceeded HAMP’s performance, HARP still only reached 40–60 percent of eligible borrowers. Several factors may explain this incomplete take-up rate, such as borrower inattention and the gradual expansion of the policy—first, only mortgages with up to 105 percent loan-to-value qualified, then this ceiling was raised to 125 percent late in 2009 before being removed entirely in 2011. However, recent research points to a fundamental design flaw in the program that limited the available gains to borrowers because of a lack of competition between lenders. In particular, up until a rule change in 2013, HARP conferred significant legal advantages to lenders who were already servicing mortgages prior to being refinanced through HARP. Thus, even as mortgage rates were falling overall, lenders engaging in a HARP refinance passed along only a portion of those lower rates to borrowers. Recent research establishes that this monopoly power caused interest rates to be 30 basis points higher for heavily indebted borrowers. This same research indicates that borrowers could have received an additional $400–$800 in average savings on top of the $3,500 figure cited previously.55Sumit Agarwal, Gene Amromin, Souphala Chomsisengphet, Tim Landvoigt, Tomasz Piskorski, Amit Seru, and Vincent Yao, “Mortgage Refinancing, Consumer Spending, and Competition: Evidence from the Home Affordable Refinancing Program” (NBER Working Paper No. 21512, National Bureau of Economic Research, Cambridge, MA, October 2017). As is often the case, greater competition often delivers larger gains to consumers, and policymakers should be mindful of any regulations embedded in foreclosure mitigation efforts that limit competition.
The Speed and Severity of Foreclosure
Although much attention has been paid to interventions at the federal level, states also took widely divergent approaches to addressing the foreclosure crisis. On the dimension of speed, some states adopted a more laissez-faire attitude while others went to great lengths to shield borrowers from foreclosure. Furthermore, going into the crisis, some states had established strict foreclosure regimes that went after borrowers for unpaid balances whereas others had more lenient arrangements enshrined in law. During the crisis, the impetus moved decidedly in the direction of purportedly borrower-friendly interventions to stop foreclosures and to soften their impact. Indicative of greater foreclosure delays, research finds that the average time required to initiate and complete a foreclosure rose by six months during and after the Great Recession.56Kyle F. Herkenhoff and Lee E. Ohanian, “The Impact of Foreclosure Delay on U.S. Employment,” Review of Economic Dynamics 31 ( January 2019): 63–83. This increase was particularly pronounced in states with judicial requirements that erect barriers to lenders starting the process of foreclosure. While the research confirms that such delays did limit the size of the initial foreclosure wave, the delays also had the unintended consequence of slowing the economic recovery in those areas.57Atif Mian, Amir Sufi, and Francesco Trebbi, “Foreclosures, House Prices, and the Real Economy,” Journal of Finance 70, no. 6 (2015): 2587– 634; Guren and McQuade, “Foreclosures Exacerbate Downturns;” and Herkenhoff and Ohanian, “Impact of Foreclosure Delay.”
Turning to the issue of severity, in nonrecourse states a mortgagor’s financial and legal obligation completely ends after the foreclosure sale. Thus, in practice, wealthy homeowners with negative equity in a nonrecourse state like California or Arizona could walk away from their underwater houses during the crisis and suffer only a decline in their credit scores without any attempts by the lender to seize other financial assets. By contrast, in recourse states, courts have the authority to issue deficiency judgments against defaulting borrowers in the event that a foreclosure sale fails to recoup enough money to cover the borrower’s outstanding debt. While there is little practical difference between these two legal regimes for borrowers in genuine distress, they create starkly different residential investment incentives. In nonrecourse states, the option to strategically default encourages speculative “house flipping” behavior and a “heads I win, tails you lose” mentality among investors. Indeed, research has shown that nonrecourse laws tend to produce greater volatility in house prices and foreclosure activity.58Aaron Hedlund, “The Cyclical Dynamics of Illiquid Housing, Debt, and Foreclosures,” Quantitative Economics 7, no. 1 (March 2016): 289 –328; and Te Bao and Li Ding, “Nonrecourse Mortgage and Housing Price Boom, Bust, and Rebound,” Real Estate Economics 44, no. 3 (2016): 584–605. After all, although it carries significant negative stigma, the option to default is actually a form of downside insurance, particularly in relation to the historic norm of debtors’ prisons or indentured servitude. On the flip side, recourse lowers borrower sensitivity to negative equity.59 Andra C. Ghent and Marianna Kudlyak, “Recourse and Residential Mortgage Default: Evidence from US States,” Review of Financial Studies 24, no. 9 (2011): 3139–86.
Despite the risk of increasing the magnitude of house price swings, Nevada abolished deficiency judgments in 2009—thereby moving from the recourse to the nonrecourse column—in an attempt to make its atmosphere more borrower-friendly in the face of significant foreclosure distress. However, what lawmakers probably did not envision was that such a move would limit the availability of credit. While an extensive body of literature has established this theoretical link between recourse laws and credit supply, one recent study finds that the law change in Nevada led to a decline in loan sizes and a reduction in mortgage approval rates.60Wenli Li and Florian Oswald, “Recourse and Residential Mortgages: The Case of Nevada,” Journal of Urban Economics 101, no. C (2017): 1–13. Thus, making laws friendlier to those who default generates substantial costs for borrowers. That said, other research comparing the United States to Europe—where recourse mortgages are dominant—finds that strict foreclosure penalties can also deepen recessions.61 Pedro Gete and Franco Zecchetto, “Mortgage Design and Slow Recoveries: The Role of Recourse and Default” (working paper, 2018). As a way of incorporating both sets of findings, policymakers have a couple of reform options at their disposal. First, they could facilitate loan modifications and underwater refinancing to limit the number of borrowers who default. Secondly, they could scale the severity of foreclosure penalties relative to economic conditions. Specifically, states could put mechanisms in place that automatically reduce borrower exposure to deficiency judgments during crisis episodes, all the while continuing to process foreclosures rapidly, rather than erecting counterproductive barriers that create harmful delays.
Redesigning Mortgages to Enhance Resilience
The advantage of interventions implemented during a recession is that they can be tailored to specific economic circumstances. However, the drawback is that there are often frictions that impede implementation, as the United States experienced in the financial crisis. Moreover, an excessive reliance on discretionary interventions can create damaging policy uncertainty. The alternative to such a reactive posture is for policymakers to take a more proactive approach by facilitating the creation of alternative mortgage instruments with design features that enhance economic resilience in the face of turbulence. In particular, such design improvements can improve the scope and pace of debt relief during crises, though the details of their underlying structure are critical for ensuring that they enhance rather than detract from macroeconomic stability.
Before addressing more novel mortgage designs, it is worth noting that existing debt instruments already provide partial insurance for individual borrowers. For example, because of their long duration and the fact that risk assessment only occurs at origination, all mortgages protect borrowers’ ability to roll over their balances from one year to the next regardless of any house price or income fluctuations. In other words, if house prices fall or if a borrower experiences a loss in income, the loan continues as is with no change in terms. By contrast, other markets occasionally require margin calls whereby a borrower is compelled to inject capital after a decline in equity. Fixed-rate mortgages (FRMs) also insure borrowers against interest rate increases by locking in rates at origination. By contrast, adjustable-rate mortgages (ARMs) automatically pass on savings to borrowers when rates fall, but they also lead to higher payments when interest rates rise. In this regard, adjustable-rate mortgages facilitate the pass-through of monetary policy-induced interest rate changes to the economy. During periods of accommodative policy, a greater saturation of adjustable-rate mortgages enhances the stimulative impact of lower interest rates on consumer spending and house prices, while the reverse happens during monetary tightening.62Garriga and Hedlund, “Housing Finance.” These authors provide a discussion of adjustable-rate vs. fixed-rate mortgages.
Interest Rate Convertibility
There are several ways in which mortgage contract modernization could provide improved risk-sharing to households by making payments, principal, or both depend on economic conditions. To guide thinking, multiple studies have found that efficient mortgage design should incorporate payment reductions during recessions and debt reductions when house prices fall.63 Janice Eberly and Arvind Krishnamurthy, “Efficient Credit Policies in a Housing Debt Crisis,” Brookings Papers on Economic Activity (Fall 2014): 73–118; Guren, Adam, Arvind Krishnamurthy, and Tim McQuade, “Mortgage Design in an Equilibrium Model of the Housing Market,” 2019, Working Paper; and John Y. Campbell, Nuno Clara, and João F. Cocco, “Structuring Mortgages for Financial Stability” (working paper, 2018). They then propose an “automatic stabilizer” mortgage that converts from a FRM to an ARM when interest rates fall during a downturn.64Eberly and Krishnamurthy, “Efficient Credit Policies.” Such a contract would have allowed underwater borrowers during the crisis to automatically take advantage of lower mortgage rates without going through the refinancing underwriting process. This convertibility would entail a higher up-front cost, but it would deliver substantial insurance benefits to borrowers.65For a full quantitative analysis, see Adam M. Guren, Arvind Krishnamurthy, and Timothy J. McQuade, “Mortgage Design in an Equilibrium Model of the Housing Market” (NBER Working Paper No. 24446, National Bureau of Economic Research, Cambridge, MA, March 2018). Another option is to simply allow borrowers to refinance without requiring a home appraisal, similar in spirit to HARP during the crisis and to the FHA Streamline Refinance program. Such an approach offers a promising alternative to modification programs, which suffer from moral hazard and competitive frictions. However, the size of the gains to borrowers depends critically on upfront costs and on whether income documentation is needed. More burdensome requirements on either margin greatly reduce the scope of the program by excluding borrowers who have suffered from job loss or some other adverse income change—precisely the people who would most benefit from refinancing.66Anthony A. DeFusco and John Mondragon, “No Job, No Money, No Refi: Frictions to Refinancing in a Recession” (working paper, 2019). In light of strong evidence that upfront payment relief is more potent than reductions that are spread over the life of the loan, this streamlined refinancing option would deliver less relief during downturns than the automatic stabilizer mortgage because FRM interest rates do not fall as much as ARM rates in recessions. Continuing in this vein, an option ARM would deliver the most potent “stimulus” by allowing borrowers to make interest-only payments or even to temporarily engage in negative amortization up to some ceiling. In short, such a contract allows borrowers to delay principal payments based not just on overall economic conditions but also on their individual circumstances. In this regard, option ARMs provide the most insurance but at the highest cost.67Guren, Adam, Arvind Krishnamurthy, and Tim McQuade, “Mortgage Design in an Equilibrium Model of the Housing Market,” 2019, Working Paper.
Shared Appreciation Mortgages
While the previous proposals focus on interest rate risk, shared-appreciation mortgages (SAMs) would automatically adjust monthly payments in response to house price movements.68 Prominent proposals can be found in Robert J. Shiller, Rafal M. Wojakowski, M. Shahid Ebrahim, and Mark B. Shackleton, “Continuous Workout Mortgages” (NBER Working Paper No. 17007, National Bureau of Economic Research, Cambridge, MA, May 2011); and Atif Mian and Amir Sufi, House of Debt: How They (and You) Caused the Great Recession, and How We Can Prevent it from Happening Again (Chicago: University of Chicago Press, 2014). However, except in instances when payment reductions avert borrower default, any gains to borrowers come at the expense of losses to lenders, creating ramifications for the financial system as a whole. For this reason, mortgage design should be evaluated in the context of both household and systemic risk management. Recent research shows that the devil is in the details when it comes to the effects of SAMs. An implementation that links mortgage payments and principal to some national house price index would severely harm financial fragility by causing a wave of bank failures and bailouts in the event of house price declines. However, indexing payments and principal to the local component of house prices would likely reduce foreclosures and systemic risk because banks could construct a geographically diversified portfolio.69Dan Greenwald, Tim Landvoigt, and Stijn Van Nieuwerburgh, “Financial Fragility with SAM?” (MIT Sloan Research Paper No. 5261-17, MIT Sloan School of Management, Cambridge, MA, August 2018). Importantly, SAMs would also increase payments when house prices rise. Deviating from this design by prohibiting payments from ever rising would not improve risk sharing. One challenge to implementing SAMs is the need for a reliable, real-time measure of local house prices. While local house price information is more available than ever, this data requirement could still prove burdensome for lenders and regulators while opening the door to possible errors. Another question is whether to index just the payment or both the payment and principal to house prices. Moreover, should indexation kick in upon any change in house prices or only for changes beyond some threshold? Recent research indicates that, in order for lenders to be willing to voluntarily adopt such an arrangement, the threshold for triggering modifications should be on the order of 15 percent, leaving households to cope with smaller fluctuations in house prices.70See Hanming Fang, You Suk Kim, and Wenli Li, “The Dynamics of Subprime Adjustable-Rate Mortgage Default: A Structural Estimation” (Working Papers 16-2, Federal Reserve Bank of Philadelphia, Philadelphia, PA, February 2016). Moreover, both the payment size and principal should adjust in response to local house price movements to most effectively reduce the incidence of borrower default. Importantly, because such indexation does not depend on the financial characteristics of the individual borrowers or the price of their specific houses, the scope for moral hazard is minimal.
Embrace Innovation
Any insistence on maintaining the 30-year fixed-rate mortgage with its rigid amortization schedule as the central pillar of US housing finance ignores changing economic realities and leaves potential gains from financial innovation unrealized and on the table. After all, financial markets are deeper and more developed than they were during the formative years of the current government-dominated US housing finance system. While some people have pointed to the rise of automated origination replacing face-to-face risk-assessment as a factor contributing to the previous housing bust, research reveals the benefits that FinTech is already delivering despite the regulatory hurdles it faces.71Andreas Fuster, Matthew Plosser, Philipp Schnabl, and James Vickery, “The Role of Technology in Mortgage Lending” (NBER Working Paper No. 24500, National Bureau of Economic Research, Cambridge, MA, April 2018). From 2010 to 2016, FinTech lenders increased their mortgage market share from 2 percent to 8 percent, and evidence indicates that they process mortgage applications 20 percent faster and are more amenable to refinancing, with no adverse consequences for mortgage default. There is also no evidence that such lenders target vulnerable borrowers. Such lenders could provide loan modifications or payment relief in real-time in response to changing local or even individual economic conditions. For example, laid-off borrowers could provide unemployment insurance claims to their borrower and receive a quick decision regarding possible forbearance. In this regard, while automation may have initially de-personalized the loan approval process, financial innovation and the increased availability of data could lead to closer alignment between borrowers and lenders in a way that delivers mutual gains and systemic improvements in risk. However, moving toward such a modified state of affairs will require regulatory creativity and a willingness on the part of policymakers to allow greater experimentation in the mortgage market. While there may be lingering hesitation to embrace alternative lending models in light of the financial crisis from a decade ago, it is again important to point out that the body of research generally indicates that the foreclosure crisis was driven by highly leveraged borrowing in the prime market rather than malfeasance in subprime lending or non-traditional loan features.
Conclusion
Unfortunately, sometimes it takes a crisis to uncover the deficiencies in a country’s policy landscape. Such was the case during the Great Depression, when balloon mortgages with short durations created a cascade of defaults, declining house prices, and financial instability that sowed the seeds for the creation of the large government-backed institutions that now play such a major role in US mortgage lending. Similarly, the Great Recession revealed that high leverage lending—driven in part by low interest rates but also by technological and policy forces—can act as a source of macroeconomic fragility, especially when households lack access to a wider array of rich financial instruments to use for managing risk in their own budgets.
The growing body of research and lived experience establishes that the United States currently resides below its homeownership-financial stability frontier. In particular, GSEs are neither a necessary nor a sufficient condition for achieving a robust homeownership rate, and numerous policy reforms— from introducing greater market forces to right-sizing prudential regulations to streamlining both refinancing and foreclosure to facilitating greater mortgage design innovation—are all promising avenues to pursue. However, the research also indicates that the devil is in the details, and more work is warranted to investigate these issues in greater depth and with more quantitative precision.